https://doi.org/10.1007/s41748-017-0030-x
ORIGINAL ARTICLE
Aridity and Risk Calculations in Saudi Arabian Wadis: Wadi Fatimah
Case
Zekai Şen1,3 · Saad Al‑Harithy2 · Saleh As‑Sefry2 · Mansour Almazroui1
Received: 21 September 2017 / Accepted: 27 November 2017 / Published online: 6 December 2017 © The Author(s) 2017. This article is an open access publication
Abstract
Background Infrequent rainfall and rare flash floods are the primary sources of water in semi-arid and arid regions and are the key aspects in the management of water supply. In these regions, rainfall varies temporally and spatially with infrequent high intensities and sporadic occurrences, making it impossible to systematically record measurements as a proper time series.
Purpose The main purpose of this paper is to present temporal (risk assessment) and spatial (isohyet maps) methods for the evaluation of monthly rainfall water volumes and infiltration rates. Additionally, an aridity index based on rainfall and temperature measurements is proposed for use in semi-arid and arid regions.
Method The limited data available for semi-arid and arid regions are treated using effective probabilistic and statistical methods. Calculation of the volume of rainfall is achieved through a simple hydrological procedure which involves exam-ining monthly isohyet maps based on a set of rainfall measurements from weather stations in scattered locations. Calcula-tion of rainfall and infiltraCalcula-tion risks are performed according to the logarithmic normal probability distribuCalcula-tion funcCalcula-tion. Furthermore, the potential monthly rainfall and infiltration rates are calculated using a set of pre-selected risk percentages.
Results Aridity index, rainfall volume, and risk values are presented for Wadi Fatimah, which is located in the western Saudi Arabia. Potential rainfall and infiltration rates are calculated on a monthly scale using a set of pre-selected risk percentages. These simple calculations provide a sound basis for future studies on groundwater resource storage strategy, operation, and management.
Conclusions Water management studies can be best advanced through simple but effective assessment methods, as presented in this paper with specific applications to the Wadi Fatimah drainage basin that joins the Red Sea.
Keywords Climatology · Hydrology · Aridity · Recharge · Risk · Rainfall · Volume · Wadi · Groundwater
1 Introduction
Atmospheric general circulation, the location and distribu-tion of mountain ranges, high altitude plateaus, and water bodies on the Earth’s surface are among the most significant causative factors playing an important role in the occurrence of rainfall. Rainfall is most abundant where the air rises (equatorial area), and limited where it sinks (sub-tropical
areas), a variable which is difficult to estimate. Arid regions experience high temperature and evapotranspiration and in general have less than 100 mm of annual rainfall, which weakly recharges the groundwater resources due to low per-colation rates. Global climates are classified by their two most important elements: temperature and precipitation
(IPCC 2007). A similar classification method is presented
by Abdullah and Al-Mazroui (1998) for the rainfall
climatol-ogy of Saudi Arabia. The geographical distribution of the climate patterns shows warm and moist characteristics in the low latitudes, while warm and much drier climates prevail in the subtropics such as the Arabian Peninsula (Al-Sefry et al.
2004). Recently, Almazroui et al. (2015) classified the five
climate zones of the Arabian Peninsula, in particular over Saudi Arabia which accounts for about 80% of the Peninsula
(Almazroui et al. 2012a, b).
Annual evapotranspiration and runoff rates have been studied in detail by various researchers (e.g., Schreiber * Zekai Şen
1 Center of Excellence for Climate Change Research/ Department of Meteorology, King Abdulaziz University, Jeddah, Saudi Arabia
2 Saudi Geological Survey, P.O. Box 54141, Jeddah 21514, Kingdom of Saudi Arabia
3 Engineering and Natural Research Faculty, Istanbul Medipol University, Beykoz, Istanbul 34810, Turkey
1904; Turc 1954; Pike 1964; Arora 2002). They have suc-ceeded in expressing the annual evaporation rates in the context of the aridity index. Their work has concentrated mainly on drainage basins in the humid regions. In the arid regions, the main drainage basins are wadis which differ in some important ways from the basins in humid areas. The term wadi is used for drainage basins in arid regions, where there is little vegetation at high elevations, but qua-ternary alluvial depositions at lower levels in the valleys
and depressions (Şen 2008). Wadis differ from humid region
watersheds, as in that they experience limited rainfall and have high evaporative fluxes. The annual mean evapotran-spiration and surface runoff are the functions of temperature (solar irradiation) and rainfall, and determine the renewal of surface and groundwater resources. In humid regions, the solar irradiation and evapotranspiration rates are much lower than in arid and semi-arid areas. High solar irradiation leads to high evaporation rates, thus surface drying occurs. This process increases the duration and intensity of drought and produces low runoff. On the other hand, high solar irradia-tion warms the atmosphere and increases the water holding capacity, which in turn increases the rainfall occurrence.
Pot-ter (1992) defined arid and semi-arid regions based on the
value of the precipitation to evaporation ratio, P/E. A region is deemed arid, if the value of this ratio is less than 0.5, for values between 0.5 and 1.0, the region is considered semi-arid, whereas in humid regions, the ratio is greater than 1.0. In arid zones, the rain gauge density is low, and therefore, lumped-input modeling techniques are not appropriate due
to the large sampling errors. Pilgrim et al. (1988) stated that
if the drainage area is less than 10 km2, it is not uncommon
for a flood event to occur at the outlet as a result of an inten-sive storm rainfall over a limited area that is not adequately represented by the gauge readings.
Reduction of disaster risk is a very significant research topic for sustainable development promoted by a joint work-shop and report by the United Nations International Strat-egy for Disaster Reduction, the Islamic Development Bank and the Presidency of Meteorology and Environment, Saudi
Arabia (Regional Workshop 2009). Isohyet maps, kinematic
waves, and rational methods are used for synthetic flash flood hydrograph estimations in arid regions (Sevinç and
Şen 2007). It is almost impossible to achieve reliable
real-time prediction of extreme events through numerical models, although estimates are possible for a set of recurrence inter-vals (risks), 5-year (0.20), 10-year (0.10), 25-year (0.04), 50-year (0.02), and 100-year (0.01), which are necessary for any strategic planning to mitigate against the destructive water effects in a region.
The main purpose of this paper is to present simple tem-poral (risk assessment) and spatial (isohyet maps) methods to evaluate the monthly rainfall water volumes and infiltra-tion rates. In addiinfiltra-tion, an aridity index based on rainfall and
temperature measurements is used for arid regions, particu-larly for Saudi Arabia.
2 Study Area and Climatology
Wadi Fatimah is the closest drainage basin to the three important cities, Jeddah, Makkah and Taif, in the central western part of Saudi Arabia. Jeddah is located on the coast of the Red Sea, downstream from Wadi Fatimah, the holy city of Makkah lies in the middle-stream belt at 260 m above the mean sea level (MSL), and Taif is located at 2400 m above the MSL near the upstream portion of the same wadi. Although this region has a desert climate, its proximity to the Red Sea has a slight modifying effect on this pattern and this is reinforced by the high Sarawat Mountains (Hijaz
Escarpment) in the east (Fig. 1). The Sarawat Mountains act
as an orographic cooling barrier, and hence more rainfall episodes are expected around Taif city, which is situated in the upstream highlands of this wadi.
The infiltration rate is low due to the carbonate and quartz–feldspar epiclastic rocks in the Fatimah group
(Moore and Al-Rehaili, 1989). There are some studies on the
climate variability in the region (e.g., Italconsult 1973;
Al-Qurashi 1981 and Al-Jerash 1985; Almazroui et al. 2012a,
b). Regional studies have been undertaken by Al-Jerash
(1983, 1988), Şen (1983), Nouh (1987, 1988) and Abdulla
and Al-Badranih (2000).
Convective storms are coupled with orographic effects in summer, and in winter months, Mediterranean-born fron-tal rainfall events may lead to occasional flash floods with considerable damage to human life and property in Saudi Arabia. Several devastating flash floods like the ones on 25th November 2009, 26th January 2011 and 17th Decem-ber 2015 at Jeddah alerted the administrators to the need for in-depth research on predictions of extreme events with
a specific risk dimension (Almazroui et al. 2012a, b).
Win-ter rainfall is caused by disturbances in the MediWin-terranean Sea, the Sudanese depression, and by westerly waves in the upper atmosphere. As for summer rainfall, this is caused by a combination of the northward advance of the southwesterly monsoon and the intertropical convergence zone (Al-Yamani
and Şen 1993). In spring, the low-level convergence lines at
the Red Sea are responsible for the large amount of rainfall. These rains are favored by the presence of an upper level trough of 700 mb. They also enhance the Sudanese
depres-sion and extend across the Red Sea (Al-Qurashi 1981). For
these rainfall events, the main sources of moisture are the Indian Ocean, the Arabian Sea, and the Red Sea with some contributions from the Mediterranean Sea during the winter
and spring seasons (Şen 1983).
Scanty, irregular and unreliable rainfall events occur over most parts of Saudi Arabia in the wet
(November–April) season (Almazroui et al. 2014). How-ever, over the mountainous regions such as the Sarawat Mountains, the rainfall patterns are distinctly differ-ent from the rest of the country, due to topographically driven convective rainfall events (Abdullah and
Al-Maz-roui 1998). In Saudi Arabia, the average annual rainfall
is 93 mm within a range of 25–229 mm (Almazroui et al.
2017). The annual rainfall varies from 50 to 100 mm along
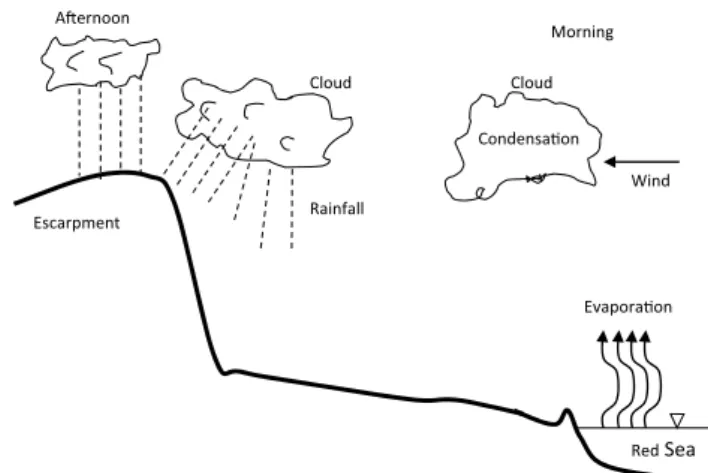
the Red Sea coast encompassing Jeddah city (52 mm), which is under the influence of cold-weather penetrations of Mediterranean origin during the winter season. The number of rainfall events is very low and some years may have no rainfall events at all, a typical characteristic of a semi-arid region. Recharging of the groundwater takes place upstream of the wadi after each rainfall event. Each rainfall event is provoked by convective and orographic mechanisms and, during winter, by the cyclonic frontal mechanism. However, orographic rainfall occurs more fre-quently than the other types. Evaporation from the Red Sea is driven towards the Hijaz Escarpment hills in the
after-noon by the circulation of the westerly wind (Fig. 2). The
hills upstream of Wadi Fatimah form a barrier to the air movements forcing the moist air upward, where it becomes cold and finally generates rainfall.
The available meteorological data indicate that rainfall events occur most often in winter at low altitudes which include the cities of Jeddah and Makkah, but additional events have occurred over the escarpment at Taif city during pre-autumn and post-winter seasons. The number of rain-fall occurrences (frequency) at the two meteorology stations near Jeddah (on the Red Sea coast) and Taif (on top of the
N
Jeddah
Red
Sea
Taif
Makkah
Fig. 1 Location map for Wadi Fatimah
Wind Condensa on Escarpment Cloud RedSea Cloud Rainfall Evapora on A ernoon Morning
Sarawat Mountains) show the aforementioned pattern clearly
(Fig. 3).
In Saudi Arabia, the conventional four rainfall seasons are dependent on the air mass movements and region
(Al-Yam-ani and Şen 1993; Almazroui 2011). There are more regular
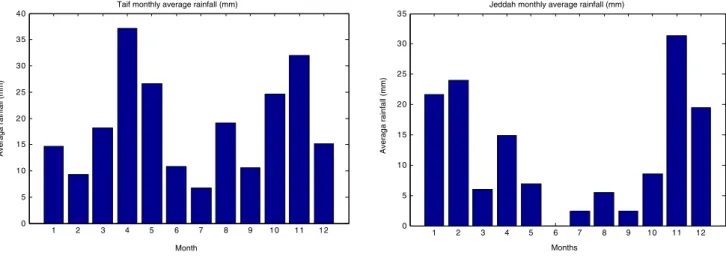
rainfall events in the Taif region (above the Hijaz Escarp-ment at high altitudes) than in Jeddah (Hijaz Coastal area, low altitudes). In each month, there are more rainfall events at Taif than Jeddah, which imply that the upstream part of Wadi Fatimah is subject to more storm events than the
downstream portion. Figure 4 presents the average monthly
rainfall amount. Comparison of Fig. 4a, b shows that during
the months December–February, the amount of rainfall in Jeddah is higher than in Taif. This indicates clearly that the Mediterranean climate descends from the northwest to the area under study, but due to the Red Sea trough, it has more effect on the low-lying Hijaz coastal area than on the down-stream portion of Wadi Fatimah as a result of the penetration of air masses further south. During the other months, the effect of Indian monsoon climate pervades from the south and southeast over the area and becomes more pronounced at high elevation than in the Red Sea coastal area.
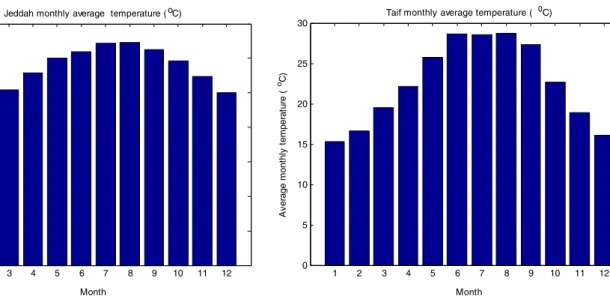
There are also distinct differences in the mean daily tem-peratures between the low-lying region of Tihamat Hijaz and Escarpment highlands. Minimum temperature averages in the two areas are about 23 and 15 °C in January with maximum temperatures in July at 32 and 28 °C, respectively.
Monthly average temperatures are shown in Fig. 5. At both
the high and low altitudes, there is a cyclical variation with high temperatures in June–August and low temperatures in December–February. During the summer months, the dif-ference in monthly average temperature is smaller than in winter months. This indicates that in summer, the impact of the Hijaz Escarpment is not as significant as it is in winter.
3 Aridity Index
For arid and semi-arid regions in general, any practical simple aridity index is defined mainly by the precipita-tion deficiency leading to water supply shortages and dry spells (drought). Strategic surface and groundwater resource management require this scarcity to be scientifically deter-mined in terms of deficit amounts and drought duration
and intensity (Al-Sefry et al. 2004). Various definitions for
0 2 4 6 8 10 12 14 16
JAN FEB MAR APR MAY JUN JUL AUG SEP OCT NOV DEC 0 1 2 3 4 5 6 7 8 9
JAN FEB MAR APR MAY JUN JUL AUG SEP OCT NOV DEC Month
a
b
Frequenc y Frequenc y MonthFig. 3 Frequencies of monthly rainfall events a Jeddah, b Taif
1 2 3 4 5 6 7 8 9 10 11 12 0 5 10 15 20 25 30 35
40 Taif monthly average rainfall (mm)
Month Averaga rainfall (mm) 1 2 3 4 5 6 7 8 9 10 11 12 0 5 10 15 20 25 30
35 Jeddah monthly average rainfall (mm)
Months
Averaga rainfall (mm)
precipitation amount and duration may be applied such as “drought is a period of more than some particular number of days with precipitation less than some specified small
amount” (Great Britain Meteorological Office 1951). The
chosen specified small amount (threshold) is site and/or region-specific and depends on the problem being studied. The qualitative measurements for drought duration will vary depending on the meteorological features of each country. In England, for instance, 15 consecutive rainless days are considered to be the start of a drought period. A more severe drought duration is considered to be the one lasting more than 30 days. However, in arid regions such as Saudi Arabia, a duration of more than 2 years without rainfall is considered to be the start of a drought period. For instance, in Bali, a 6-day rainless period signals drought. In some areas, drought duration is thought to have started, if the amount of rainfall falls below 2.5 mm. Another approach is to consider rain-fall amount as a measure of aridity, so that if 21 consecu-tive days have only one-third of the historical normal rain-fall, then this is considered a sign of aridity. There are also other definitions that are based on the percentage of rainfall amount. For instance, if the annual rainfall is less than 60 or 70% of the average measured amount of normal rainfall, then this year is considered to be a precursor to a possible drought spell. In some other locations, 85% of the annual rainfall may be taken as a threshold, and such thresholds may be proposed depending on the hydro-meteorological
condition of the area (Şen 2015).
In the literature, many aridity indices exist, including
the De Martonne (1926) aridity index, the Thornthwaite
(1948) indices of humidity and aridity and the UNESCO
(1979) aridity index. A detailed description of each
arid-ity index is presented by Şen (2015). In this article, a new
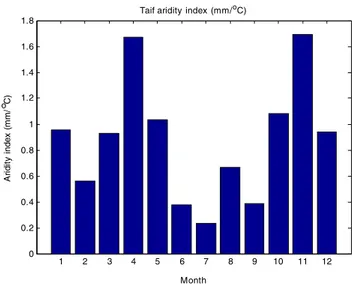
aridity index, Aindex, is defined as average monthly rainfall,
̄
R per degree centigrade of average monthly temperature,
̄
T as follows:
The unit of measurement is mm/°C and its application using monthly temperature and rainfall records from Jeddah and
Taif locations results in the graphs in Fig. 6.
Its value is zero for non-rainfall occurrence, but in general, it usually has a value of close to 1 for the rain-fall–temperature relationship. As can be seen from this figure for the two stations in Saudi Arabia, a maximum value of around 2 may be assumed, because the temper-ature in the area under study is high. Potential ground-water recharges take place at high aridity index values with low evaporation and short drought durations.
Fig-ure 6 indicates that aridity indices in Jeddah (low-lying
lands) are less than 1 except in November. In Taif (high altitude more than 2000 m above mean sea level), April and November have high aridity indices. The Indian mon-soonal effect occurs in April, whereas the Mediterranean type of weather pattern takes place in November. In arid regions, calculation of groundwater recharging helps to plan better and more sustainable water management activi-ties. Therefore, groundwater harvesting possibilities are enhanced after each rainfall storm and subsequent runoff
and flash flood (Şen et al. 2011). Furthermore, the possible
effects of climate change on arid regions must be taken
into consideration (Şen et al. 2012).
(1) Aindex= ̄ R ̄ T 1 2 3 4 5 6 7 8 9 10 11 12
Jeddah monthly average temperature ( C)
Month Av er age te m per at ur e ( C) o o 1 2 3 4 5 6 7 8 9 10 11 12
Taif monthly average temperature ( 0C)
Month Ave rage mo nt hl y te m perat ure ( oC) 0 5 10 15 20 25 30 35 0 5 10 15 20 25 30
4 Rainfall Water Volume
To calculate the potential average monthly recharge of aqui-fer groundwater storage, it is necessary to draw monthly mean areal precipitation patterns for the region. For this purpose, monthly isohyet maps are prepared for the Wadi Fatimah catchment area, but for the sake of brevity, only the
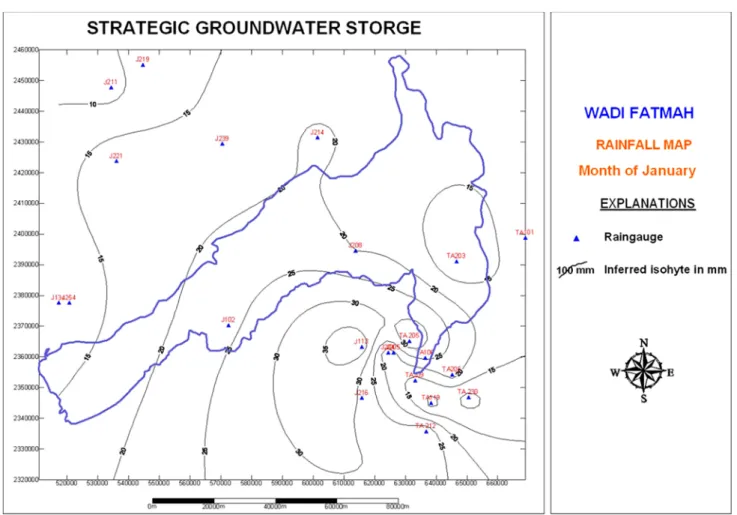
January isohyet map is presented in Fig. 7. In January, peak
areal precipitation is in the southern part of the Fatimah basin with a 35 mm contour line. From this peak, regional rainfall decreases steadily in the direction of the east, north and west, with only 15 and 20 mm in the Fatimah catchment. In the mid-south, 25 mm contours show a level of precipi-tation that is useful for water resource planning, including groundwater recharge.
Accordingly, the groundwater calculations should take into consideration the part of the catchment area that lies between the 15 and 25 mm contours. Annually, the upper catchment receives an average rainfall of almost 300 mm, and this level steadily decreases towards the Red Sea, where it is 70 mm per year at Jeddah. Rich, productive rainfall events are due to frontal weather movements during the win-ter season, which starts vaguely from December until the end of April. A high percentage of annual rainfall occurs within the first few months of this period. In the hotter months, there are sporadic rainfall occurrences of a mainly oro-graphic type along the Hijaz Escarpment upstream of Wadi Fatimah. Convective rainfall occurrences are somewhat rare, and they take place in the middle or lower portions of the wadi. The combination of orographic and frontal weather systems during the winter season leads to the most intensive rainfall occurring over the upstream region.
Both temporal and spatial rainfall patterns over Wadi Fati-mah are used to calculate the water volume available from
the monthly rainfall, RV. These calculations are achieved
by multiplying the drainage area, Ai, confined between the
two successive contours Pi and Pi−1 and the average rainfall
value of the two contours.
where n is the number of consecutive contour intervals. Finally, the water volume available from monthly rainfall, between the successive contours in different months and
their cumulated values are presented in Table 1.
This table estimates the water volume available from monthly rainfall for the whole of the Fatimah catchment area
at roughly 85 × 106 m3. The total annual rainfall volume
that falls on the Wadi Fatimah drainage basin area is about
1.0 × 10⁹ m3. The monthly distribution of the volumes is
given in Fig. 8.
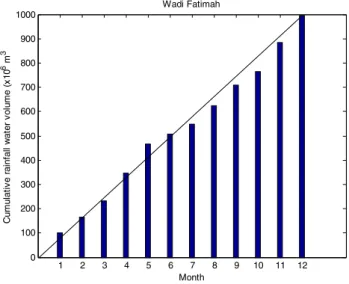
Cumulative rainfall water volume assessments are
pre-sented in Fig. 9 for the whole year. It is evident from this
fig-ure that there is an almost constant volume of total monthly
rainfall of about 85 × 106 m3/month, which is equal to the
slope of this graph. The standard deviation of rainfall water
volume is almost 1/3 of the mean value, 28 × 106 m3. All
of the rainfall water volume cannot be retained as natural recharge of the wadi quaternary deposit aquifers because of evaporation, depression and runoff losses.
5 Rainfall Volume and Risks
Figure 7 indicates the scattered locations over the study
area of 24 meteorology stations with 20 years of rain-fall records. It is possible to calculate potential rainrain-fall
(2) RV= n ∑ i=2 Ai(Pi−Pi−1) 3 1 2 3 4 5 6 7 8 9 10 11 12
Jeddah monthly aridity index (mm/ C)
Month Ar id ity in de x (m m/ C) o o 1 2 3 4 5 6 7 8 9 10 11 12
Taif aridity index (mm/oC)
Month Ar id ity in de x (mm/ C) o 0 0.2 0.4 0.6 0.8 1 1.2 1.4 0 0.2 0.4 0.6 0.8 1 1.2 1.4 1.6 1.8
amount at a given set of risk levels. Before calculating the risk levels, the probability distribution function (pdf) is determined for each month for Saudi Arabia, as this is applied for rainfall harvesting in Wadi Al-Lith (Almazroui
et al. 2017). It has been already determined by various
researchers working in the field of hydrology that the monthly rainfall data adheres to the logarithmic normal
pdf model (Aitcheson and Brown 1957; Benjamin and
Fig. 7 January isohyet map
Table 1 Monthly and annual average rainfall water volumes
Contour
lines (mm) Monthly rainfall volumes (× 10 6 m3)
Jan Feb Mar Apr May Jun Jul Aug Sep Oct Nov Dec
0–5 0.997 1.275 9.2656 7.08 1.42 5–10 10.367 8.278 10.69 1.36 9.391125 24.31 0.36 7.82 10–15 8.64 28.165 32.38 6.24 5.02 11.31 8.77 6.32 31.17 34.59 10.94 6.66 15–20 42.66 23.412 14.809 9.5 12.06 22.19 0.14 34.6 30.82 15.9 20.08 32.2 20–25 41.24 1.875 5.472 16.16 61.5 0.46 11.08 18.33 2.3 20.94 36.08 25–30 9.13 1.6 14.41 24.5 22.53 4.63 1.83 46.22 36.04 30–35 0.564 14.12 8.28 0.91 20 35–40 0.788 16.89 2.06 1.36 40–45 0.47 17.04 1.13 45–50 8.68 1.7 50–55 2.46 Total 101.67 64.816 65.636 116.19 117.61 52.616725 40.3 74.89 84.95 66.13 118.18 110.98
Cornell 1970). The following steps are taken to produce the risk calculation.
(1) After determination of the theoretical pdf, calculate the logarithmic mean α, of the variable concerned
(2) Calculate the logarithmic standard deviation β, of the same variable,
(3) Identify the minimum data value (4) Identify the maximum data value
(5) The range is the difference between the maximum and minimum values; let the variable that represents this range be labeled x. Divide the range into sub-intervals of length 0.01
(6) Calculate the theoretical logarithmic probability val-ues according to the logarithmic normal pdf expression
(Benjamin and Cornell 1970):
The corresponding cumulative pdf (cdf) can be obtained after an integration operation:
Plotting x against z yields the graphical
representa-tion of the logarithmic normal cdf
(7) Finally, plotting x against 1 − z provides the necessary risk graphs for the variable concerned
The mean and standard deviation of the logarithmic normal pdf of the rainfall of each month is calculated and presented
in Table 2.
One can observe that April and October have the maximum averages. This implies that there are two rainfall regimes over the study area in one year. However, high standard deviations are coupled with low mean values. This shows that variability is greater in areas where the rainfall is low. The risk level of disaster increases with the standard deviation and this point is very significant in strategic planning studies.
The coefficient of variation, Cv, is defined as the division of
the mean value, m, by the standard deviation, S, which gives the average rainfall amount per unit of standard deviation as,
The higher the coefficient of the variation the more
sporadic the rainfall, and so Table 2 suggests that there
(3) f (x) = 1 x𝛽√2𝜋 exp � −1 2 (Lnx − 𝛼)2 𝛽2 � (4) z = ∞ ∫ 0 f (x)dx (5) CV= m S 4 1 2 3 4 5 6 7 8 9 10 11 12 0 20 40 60 80 100 120 Wadi Fatimah Month Ra in fa ll vo lu me (x 10 6 m 3) Monthly average
Fig. 8 Monthly rainfall volume distributions over the whole Wadi Fatimah drainage area
1 2 3 4 5 6 7 8 9 10 11 12 0 100 200 300 400 500 600 700 800 900 1000 Wadi Fatimah Month Cu mu la tive ra in fa ll wa te r vo lu me (x 10 6 m 3
Fig. 9 Cumulative rainfall water volumes (×106 m3)
Table 2 Monthly rainfall logarithmic parameters
Months Jan. Feb. Mar. Apr. May Jun. Jul. Aug. Sep. Oct. Nov. Dec.
Logarithmic mean 2.83 2.25 2.64 3.08 2.74 1.98 1.93 2.54 2.78 3.04 3.04 2.81
Logarithmic standard deviation 0.46 0.7 0.79 0.65 1.16 1.42 1.22 0.9 0.88 0.49 0.4 0.52
are no persistent rainfall events in the summer months. In general, the risk, r, is the probability, P, that the rainfall amount, R, will be higher than a given threshold value,
RT given as:
There is a risk graph for each month, but in Fig. 10 for
the sake of brevity, only the January rainfall–risk relation-ship is given.
The open circles represent the average monthly rainfall values, and the best fit theoretical logarithmic normal cdf is shown as a solid line. It is now possible to calculate the probability of average monthly rainfall occurrence for January, for example, the probability of 10 mm or more of rainfall is 88% (dashed horizontal and vertical lines). The same figure shows a 10% risk of an average rainfall amount of 30 mm or more. In practical applications, the selected return period (risk) sets are 5-year (20%), 10-year (10%), 25-year (4%), 50-year (2%) and 100-year (1%).
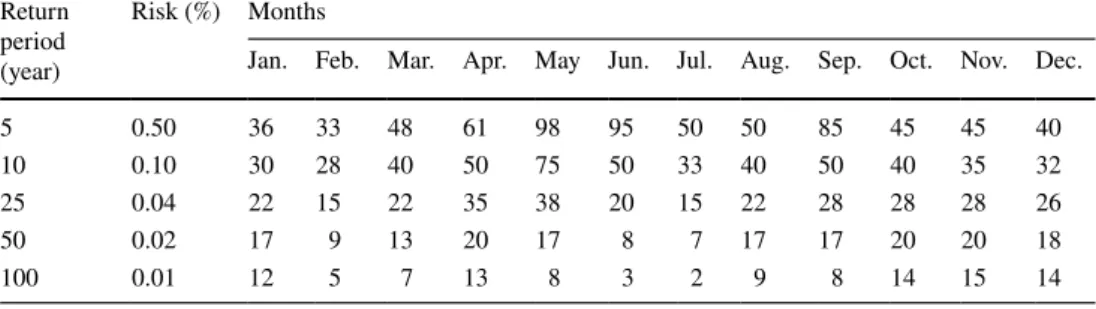
Table 3 presents the monthly average rainfall amount
for these return periods (risk). The advantage of the risk
values shown in Table 3 is that they may be used for
plan-ning purposes. For instance, for strategic planplan-ning for, (6) r = P(R > RT)
say a 25-year return period (4% risk), the corresponding rainfall amounts for each month are available in the third
row of Table 3.
6 Infiltration Volume and Risk
Infiltration process is the percolation of water through the soil surface into the subsurface, and is the most impor-tant contributor to groundwater recharge. In arid regions, recharge of unconfined aquifers occurs through infiltration from ephemeral streams following substantial flooding (Dein
1985).
Infiltration rates through soils vary greatly depending on the place and time. Spatial variation is affected by the geol-ogy and topography of the land surface. For example, on steep slopes, a significant fraction of the rainfall becomes runoff. Different textures and structures in the sub-soil lay-ers can affect the downward movement of water. Despite the highly complex nature of the infiltration process, sev-eral methods have been developed to estimate it (Green and
Ampt 1911; Horton 1940; Philip 1957). The importance of
the infiltration process is obvious, because it controls the recharging of the groundwater, regulates floods, prevents soil erosion, and provides water to plants. In this paper, infiltra-tion estimates are made from field infiltrainfiltra-tion data collec-tion according to the three rainfall storm duracollec-tions using the
Horton model, and the results are given in Table 4.
Complete infiltration tests are carried out in wadi beds, and infiltration volumes are obtained for the storm
dura-tions indicated in Table 4, although they turned out to
be high compared to the maximum possible infiltration
Fig. 10 Rainfall-risk graphs for January monthly averages
Table 3 Monthly average rainfall amounts (mm) for different risk levels
Return period (year)
Risk (%) Months
Jan. Feb. Mar. Apr. May Jun. Jul. Aug. Sep. Oct. Nov. Dec.
5 0.50 36 33 48 61 98 95 50 50 85 45 45 40
10 0.10 30 28 40 50 75 50 33 40 50 40 35 32
25 0.04 22 15 22 35 38 20 15 22 28 28 28 26
50 0.02 17 9 13 20 17 8 7 17 17 20 20 18
100 0.01 12 5 7 13 8 3 2 9 8 14 15 14
Table 4 Wadi Fatimah calculation of volume of infiltration through the alluvium
Storm duration (h)
Soil infiltration
constant (k) Area exposed to infiltration (km2) Calculated infiltra-tion volume (× 106 m3)
3.0 37.9 187.5 433.0
6.7 37.9 187.5 965.0
volume shown in Table 5. Table 4 is for the entire Wadi
Fatimah, while in Table 5 the infiltrations are calculated
corresponding to a particular rainfall amount.
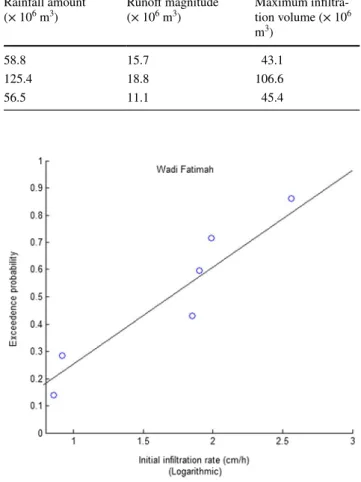
It is possible to plot hourly infiltration rates versus extreme probability values, which provide a basis for the
infiltration threshold probability as in Fig. 11. The vertical
axis in the figure does not show risk directly, but has to be converted to risk values by subtracting all the threshold probabilities from 1.
The plot in Fig. 11 implies that risk = (1 − exceedence
probability), and accordingly, Table 6 provides the
infil-tration rates corresponding to the given set of risk levels.
7 Conclusions
Arid regions suffer from the scarcity of hydrological data, among which rainfall and temperature records, measured at a number of meteorology stations, are relatively better than others. In general, the aridity index is based on rainfall and temperature records, and in this paper, a new definition for an aridity index is proposed for water resource assessment. Simple probabilistic methods for temporal models and iso-hyet maps for spatial evaluations are presented and applied to the Wadi Fatimah drainage basin in the central western part of Saudi Arabia. The volumes of monthly rainfall are calculated as risk attachments for pre-selected design dura-tions such as 5-, 10-, 25-, 50-, and 100-year. The infiltration capacity of the region is based on actual field infiltration measurements combined with a probability distribution model for risk calculations. In this paper, the rainfall and infiltration risk calculations are achieved according to logarithmic normal probability distribution function. Fur-thermore, the potential monthly rainfall and infiltration amounts are calculated under the set of pre-selected risk percentages. These simple calculations provide a sound basis for future studies on groundwater resource storage strategy, operation, and management. Climate model data may be useful to calculate risk and infiltration for the future climate and this is suggested for further study.
Open Access This article is distributed under the terms of the Creative Commons Attribution 4.0 International License ( http://creativecom-mons.org/licenses/by/4.0/), which permits unrestricted use, distribu-tion, and reproduction in any medium, provided you give appropriate credit to the original author(s) and the source, provide a link to the Creative Commons license, and indicate if changes were made.
References
Abdulla F, Al-Badranih L (2000) Application of a rainfall–runoff model to three catchments in Iraq. Hydrol Sci J 45(1):13–25 Abdullah MA, Al-Mazroui M (1998) Climatological study of the
south-western region of Saudi Arabia. I. Rainfall analysis. Clim Res 9:123–223
Aitcheson J, Brown JAC (1957) The log-normal distribution with special reference to its uses in economics. Cambridge University Press, Cambridge
Al-Jerash M (1983) Models of estimating average annual rainfall over the west of Saudi Arabia. J Fac Arts Humanit 3:107–152 Al-Jerash M (1985) Climatic subdivisions in Saudi Arabia: an
applica-tion of principal component analysis. J Clim 5:307–323 Al-Jerash M (1988) Climatic water balance in Saudi Arabia: an
appli-cation of Thornthwaite-Mather model. J Fac Arts Humanit 5:1–62 Almazroui M (2011) Calibration of TRMM rainfall climatology over
Saudi Arabia during 1998–2009. Atmos Res 99:400–414 Almazroui M, Islam MN, Athar H, Jones PD, Rahman MA (2012a)
Recent climate change in the Arabian Peninsula: annual rainfall and temperature analysis of Saudi Arabia for 1978 2009. Int J Climatol 32:953–966
Table 5 Maximum rainfall volume allowing infiltration Rainfall amount
(× 106 m3) Runoff magnitude (× 106 m3) Maximum infiltra-tion volume (× 106 m3)
58.8 15.7 43.1
125.4 18.8 106.6
56.5 11.1 45.4
Fig. 11 Cumulative probability of initial average infiltration rate
Table 6 Infiltration rate risk
levels Risk (%) Infiltration rate (cm/h)
5 2.9
10 2.6
25 2.4
50 1.67
Almazroui M, Islam MN, Jones PD, Rahman MA (2012b) Recent climate change in the Arabian Peninsula: seasonal rainfall and temperature climatology of Saudi Arabia for 1979–2009. Atmos Res 111:29–45
Almazroui M, Dambul R, Islam MN, Jones PD (2014) Principal com-ponents-based regionalization of the Saudi Arabian climate. Int J Climatol 35:2555–2573
Almazroui M, Dambul R, Islam MN, Jones PD (2015) Principal com-ponents-based regionalization of the Saudi Arabian climate. Int J Climatol 9:2555–2573
Almazroui M, Islam MN, Balkhair KS, Şen Z, Masood A (2017) Rain-water harvesting possibility under climate change: a basin-scale case study over western province of Saudi Arabia. Atmos Res 189:11–23
Al-Qurashi M (1981) Synoptic climatology of the rainfall in the south-western region of Saudi Arabia. Unpublished MSc Thesis, West-ern Michigan University, Michigan, USA
Al-Sefry S, Şen Z, Al-Ghamdi SA, Al-Ashi W, Al-Baradi W (2004) Strategic ground water storage of Wadi Fatimah—Makkah region Saudi Arabia. Saudi Geological Survey, Hydrogeology Project Team, Final Report
Al-Yamani MS, Şen Z (1993) Regional variations of monthly rain-fall amounts in the Kingdom of Saudi Arabia. J Earth Sci King 6:113–133
Arora VK (2002) The use of the aridity index to assess climate change effect on annual runoff. J Hydrol 265:164–177
Benjamin AC, Cornell CE (1970) Probability, statistics and decision making in civil engineering. Mc-Graw Hill, New York
De Martonne E (1926) Areisme et indice artidite. C R Acad Sci Paris 182:1395–1398
Dein MA (1985) Estimation of floods and recharge volumes in wadis Fatimah, Na’man and Turban. Unpublished M. Sc. Thesis, Faculty of Earth Sciences, King Abdulaziz University, Saudi Arabia Great Britain Meteorological Office (1951) The daily weather report:
overseas supplement
Green WA, Ampt GA (1911) Studies on soils physics: 1. The flow of air and water through soils. J Agric Sci 4:1–24
Horton RE (1940) An approach towards a physical interpretation of infiltration capacity. Soil Sci Soc Am Proc 5:399–417
IPCC (2007) Working group II contribution to the intergovernmental panel on climate change fourth assessment report climate change 2007: climate change impacts, adaptation and vulnerability, pp 9–10
Italconsult (1973) Climate in area VI south. Hydrological Special Paper no. 2, Saudi Arabian Ministry of Agriculture and Water (Unpublished)
Moore TA, Al-Rehaili MH (1989) Geologic map of the Makkah quad-rangle, sheet 21D. Kingdom of Saudi, Arabia, p 62
Nouh M (1987) Analysis of rainfall in southwest region of Saudi Ara-bia. Proc Inst Civ Eng 83(2):339–349
Nouh M (1988) On the prediction of flood frequency in Saudi Arabia. Proc Inst Civ Eng 85(2):121–144
Philip JR (1957) The theory of infiltration: 4. Sorptivity and algebraic infiltration equations. Soil Sci 84:257–264
Pike JG (1964) The estimation of annual runoff from meteorological data in a tropical climate. J Hydrol 2:116–123
Pilgrim DH, Chapman TG, Doran DG (1988) Problems of rainfall–run-off modelling in arid regions. Hydrol Sci J 33:379–400
Potter LD (1992) Desert characteristics as related to waste disposal. In: Reith CC, Thomson BM (eds) Desert and dumps? The disposal of hazardous materials in arid ecosystems. University of New Mexico Press, Albuquerque, pp 21–56
Regional Workshop (2009) The promotion of the regional implementa-tion of the internaimplementa-tional strategy for disaster reducimplementa-tion “disaster risk reduction for sustainable development” 19–21 May 2009, Jeddah, Saudi Arabia
Schreiber P (1904) Über die Beziehungen zwischen dem Niederschlag und der Wasserführung der Flüße in Mitteleuropa. Z Meteorol 21(10):441–452
Şen Z (1983) Hydrology of Saudi Arabia, Water Res. in the Kingdom of Saudi Arabia, Management, Treatment and Utilization, vol 1, College of Engineering, King Saud University, Riyadh
Şen Z (2008) Wadi hydrology. Taylor and Francis Group, Lewis Pub-lishers, Baca Raton, p 345
Şen Z (2015) Applied drought modeling, prediction and mitigation. Elsevier, Amsterdam
Şen Z, Al Alsheikh AA, Al-Dakheel AM, Alamoud AI, Alhamid AA, El-Sebaay AS (2011) Climate change and water harvesting pos-sibilities in arid regions. Int J Glob Warm 3(4):355–361 Şen Z, Al Alsheikh A, Alamoud A, Al-Hamid A, El-Sebaay A,
Abu-Risheh A (2012) Quadrangle downscaling of global climate mod-els and application to Riyadh. J Irrig Drain Eng 138:918–923 Sevinç S, Şen Z (2007) Determination of flash floods in western
Ara-bian Peninsula. J Hydrol Eng 12:1–6
Thornthwaite CW (1948) An approach toward a rational classification of climate. Georgr Rev 38(1):55–94
Turc L (1954) Le bilan d’eau des sols. Relation entre la precipitation, l’evaporation et l’ecoulement. Ann Agron 5:491–569
UNESCO (1979) Map of the world distribution of arid regions. Explan-atory note. Man and Biosphere (MAB). aridity index