2-D Adaptive Prediction based Gaussianity Tests in
Microcalcification Detection
M. Nafi Giircan, Yasemin Yardimci, A. Enis cetin
Bilkent University,
Dept. of Electrical and Electronics Engineering, Bilkent, Ankara TR-06533, Turkey
E-mail: gurcan©ee.bilkent .edu.tr
Abstract
With increasing use of Picture Archiving and Communication Systems (PACS), Computer-aided Diagnosis (CAD) methods will be more widely utilized. In this paper, we develop a CAD method for the detection of microcalcification clusters in mammograms, which are an early sign of breast cancer. The method we propose makes use of two-dimensional (2-D) adaptive filtering and a Gaussianity test recently developed by Ojeda et al. for causal invertible time series. The first
step of this test is adaptive linear prediction. It is assumed that the prediction error sequence has a Gaussian distribution as the mammogram images do not contain sharp edges. Since
microcalcifications appear as isolated bright spots, the prediction error sequence contains large outliers around microcalcification locations. The second step of the algorithm is the computation
of a test statistic from the prediction error values to determine whether the samples are from a Gaussian distribution. The Gaussianity test is applied over small, overlapping square regions.
The regions, in which the Gaussianity test fails, are marked as suspicious regions. Experimental results obtained from a mammogram database are presented.
1. COMPUTER-AIDED DIAGNOSIS
With increasing use of Picture Archiving and Communication Systems (PACS),
Computer-aided Diagnosis (CAD) methods will be more widely utilized [1]—{1O]. In this paper, we develop
a CAD method for the detection of microcalcification clusters in mammograms, which are an early sign of breast cancer. Microcalcifications are small, subtle abnormalities in breasts which
appear as isolated bright spots in mammogram images. Due to their small size, they can be
overlooked by examining radiologists.
In recent years, availability and proliferation of digital radiological image modalities
stim-ulated research activities around the world on CAD. A significant part of this research has
concentrated on the early detection of breast cancer, and in particular detection of microcalci-fications. In one of the early works in this field, a difference-image technique is employed [4]. The difference between signal-enhanced and signal-suppressed images is grey-level thresholded to obtain microcalcification locations.
Woods et al compare different pattern recognition techniques for the detection of microcalci-fications in mammograms [5]. With a small database of 24 images, they conclude that the simple Bayesian linear classifier perform the best. However, the results are dependent on the choice of the feature set and finding a good operating point.
Several researchers use wavelet transform based techniques for microcalcification detection [6—
8] . The wavelet transformed image is weighted at certain scales to enhance microcalcification
locations. The enhanced image is thresholded to obtain microcalcifications. Wavelet based
schemes mainly differ in their choice of wavelets and the selection of subband images used in the
reconstruction. Essentially, the resultant filtering operation is almost equivalent to band-pass
filtering.
Dengler et al. employ a nonlinear filtering approach for microcalcification segmentation [9]. The mammogram image is filtered with two Gaussian filters of different widths, and the
resul-tant images are subtracted from each other. The difference image is thresholded to determine
suspicious spots. These locations are then processed with morphological opening and thickening operations to determine the original shape and size of microcalcifications. They obtained 97% sensitivity at 70% specifity for 24 images they used.
Clarke et al propose a method based on tree structured non-linear filter and wavelet trans-form for microcalcification segmentation [3,10] . The mammogram image is first filtered with a multistage, tree-structured filters. The major filtering blocks are varying-size median filters. The purpose of these filters is to increase the signal-to-noise ratio and suppress the background structures. Next, quasi-range edge detector and wavelet transform are used for the extraction of microcalcifications. In [3,10] nine mammogram images are studied and the authors detected all the clusters with an average of four false clusters per image.
for microcalcification detection [1] . After the subband decomposition, the band-pass image is
divided into square regions and within these regions, third and fourth order statistics, skewness and kurtosis are measured. These statistics assume high values in regions with microcalcifications
whereas they are close to zero in regions without microcalcifications . Basedon this discriminative property, we tested the scheme in the Nijmegen Database consisting of 40 mammogram images. The scheme detected all the microcalcification clusters with 3.3 false clusters per image.
The current method we propose makes use of two-dimensional (2-D) adaptive filtering and
a Gaussianity test recently developed by Ojeda et al. for causal invertible time series [11]. The first step of this method is adaptive linear prediction. It is assumed that the prediction error sequence has a Gaussian distribution as the mammogram images do not contain sharp edges. Since microcalcifications appear as isolated bright spots, the prediction error sequence contains large outliers around microcalcification locations. The second step of the algorithm is the computation of a test statistic from the prediction error values to determine whether the
samples are from a Gaussian distribution. The Gaussianity test is applied over small, overlapping square regions. The regions, in which the Gaussianity test fails, are marked as suspicious regions.
In Section 2, 2-D adaptive filtering scheme is reviewed. Adaptive filtering based Gaussianity
tests are explained in Section 3. Experimental results are presented in Section 4. Finally,
conclusions and future work are given in Section 5.2. 2-D ADAPTIVE FILTERING
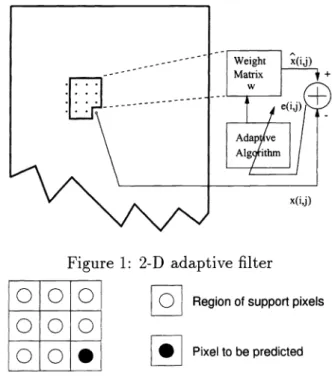
The adaptive filter predicts an image pixel x{i,j] at location (i,j) as a weighted average of pixels in the region of support. For the microcalcification detection problem, we use a 2-D
Least Mean Square (LMS) adaptive filter in the prediction step. Figure 1 illustrates the adaptive
filtering scheme. Recently, Ffrench et al used 2-D adaptive filtering for the enhancement of
microcalcification locations in mammogram images [12].
The region of support of the filter is chosen as the pixels to the left of and above the pixel to
be predicted as shown in Figure 2. The predicted value [i,j] is given as
[i,j] =
W(,)[l,k]X[il,jk],
= O,...,Xdiml, = O,...,Ydiml (1)
1=0 k=0
(1, k) (0, 0)
where x[i, j]is the input image of size Xdim X Ydim, W(,3) is the weight matrix at iteration (i, j). At each iteration the weights are adapted using an LMS-type adaptation algorithm.
The prediction error at pixel location (i,j) is computed as
Figure
000
000
oo•
Region of support pixels
Pixel to be predicted
1 MN
'1=
i=1 j=1
1: 2-D adaptive filter
Figure 2: Region of support of the adaptive filter
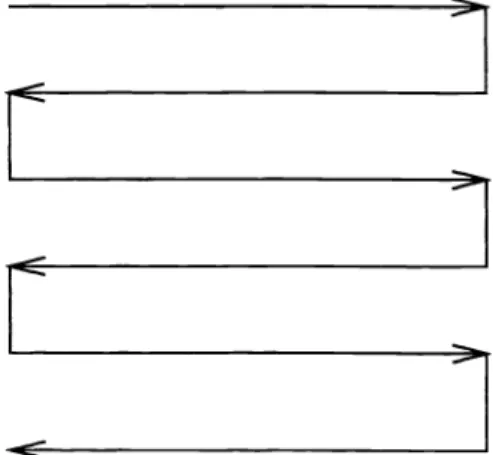
The original mammogram image is scanned row by row as shown in Figure 3. When the pixel to be predicted is at the end of a row, the scanning direction is reversed. Hence, unusual prediction errors do not occur due to the scanning mechanism.
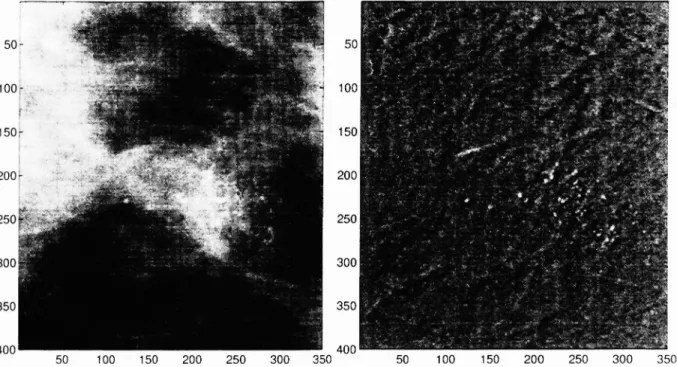
Figure 4 (a) shows part of a mammogram image containing a microcalcification cluster.
Figure 4 (b) is the prediction error image e{i, j].
It
is experimentally observed that in regions with no microcalcifications the Gaussian distribution is a good model for e{i,j]. In regions with microcalcifications, on the other hand, the distribution is non-Gaussian because of the impulsive nature of microcalcifications (see Figure 5). Therefore, a Gaussianity test can be used to detect microcalcificated regions in mammograms.3. ADAPTIVE FILTERING BASED GAUSSIANITY TESTS
We use a Gaussianity test based on the sample estimates of the first three moments I, '2, 13 of the prediction errors as in [13]. Estimates of the moments are given by:
1 MN
'2M x N
: e2[i,j]
(4) i=1 j=1 1MN
T 3r13MxN
eLi,3 i=1j=1where, e[i ,j] 's
(i =
1,. . . , M,j
= 1,. . . , N)are individual error values at the location (i j)andM x N is the total number of error pixels in the square region (M =
N
=
30in our experiments).For Gaussian sequences, I, '2,13 converge to the following values as M, N go to infinity:
I—
(6)(7)
13
— + 321t
(8)where 1a and a2 denote the mean and the variance of the error sequence e, respectively. With
these limit values, we calculate the nonlinear expression
h(11, 12, 13) =13—
3I
(12 —1i2) — I (9)Replacing the moment values in this expression with the limit values in Equations 6-8, we get
h =
(10)=
0 (11)Hence, h is expected to be close to zero for Gaussian distributed sequences. If it is significantly greater than 0 then it is concluded that the sequence under test deviates from Gaussianity.
uz
>
Figure 4: (a) Part of a maninlogram image containing a. niicrocalcification cluster (b) The errol image obtained after the 2-D adaptive filtering
M,crocalc4icalions. h - 40.4343
0 —5
nn
0 5 10 15 20(b)
-
10n Rn
12 14 16 18 20(c)
Figure 5: Error value distributions in regions with (a) no microcalcificatioii and (h) with micro-calcifications (c) shows the an enlarged view of the tail of the dist ribut ion in (h).
No mcrocaIcificabon. h = -0.1163 80 70 60 50- 40-30 150 100 50 C —1 6 4 2 0 2 4 (a)
4. EXPERIMENTAL RESULTS
Figure 5 depicts the prediction error histograms of two 30x30 regions. Figure 5-(a) is
ob-tamed from a region with no microcalcification and Figure 5-(b) is obtained from a region with microcalcifications. In the microcalcificated region the distribution is skewed as shown in
Fig-ure 5-(b). FigFig-ure 5-(c) is the enlarged view of the tail of the distribution, which extends far to
the right mainly due to the presence of microcalcifications. The test statistic, h(11, '213)reflects
this change in the distribution. It is -0.1163 for the region with no microcalcifications and it is 40.4343 for the region containing microcalcifications.
We tested the above method in 100 different 30x30 regions with and without microcalcifi-cations taken from five different mammogram images. The results of the Gaussianity test are
shown in Tables 1 and 2.
The detection method can be stated as a hypothesis testing problem in which the null
hy-pothesis H0 corresponds to the no microcalcification case and H1 corresponds to the presence of
microcalcifications case:
. H0
: h(11,12,13)< ThI H1 : h(11,12,13) Th
whereTh 5an experimentally determined threshold. Based on the above experimental data, Th
can be chosen as the midpoint of (3.37, 8.09) i.e., Th =5.73.
5. CONCLUSIONS AND FUTURE WORK
With increasing use of Picture Archiving and Communication Systems (PACS), Computer-aided Diagnosis (CAD) methods will be more widely utilized. In this paper, we develop a CAD method for the detection of microcalcification clusters in mammograms, which are an early sign of breast cancer. The method we propose makes use of two-dimensional (2-D) adaptive filtering and a Gaussianity test recently developed by Ojeda et al. Experimental results indicate that this method is successful in detecting regions with microcalcifications.
Mean Minimum Maximum
h(11,12,13) 35.24601 8.0893 125.1751
Mean Minimum Maximum
Lh(11,12,13) 0.1619 -3.2643
3.3658 J
Table 2: Statistics of h in regions no microcalcification.
The computatinal complexity of the detection system is not high and it can be significantly
reduced by noting that the moment expressions in Equations 3-5 can be computed in an in-cremental manner. In other words, after calculating these values for the right half of a square
region, they can once again be used for the left half of the next overlapped square region. Another branch of computer-aided diagnosis in mammography deals with mass detection and stellate lesion detection in mammograms [14] . Thesizes of these abnormalities are much bigger than those of microcalcifications but their detection is still difficult since they look very much like the surrounding parenchymal tissue and their contrast is low. As future work, we will extend the 2-D adaptive filtering based methods to the mass and stellate lesion detection problem.
6. REFERENCES
[1] M. Nafi Glircan, Yasemin Yardimci, A. Enis cetin, Rashid Ansari, "Detection of Microcal-cifications in Mammograms Using Higher Order Statistics," IEEE Signal Processing Letters, vol. 4, no. 8, pp 213-216, August 1997.
[2] H. Yoshida, K. Doi, R. M. Nishikawa, M. L. Giger, "An Improved Computer-Assisted Di-agnostic Scheme Using Wavelet Transform for Detecting Clustered Microcalcifications in Digital Mammograms," Academic Radiology, vol. 3, no. 8, pp. 621-627, August 1996. [3] L. P. Clarke, M. Kallergi, W. Qian, H. Li, R. A. Clark, M. L. Silbinger, "Tree-structured
non-linear filter and wavelet transform for microcalcification segmentation in digital mam-mography," Cancer Letters, vol. 77, pp 173-181, 1994
[4] H. Chan, K. Doi, S. Gaihotra, C. J. Vyborny, H. MacMahon and P. Jokich, "Image feature
analysis and computer-aided diagnosis in digital radiography, I. Automated detection of
microcalcifications in mammography," Medical Physics, pp. 538-547, Vol. 14, No. 4, Jul/Aug
1987.
[5] K. S. Woods, C. C. Doss, K. Bowyer, J. L. Solka, C. E. Priebe, W. P. Kegelmeyer JR, "Com-parative Evaluation of Pattern Recognition Techniques for Detection of Microcalcifications in Mammography," International Journal of Pattern Recognition and Artificial Intelligence,
Vol. 7, No. 6, pp. 1417-1436, 1993.
[6] R. N. Strickland, H. Ii Hahn, "Wavelet Transforms for Detecting Microcalcifications in
[7] H. Yoshida, W. Zhang, W. Cai, K. Doi, R. M. Nishikawa and M. L. Giger, "Optimizing
Wavelet Transform Based On Supervised Learning For Detection of Microcalcifications in Digital Mammograms," Proceedings of IEEE International Conference on Image Processing,
pp. 152-155 1995.
[8] H. Yoshida, K. Doi, R. M. Nishikawa, "Automated detection of clustured microcalcifications in digital mammograms using wavelet transform techniques," Proc. SPIE, 2167:868-886,
1994.
[9] J. Dengler, S. Behrens, J. F. Desaga, "Segmentation of Microcalcifications in
Mammo-grams," IEEE Trans. on Medical Imaging, vol. 12, no. 4, pp. 634-642, December 1993. [10] W. Qian, L. P. Clarke, M. Kallergi, R. A. Clark, "Tree-structured nonlinear filters in digital
mammography," IEEE Transactions on Medica 1 Imaging, vol. 13, no. 1, March 1994. [11] R. Ojeda, J. Cardoso, E. Moulines, "Asymptotically Invariant Gaussianity Test For Causal
Invertible Time Series," Proceedings oIIEEE International Conference on Acoustics, Speech, and Signal Processing, vol. 5, pp. 3713-3716, April 21-24, 1997.
[12] P. A. Ffrench, J. R. Zeidler, W. H. Ku, "Enhanced Detectability of Small Objects in Cor-related Clutter Using and Improved 2-D Adaptive Lattice Algorithm," IEEE Transactions
on Image Processing, vol. 6, no. 3, pp. 383-397, March 1997.
[13] E. Moulines, K. Choukri, "Domain Procedures for Testing that a Stationary
Time-Series is Gaussian," IEEE Transactions on Signal Processing, vol. 44, no. 8, pp. 2010-2025, August 1996.
[14] H. Chan, D. Wei, M. A. Helvie, B. Sahiner, D. D. Adler, M. M. Goodsitt, N. Petrick,
"Computer-aided classification of mammographic masses and normal tissue: linear discrim-inant analysis in texture feature space," Phys. Med, Biol., 40, pp. 857-876, 1995.