To my dear grandparents, Nurten & Ali Çeken Fatma & Mustafa Dökmeci
ACOUSTICAL COMFORT EVALUATION IN
ENCLOSED PUBLIC SPACES WITH A CENTRAL
ATRIUM: A CASE STUDY IN FOOD COURT OF
CEPA SHOPPING CENTER, ANKARA
A THESIS
SUBMITTED TO THE DEPARTMENT OF
INTERIOR ARCHITECTURE AND
ENVIRONMENTAL DESIGN AND THE INSTITUTE
OF ECONOMICS AND SOCIAL SCIENCES
OF BĐLKENT UNIVERSITY
IN PARTIAL FULFILLMENT OF THE
REQUIREMENTS
FOR THE DEGREE OF
MASTER OF FINE ARTS
By
Papatya Nur Dökmeci
September, 2009
I certify that I have read this thesis and that in my opinion it is fully adequate,
in scope and in quality, as a thesis for the degree of Master of Fine Arts.
Asst. Prof. Dr. Semiha Yılmazer (Principal Advisor)
I certify that I have read this thesis and that in my opinion it is fully adequate,
in scope and in quality, as a thesis for the degree of Master of Fine Arts.
Prof. Dr. Halime Demirkan
I certify that I have read this thesis and that in my opinion it is fully adequate,
in scope and in quality, as a thesis for the degree of Master of Fine Arts.
Prof. Dr. Mehmet Çalışkan
Approved by the Institute of Fine Arts
Prof. Dr. Bülent Özgüç, Director of the Institute of Fine Arts
ABSTRACT
ACOUSTICAL COMFORT EVALUATION IN ENCLOSED PUBLIC SPACES WITH A CENTRAL ATRIUM: A CASE STUDY IN FOOD COURT OF CEPA SHOPPING CENTER,
ANKARA Papatya Nur Dökmeci
MFA in Interior Architecture and Environmental Design Supervisor : Asst. Prof. Dr. Semiha Yılmazer
July, 2009
Physical comfort requirements of users as thermal, visual, and acoustic comfort should be considered and studied in detail when designing and planning public spaces. The subjective auditory perception needs to be evaluated parallel with the objective acoustical incidences in a space. The food court area of CEPA Shopping Center with an atrium and a glass dome ceiling, in the capital city of Turkey, Ankara is chosen for the case. The aim of this study is to investigate acoustical parameters of the space via computer simulation program and examine the effect of architectural features of the space namely; central atrium, glass dome and the existing material applications. Considering the relationship between the users’ noise annoyance and the equivalent continuous sound pressure level (Leq) is also intended in this study. The research techniques are computer simulations, noise measurements and questionnaires. Acoustical parameters; reverberation time (RT), early decay time (EDT), sound transmission index (STI) and equivalent continuous sound pressure level (Leq) values are obtained by simulations and measurements. Questionnaires are used for understanding the noise annoyance and auditory perception of the users. The results show that the noise annoyance ratings correlate well with the Leq variances. The most dominantly perceived and the most annoying sound found to be correlated with the highest percentage for speech noise in the food court. Decay time (T30, EDT) results of the space that are derived from the ODEON 6.5 software are found to be very long as expected with a central atrium, glass dome ceiling and highly reflected material applications. In addition, the food court area is defined to be poor in terms of STI. High Leq values as well as long decay times that are present in the space are noted as factors increasing the noise annoyance of the users.
KEY WORDS: acoustic comfort, acoustical parameters, noise annoyance, central atrium, public spaces, food court
ÖZET
MERKEZİ GALERİ BOŞLUĞU BULUNAN TOPLU KULLANIM MEKANLARINDA AKUSTİK KONFOR DEĞERLENDİRMESİ: CEPA ALIŞVERİŞ MERKEZİ YEMEK ALANI
ÖRNEĞİNDE Papatya Nur Dökmeci
İç Mimarlık ve Çevre Tasarımı Yüksek Lisans Programı Danışman : Yrd. Doç. Dr. Semiha Yılmazer
Temmuz, 2009
Toplu kullanım mekanlarının planlama ve tasarım sürecinde, kullanıcıların fiziksel konfor gereksinimleri göz önünde bulundurulmalı ve detaylı çalışılmalıdır. İşitsel algının değerlendirilmesi, mekanda oluşan akustik olgular ile paralel olarak ele alınmalıdır. Bu çalışma için, Ankara’da yer alan, cam kubbe tavanlı ve bu tavanın altında tasarlanmış bir galeri boşluğuna sahip CEPA Alışveriş Merkezi seçilmiştir. Bu çalışmanın amacı, mekanın akustik özelliklerini bilgisayarda benzetim yoluyla incelemek ve merkezi galeri boşluğu (atriyum), cam kubbe ve mevcut malzeme uygulamaları gibi mimari ögelerin mekana etkisini araştırmaktır. Çalışmada ayrıca, eşdeğer sürekli gürültü düzeyleri (Leq) ile kullanıcıların gürültü rahatsızlıkları arasındaki ilişkinin irdelenmesi de amaçlanmıştır. Araştırma teknikleri olarak, bilgisayarda benzetim çalışmaları, gürültü ölçümleri, ve anketler kullanılmıştır. Çınlama süresi (RT), erken sönümlenme üresi (EDT), eşdeğer sürekli gürültü düzeyleri (Leq) ve konuşma iletim indisi (STI) benzetim çalışmaları veya ölçümler ile elde edilmiiştir. Anketler, kullanıcıların gürültü rahatsızlığı seviyelerini ve işitsel algılarını ortaya koymak için uygulanmıştır. Sonuçlar, gün içerisinde değişkenlik gösteren Leq değerleri ile kullanıcıların gürültü rahatsızlıklarının birbirleri ile doğrudan ilişki gösterdiğini vurgulamaktadır. Anket çalışmalarından elde edilen sonuçlar, en baskın olarak algılanan ses ve en rahatsız edici sesin doğrudan ilişkili olduğunu ve insan sesi olarak nitelendirildiğini göstermektedir. ODEON 6.5 akustik analiz programından elde edilen sönümlenme süreleri (T30, EDT) ile mekanın uzun çınlama sürelerine ve düşük anlaşılabilirlik değerlerine sahip olduğu görülmüş ve neden olarak, merkezi galeri boşluğu, cam kubbe tavan ve ses yansıtıcı malzemeler verilmiştir. Ek olarak, konuşma iletim indisi (STI) açısından, yemek alanı yetersiz bulunmuştur. Yüksek eşdeğer sürekli gürültü düzeyleri ve uzun çınlama süreleri, CEPA yemek katında bulunan kullanıcıların gürültü rahatsızlıklarının artmasına yol açan faktörler olarak saptanmıştır.
ANAHTAR KELİMELER: akustik konfor, akustik parametreler, gürültü rahatsızlığı, merkezi galeri boşluğu (atriyum), toplu kullanım alanları, yemek alanı
ACKNOWLEDGMENTS
I would like to express the deepest appreciation to my advisor Asst. Prof. Dr. Semiha Yılmazer not only for her invaluable guidance but also for her friendly and sincere support all through my graduate research life. She continually and
convincingly conveyed a spirit of adventure in regard to research and scholarship, and an excitement in regard to teaching that I have admired deeply. Without her guidance and persistent help this thesis would not have been possible.
I am grateful to Prof. Dr. Mehmet Çalışkan who has the attitude and the substance of a genius. I have learned greatly during every minute I have spent with him. His patience and guidance is and will be very important for my academic life.
I would like to thank to Prof. Dr. Halime Demirkan, Assoc. Prof. Dr. Feyzan Erkip and Prof. Dr. Mustafa Pultar for their significant suggestions and teachings all through my graduate study.
Special thanks to Asst. Prof. Dr. Kenan Köse, for his crucial and highly detailed statistical help. Without him, this thesis would not be accomplished.
Sincere thanks to İnci Cantimur and Murat Akgün for their essential friendship, and support and to Segah Sak and Zühre Sü for their valuable suggestions.
I would like to express my love and gratitude to my dear mother and father; for their trust and encouragement throughout my life. My mother is my role model in every way affecting me greatly by being such an amazing academician and life teacher. In addition, special thanks to all my family for their love and
understanding.
Finally, I am very pleased for the cooperative work of CEPA Management Team and to all of my respondents who answered my survey.
TABLE OF CONTENTS
SIGNATURE PAGE ... ii ABSTRACT ... iii ÖZET ... iv ACKNOWLEDGMENTS ... v TABLE OF CONTENTS ... vi LIST OF TABLES ... ix LIST OF FIGURES ... x 1. INTRODUCTION 1 1.1. General ... 11.2. Aim and Scope... ... 4
1.3. Structure of the Thesis... ... 5
2. ACOUSTICAL REQUIREMENTS IN ENCLOSED PUBLIC SPACES 8 2.1 Objective Criteria ... 8
2.1.1. Reverberation Time (RT) ... 8
2.1.2. Early Decay Time (EDT) ... 11
2.1.3. Speech Transmission Index (STI) ... 12
2.1.4. Sound Pressure Level (SPL) and Equivalent Continuous Sound Pressure Level (Leq) ... 13
2.2. Subjective Criteria 14 2.2.1. Pitch ... 14
2.2.2. Loudness and Loudness Level ... 16
2.2.3. Noisiness and Annoyance ... 18
2.3. Architectural Characteristics and Requirements of the Enclosed ‘non acoustic’ Spaces ... 19
2.3.1. Acoustical Requirements of Enclosed ‘non-acoustic space’ .... 20
2.3.2. Diffuse Field Requirements ... 21
2.3.3. Effects of Volume, Shape and Size ... 21
2.3.4. Acoustical Characteristics of Atrium Void ... 22
2.3.5. Acoustical Characteristics of Domes ... 24
2.3.6. Materials and Applications ... 25
3. DESIGN OF THE STUDY 29 3.1. Research Questions ... 29 3.2. Objectives ... 30 3.3. Hypotheses ... 30 3.4. Methodology ... 31 3.4.1. Computer Simulations ... 31 3.4.2. Noise Measurements ... 34 3.4.3. Questionnaires ... 34
3.5. Case: Food Court of CEPA Shopping Center ... 35
3.5.1. Architecture, Shape and Size ... 35
3.5.2. Materials and Applications ... 38
4. OBJECTIVE AND SUBJECTIVE EVALUATION ON FOOD COURT OF CEPA SHOPPING CENTER 40 4.1. Computer Simulation Results ... 40
4.1.1. Reverberation Time (RT) ... 43
4.1.2. Early Decay Time (EDT) ... 48
4.1.3. Speech Transmission Index (STI) ... 51
4.1.4. Sound Pressure Level (SPL) and A-weighted Sound Pressure Level (SPL-A) ... 52
4.2. Noise Measurements ... 53
4.2.1. Results of Equivalent Continuous Sound Pressure Level (Leq) Measurements ... 54
4.2.2. Sound Pressure Level (SPL-A) Variances for Different Frequencies ... 58
4.3. Questionnaire Results ... 60
4.3.1. Demographics and Space Utilization Characteristics ... 60
4.3.2. Noise Annoyance Ratings and Auditory Perception ... 62
4.3.3. Response to Different Sound Sources ... 63
4.3.4. Noise Annoyance Rating Variations on Weekdays- Weekends ... 64
4.3.5. Time Spent Preferences and Noise Annoyance Ratings in the Food Court ... 65
5. DISCUSSION 67 5.1. Analyzing the Acoustical Characteristics of the Food Court in CEPA ... 67
5.2. Relationships between Leq Measurements and Noise Annoyance Ratings of the Food Court Users ... 72
6. CONCLUSION 77
REFERENCES 79
APPENDICES 84
Appendix A1: AutoCAD Drawings ... 85
Appendix B1: Distributions Maps of Computer Simulation ... 88
Appendix C1: Questionnaires and Correlations ... 95
Appendix C2: Auditory Perception and Noise Annoyance Survey ... 102
LIST OF TABLES
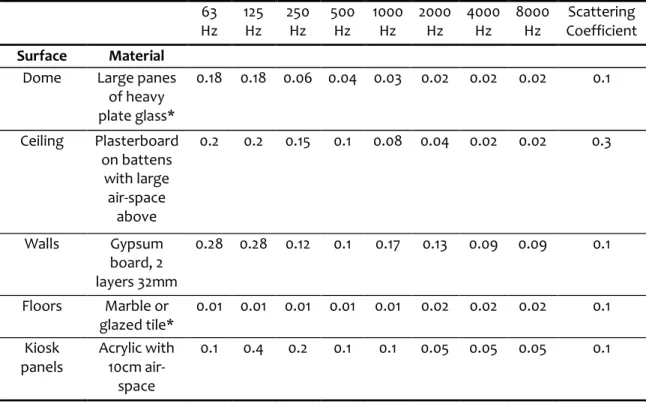
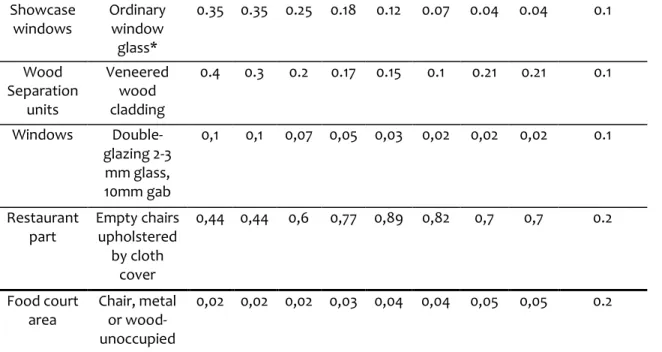
Table 2.1. Quality scores in relation with STI (or RASTI) values ... 13 Table 2.2. Change in subjective loudness due to the change in sound level ... 17 Table 4.1. Material list and sound absorption coefficients used for the model...43 Table 4.2. Simulated EDT and RT values for 63-8000 frequency range ... 51 Table 4.3. Simulated SPL values for 63-8000 frequency range ... 53 Table 4.4. Measured Leq values at different times during weekdays (WD) and weekends (WE) ... 56 Table 4.5. Differing SPL-A values measured on specified locations
on weekends ... 60 Table 4.6. Differing SPL-A values measured on specified locations
on weekdays ... 61 Table 4.7. Age distribution of the sample group ... 62 Table 4.8. User’s noise annoyance ratings for weekdays and weekends ... 66 Table 5.1. Leq values compared with different volumes of three varied atriums.69
LIST OF FIGURES
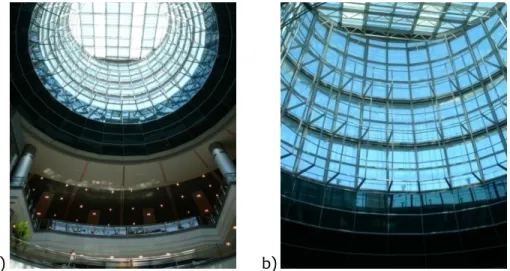
Figure 2.1. Fletcher and Munson curves of loudness level contours ... 18 Figure 3.1. Axonometric view of CEPA Shopping Center showing source and receiver positions from the computer simulation ... 33 Figure 3.2. 3D view of the model from the receiver ... 34 Figure 3.3. Bruel & Kjaer Type 2230 Sound Level Meter ... 35 Figure 3.4. The site plan of CEPA Shopping Center and Bauhaus Store .... 37 Figure 3.5. Partial plan of CEPA Shopping Center, 3rd Floor ... 37 Figure 3.6. The cross-section of CEPA Shopping Center ... 38 Figure 3.7. The longitudinal section of CEPA Shopping Center ... 38 Figure 3.8. Glass dome ceiling located at the center of the atrium void and the details of the dome structure ... 39 Figure 3.9. The overall food court area with the atrium void and
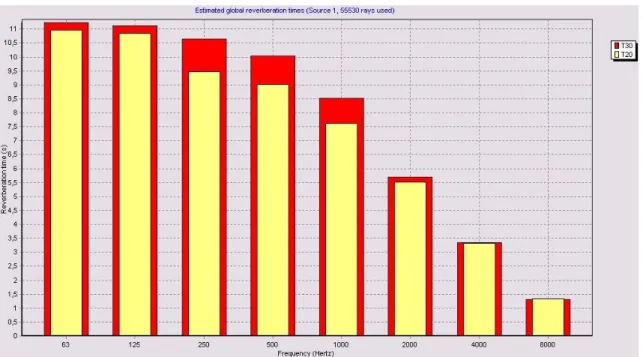
glass dome ceiling... 40 Figure 4.1. Plan of CEPA Shopping Center showing source and receiver positions from the computer simulation ... 41 Figure 4.2. Longitudinal section of CEPA Shopping Center showing source and receiver positions from the computer simulation ... 42 Figure 4.3. Cross-section of CEPA Shopping Center showing source and receiver positions from the computer simulation ... 42 Figure 4.4. 3D view of the model as seen from the source ... 43 Figure 4.5. Bar chart showing the total absorption area of current materials assigned for the computer simulation ...44 Figure 4.6. Estimated global reverberation times of Sabine, Eyring and Arau- Punchades derived by material properties ... 45 Figure 4.7. Bar chart showing the estimated global reverberation times of T30 and T20 ... 46
Figure 4.8. Free path distribution map ... 46
Figure 4.9. Cumulative distribution function graph of T30 at 1000 Hz ... 47
Figure 4.10. T30 distribution map for 1000 Hz ... 48
Figure 4.11. Cumulative distribution function graph of EDT at 1000 Hz .... 49
Figure 4.12. EDT distribution map for 1000 Hz ... 50
Figure 4.13. Graph showing RT and EDT results of simulation for 63-8000 frequency range ... 51
Figure 4.14. STI distribution map ... 52
Figure 4.15. SPL distribution map for 1000 Hz ... 53
Figure 4.16. SPL (A) distribution map ... 54
Figure 4.17. Food court plan showing the Leq measurement points ... 55
Figure 4.18. Mean Leq values for weekends and weekdays of different hours ... 57
Figure 4.19. Measured Leq values for weekends (WE) and weekdays (WD) of different hours and locations ... 58
Figure 4.20. Averaged SPL-A level changes for different frequencies between 63-8000 HZ ... 59
Figure 4.21. Distribution on the education level ... 62
Figure 4.22. Noise annoyance ratings in CEPA and in food court ... 64
Figure 4.23. Distribution of users according to the time spent in food court ... 67
Figure 5.1. Rating percentages for annoyance from other people in food court related with mean Leq values of weekdays and weekends ... 76
Figure 5.2. Linear regression graph for annoyance of food court users from the overall noise in CEPA and the measured Leq values ... 77
Figure 5.3. Rating percentages for annoyance from other people in food court related with different day types and times of the day .. 78
1
1. INTRODUCTION
1.1. GeneralDesigning public spaces is an important field that should be considered and studied in detail. There are some basic requirements regarding the physical comfort of the users that should be included in planning a public space. These requirements can be
exemplified as, thermal, visual, and acoustic comfort in an enclosed, semi-enclosed or open space.
The field of acoustical design and the understanding of auditory perception have begun to be considered by architects and designers with the innovations in the acoustical materials and by the development of certain computer modeling and analyzer software. The will for creating better living environments could be fulfilled by such computer software. These environments (mainly enclosed spaces as the focus of this study) are used by the individuals of the society who are generally unaware of the environment (open or enclosed) that they spent time while they use it on regular basis. A great deal of work should be accomplished by the architects and acoustical designers in renovating the existent buildings and providing acoustical consultancy for those planning to be
constructed in the near future.
There are many studies focusing on enclosed ‘acoustic’ spaces that deal with either music or opera. Such spaces are exemplified as concert halls or opera houses. The acoustical formations and parametric researches are carried out on designing better performance spaces for the performers as well as better acoustical environments for the spectators. In these certain spaces, subjective attributes such as, intimacy, liveness, warmth, loudness
2
of direct sound and reverberant sound, balance and blend, diffusion and ensemble are very crucial (Long, 2006). These attributes play important role for the subjective acoustical evaluation of a space and should be considered and well designed.
Auditoriums, meeting rooms and lecture halls are also studied in detail in the literature. In such spaces, adequate loudness, uniform sound distribution, appropriate reverberation, high signal-to-noise ratios and low levels of background noise are crucial objective criteria for designing such spaces (Long, 2006). The subjective assessment is based primarily on the speech intelligibility as well as clarity and definition and can be tested by objective parameters such as articulation index or speech transmission index and real-size measurements (Long, 2006).
Studies in the literature are concentrated mainly on acoustic spaces such as auditoriums or concert halls yet, other ‘non-acoustics’ enclosed public spaces such as shopping centers or other leisure venues (restaurant, cafes and bars) need more attention (Kang, 2003, Chen, and Kang, 2004). Low sound pressure levels, appropriate reverberation and low ambient noise levels are crucial for better subjective evaluation of these spaces. Loudness, annoyance, privacy and clarity are the subjective criteria that should be studied in these enclosed public spaces. Speech interference and intelligibility is one important topic that is studied in detail at the food court area of shopping malls or dining spaces that gained speed in recent years (Kang, 2002, Navarro, Pimentel, 2007). Especially, studies on the objective and subjective relations in such spaces should be carried on to present better evaluation on noise annoyance or intelligibility, yet such studies are lacking in the literature (Kang, 2004).
3
The architectural elements in an enclosure have significant effects on distinctive acoustical formation. In this point, the architects and designers should not forget that architecture is not only visual yet there are many other criteria for a space to be well appreciated and comfortable. The examples for such architectural elements are atriums and domes used commonly in many public spaces. Both of these architectural elements lead to malign acoustical formations, so should be carefully used by appropriate
preventions. Articles regarding atriums and their acoustical characteristics gained speed in recent years (Bradley, 1998). Comparative studies of Bradley, Chen and Mahdavi are the examples that concentrate on atriums of different types in buildings having varied functions.
Studies on enclosed spaces with domes (Inoe, Sugino, Katou, and Imaizumi, 2009) or concave surfaces have been carried out especially regarding religious places such as domes in mosques or barrel-vaulted ceilings in churches and curved rear walls in
auditoriums (Sü, and Yılmazer, 2006). These elements used as an important architectural feature in an enclosure results in focus of reflected sound and echo (Egan, 1988). So, there is a need to carefully examine how such architectural elements would affect the overall space regarding physical comfort requirements.
Developing measurement tools that are designed for the real-size acoustical
measurements and room acoustics analyzer software such as ODEON or CATT-Acoustics provide a great deal of opportunities for the architects and acoustical designers during the design or renovation period of a building (Rindel, 2000). Different acoustical
4
parameters and room responses of an enclosure are determined either by measurements or simulations prior to the construction or renovation stage. In addition, subjective evaluation and auditory perception classifications of users should not be left out when a renovation assignment is carried out. Architectural solutions as acoustical material applications and interior interventions that are based solely on the objective parametric results of a space do not provide all the necessary acoustical information regarding that space. Yet, the user’s auditory perception and comfort ratings are clues that lead to crucial renovation strategies in creating better acoustical environments that are working parallel with its designated function.
The previous studies mainly concentrated on the objective characteristics and acoustical formations in open, semi-open or enclosed spaces. Data related to the auditory
perception and noise annoyance in such spaces is lacking in the literature (Kang, 2004). On the other hand, studies that focus on the relations and correlations between objective acoustical parameters and noise annoyance are rather less yet gained speed during recent years (Yang, and Kang, 2005, Zannin, Calixto, Diniz, and Ferreira, 2003). In addition, many studies can be seen in the literature regarding the objective acoustical parameters of open/urban public spaces (Yang, and Kang, 2005, Payne, and Devine-Wright, 2007) as the new terminology ‘soundscape approach and design’ came into use with its main focus on larger scales mostly being urban parks and open city environments.
1.2. Aim and Scope
As the basic consideration, this study is designed to understand the relationship of the acoustical conditions and the auditory perception of the users with respect to the
5
architectural and spatial properties of the food court area in CEPA Shopping Center. The aim of this study is to analyze the acoustical characteristics of the space with a central atrium and a glass dome ceiling. In addition, measured equivalent continuous sound pressure level (Leq) and the users’ noise annoyance ratings are considered to put forth the relationship between them.
One other concern is to define the acoustical properties of the space and then investigate upon the effects of such acoustical formations on the auditory perception and noise annoyance of the users. The demographical differences (gender, age, and education), users’ space utilization and auditory perception variances are discussed with respect to the users’ noise annoyance ratings.
1.3. Structure of the Thesis
The thesis is structured under six main parts including the introduction part that is consisted of a general introduction with information regarding previous studies on objective and subjective assessment, aim and scope and structure of the thesis.
‘Acoustical Requirements in Enclosed Public Spaces’, is the second chapter that includes the basic criteria and definitions used in the thesis. This part is divided into three sections as, the objective criteria, the subjective criteria and the architectural characteristics and requirements of the enclosed ‘non-acoustic’ spaces, characteristics and requirements. In the objective criteria section, definitions of the objective parameters used in the field of acoustics are given. These acoustical parameters are, reverberation time (RT), early decay time (EDT), speech transmission index (STI), sound pressure level (SPL), and equivalent
6
continuous sound pressure level (leq)that are relevant to the main topic of the thesis and discussed all through the study. In the subjective criteria section, definitions of the
subjective parameters, pitch, loudness and loudness level, and noisiness and annoyance are given. In the third section, architectural characteristics and requirements of the enclosed ‘non-acoustic’ spaces, Acoustical Requirements of Enclosed ‘non-acoustic space’, diffuse field requirements, effects of volume, shape and size, acoustical characteristics of atrium void, acoustical characteristics of domes, materials and applications have been stated.
The third chapter is titled as, ‘Design of the Study’, that consists of hypothesis, research questions, objectives, methodology and the case: food court of CEPA Shopping Center. In the methodology part, the objective and subjective assessment tools that are used in this study are explained in detail. In the case part, architectural features and material
characteristics of CEPA Shopping Center is described. The third chapter mainly provides prior knowledge about the methods used for the study and case site providing a link between chapters two; acoustical requirements in enclosed public spaces and chapter four; objective and subjective evaluation on food court of CEPA shopping center.
In the fourth chapter entitled ‘objective and subjective evaluation on food court of CEPA shopping center’ the results of the computer simulations, noise measurement,
questionnaires and their relation with each other are discussed. This chapter is composed of four sections. Under computer simulations; reverberation time (RT), early decay time (EDT), speech transmission index (STI), and sound pressure level (SPL and SPL-A) results are given and discussed. The real-size measurements section consists of the results
7
regarding equivalent continuous sound pressure level (Leq). The questionnaire results are discussed under the following headings; demographics and users’ space utilization
characteristics, noise annoyance ratings and auditory perception, response to different sound sources, and noise annoyance rating variations on weekdays and weekends and time spent preferences and noise annoyance ratings in the food court.
‘Discussion’ is the fifth chapter, which is followed by the ‘Conclusion’ that is made on the sixth chapter of the thesis. Discussion chapter is divided into three sections and involves discussions on the results of all three different methods and the relations among them are explained. The statistical analysis, correlations and comparisons on objective and subjective outcomes are included in this section. The conclusion part points out the most significant and relevant results derived from the outcomes. The references and
8
2. ACOUSTICAL REQUIREMENTS IN ENCLOSED PUBLIC SPACES
There are important acoustical requirements that should be considered for enclosed spaces. These requirements and preferred acoustical characteristics of a space vary accordingly with the usage function. The acoustical requirements can be examined under three sections as; the objective criteria, the subjective criteria and the architectural characteristics. The combination of all these three criteria and their detailed analysis put forth the acoustical characteristics of the space.
2.1. Objective Criteria
The objective acoustical criteria of an enclosed space present the acoustical parameters and formations within that space. These criteria are measurable and tangible information obtained by varied assessment tools. The shopping centers are enclosed non-acoustic public spaces, where acoustical parameters as, reverberation time, early decay time, sound pressure level, and speech transmission index are more important and
determinative upon the characteristics of the space. Especially, Leq is used for the noise measurements for such public enclosed spaces (Long, 2006).
2.1.1. Reverberation Time (RT)
‘Reverberation’ is the remaining sound that can be heard for sometime after the termination of the source (Maekawa, and Lord, 1994). In auditory perception,
propagation and decay of each sound is very important (Lawrence, 1989). In order to describe reverberation in a numerical format the terminology, ‘reverberation time’ is used. Reverberation time is the fundamental concept for evaluating the sound field in an enclosed space and it is defined as at a given frequency or frequency band “the time
9
taken for a sound to decay by 60 decibels (dB) after the source is stopped” (Lawrence, 1989, p. 91).
There are three main formulas trying to put forth the calculation of reverberation time (RT), namely are, Sabine’s, Eyring’s and Millington-Sette’s formulas. In Sabine’s formula, information on the size of the room (mainly the volume) and the total room absorption in sabins is required to calculate the time required to decay 60 decibels (dB) after the source is stopped (Egan, 1988). It is generally used by testing laboratories and for calculating RT in architectural spaces having diffuse sound field conditions and spaces that do not vary widely in dimensions (Egan, 1988).
1) Sabine’s Formula: T60 = 0,161 V / A where,
T60 = reverberation time, or the time it takes for sound to decrease by 60 dB in a room (s)
V = volume of the room (m3)
A = total area of absorption in the room (sabins)
Eyring’s and Millington-Sette’s formulas are more applicable to rooms with very high absorption ratios as recording studios or anechoic chambers.
2) Millington-Sette’s Formula:
10 where,
T60 = reverberation time, or the time it takes for sound to decrease by 60 dB in a room (sec)
V = volume of the room (m3) ST = total surface area (m2)
While Sabine considered the sound to decay continuously until it disappears, Eyring introduces the new concept of disappearance of the reflected sounds. The idea in his formula is when the sound source is stopped; all the other reflected sounds disappear simultaneously, creating a situation of a perfect absorption (α « 1). This is the reason of its applicability of Eyring’s formula in high absorbent rooms (Maekawa, and Lord, 1994). Eyring-Knudsen formula includes the air absorption where “the energy attenuation constant due to air absorption m is related to temperature and humidity (Maekawa and Lord, 1994, p. 80). The three mentioned formulas are as follows (Long, 2006);
3) Eyring’s Formula:
T60 = 0,161 V / -ST ln (1 - ) where,
T60 = reverberation time, or the time it takes for sound to decrease by 60 dB in a room (sec)
V = volume of the room (m3) ST = total surface area (m2)
11
A = total absorption in square metres (m2) S = total surface area (m2)
In order to correctly use the above formulas, the room or spaces should not widely vary according to their size, shape and especially in absorption/reflection ratios. In highly reflective rooms with no absorptive material treatments, a reverberant sound field occurs by the repeatedly reflected sound waves from the boundaries (Harris, 1994). Similarly, “when floor and ceiling are highly absorptive but walls reflective, the reflected sounds in the vertical direction decay rapidly while the reflected sounds in the horizontal direction remain repeating reflections with slow decay, thus the decay curve bends”( Maekawa, Lord, 1994, p. 81). This kind of a room is not considered as a diffuse field and the reverberation time for 60 dB decay cannot be calculated by any formulas.
2.1.2. Early Decay Time (EDT)
Early decay time (EDT) is “the initial sound decay in the first 10 to 20 milliseconds (ms) of drop after the initial burst” that can be caused by an impulse source such as gunshot, bursting balloon or electronically induced pulse (Long, 2006, p. 312). EDT is also defined as the reverberation time, measured over the first 10 dB of the decay. EDT gives a more subjective evaluation of the reverberation time as it well relates with speech transmission index (STI). EDT can be computed for every octave band or frequency range and same as other RT values expressed in milliseconds (ms).
12
Cocktail party effect and signal-to-noise ratio are other two very important subjects that are directly linked with decay time and intelligibility (Kang, 2002). In public enclosures, where speech noise is generated by the occupants of the space, intelligibility becomes one important aspect. Kang (2002) explains a significant feature of dining spaces as; “for a given listener, the sound from the talker(s) in his/her conversation group (e.g. a dining table) is regarded as signal, and the sound from the other talkers is regarded as ambient noise. It has been stated that “speech can be understood at a direct field level of 50.3 dB and assuming the background noise due to other sources is low, the two people can converse comfortably at separation distance of 3.9 meters” (Long, 2006, p. 604). Yet, when the noise level increases in the space, eventually people tend to get closer or rise their voices for better intelligibility, resulting noise levels getting increased by additional occupants (Long, 2006). In such an environments decay times as well as sound pressure levels are crucial and should be controlled by specific acoustical interventions. Sound absorption mechanisms and materials are key elements for such treatments. When the absorption coefficient is higher in the enclosure the signal-to-noise ratio gets lower leading to better intelligibility (Long, 2006).
2.1.3. Speech Transmission Index (STI)
Speech transmission index is a machine measure of intelligibility of speech and directly depends on the background noise level, the reverberation time, and the size of the room. The analysis of speech is simulated during 20th century by scientists to better understand the characteristic (Lawrence, 1989). It is known that “the intelligibility inside any
enclosure depends on signal to noise ratio (SNR), the signal level and reverberant field” and be best described by three different criteria, speech transmission index (STI), rapid
13
speech transmission index (RASTI) and percentage loss of consonants (%AlCons) (Hammad, 2000, pg. 185). RASTI (room acoustics speech transmission index or rapid speech transmission index) can be described as the simplified version of STI for specified use. Similar with articulation index (AI) and %AlCons, STI is the direct measure of speech intelligibility (SI) and are all numerical schemes (Long, 2006).
Table 2.1. Quality scores in relation with STI (or RASTI) values (Long, 2006, p. 152).
Quality Score STI (or RASTI) Value
Bad 0-0.32
Poor 0.32-0.45
Fair 0.45-0.60
Good 0.60-0.75
Excellent 0.75-1.0
The range of STI is between 0 = completely unintelligible – 1 = perfect intelligibility, so a value of 0.5 is required for most enclosed spaces and also expressed in Table 2.1.
2.1.4. Sound Pressure Level (SPL) and Equivalent Continuous Sound Pressure Level (Leq) Before discussing sound pressure level (SPL), concepts of sound pressure and sound energy should be well understood. As “pressure is a force per unit area”, the progress of sound energy occurs rapidly, producing very small changes n the atmosphere that makes it possible for human ear to hear the sound incidences (Egan, 1988, p. 2). SPL is the most commonly used indicator for the acoustic wave strength and is nearly the same concept with sound intensity. SPL well correlates with the human perception of loudness and gives important clues regarding the noise annoyance ratings (Long, 2006). According to the explanations given by Maekawa and Lord (1994), “sound intensity is proportional to
14
the square of the sound pressure and the particle velocity” (pg. 7) and in order to
measure sound intensity or sound pressure the logarithmic scale with unit decibel (dB) is used.
Equivalent continuous sound pressure level (Leq) is used as an index for noise. It is given in terms of dBA, the A-weighted sound that fluctuates over a period of time. In addition, it has been noted in the literature that Leq correlates well with human reaction (Long, 2006). That is the main reason that Leq is chosen for the main deterministic objective acoustical parameter for the noise measurements.
2.2. Subjective Criteria
The subjective criteria within an enclosed public space consists the abstract and perceptual characteristics of sound. Such measures can be achieved by detecting and analyzing the human response to some basic components of sound. Human hearing and auditory perception play crucial role for the concept of subjective criteria in an enclosed space. Subjective assessment tools are the key elements used to assess information on this concept.
2.2.1. Pitch
Egan states the definition of pitch as “the subjective response of human hearing to frequency” (1988, p. 4) and notes that low frequencies are classified as boomy and high frequencies as screechy. Similar to electronic filters, the cochlear filters in the ear act as parallel band-pass filters that separate the incoming sounds into their spectral
15
components and the perception of different frequencies occur as the result of such filtering (Long, 2006).
For acoustical measurements, analysis and specifications, the frequency range is divided into sections called bands. The most common standard division is “10 octave bands identified by their center frequencies: 31.5 – 63 – 125 – 250 – 500 – 1000 – 2000 – 4000 – 8000 – 16000 hertz (Hz)” (Egan, 1998, p. 4). A healthy young person has the hearing range of 20 - 20,000 Hz (hearing range of an old person gets lowered as 20-2000 or 4000 Hz) and the speaking range of 125 – 8000 Hz (Egan, 1988). Another important concept is the speech octave band that is critical for human hearing, which are; 500-1000-2000-4000 Hz respectively (Long, 2006). So, the sound pressure level peaks are rather crucial at these certain frequency ranges for intelligibility of speech.
Although, pitch is defined as the perceived frequency, it is rather complicated as the intensity and waveform may also be effective in the perception. In addition, a sound with a constant pitch is called tone and in order for human ear the sense the pitch, the
duration should not be too short (Maekawa, and Lord, 1994) and too weak. This
phenomenon can be explained by the example, “if a 100 Hz tone is sounded at 60 dB and then at 80dB, the louder sound will be perceived as having a lower pitch” especially for frequencies below 300 Hz, however for mid frequencies ranging from 500 Hz to 3000 Hz, pitch gets independent from the intensity and begins to increase with the level for the frequencies above 4000 Hz (Long, 2006, p. 81). The psychoacoustic experiments try to experiment on the perception of pitch for that sense. In addition, it should be noted that, “the pitch of a complex sound is perceived as that of the frequency which is the highest
16
common factor of the frequencies of all the component sounds” (Maekawa, and Lord, 1994, p. 22).
2.2.2. Loudness and Loudness Level
Lord (2006) defined loudness as the “human perception of the magnitude of a sound” and although this definition would mean that the determination of loudness is possible by the measured intensity of a sound, such a relation does not exist (p. 81). Physiologically, loudness depends on the nerve impulses that reach to brain in a certain time coming from the different parts of the cochlea resulting variations with the frequency content of the sound (Long, 2006). It should also be noted that even the same sound is heard at different intensities, the evaluation of a listener or listeners would vary as the sensitivity sound is highly affected by “frequency content, time of occurrence, duration of sound and psychological factors as emotion and expectations” (Egan, 1988, p. 21).
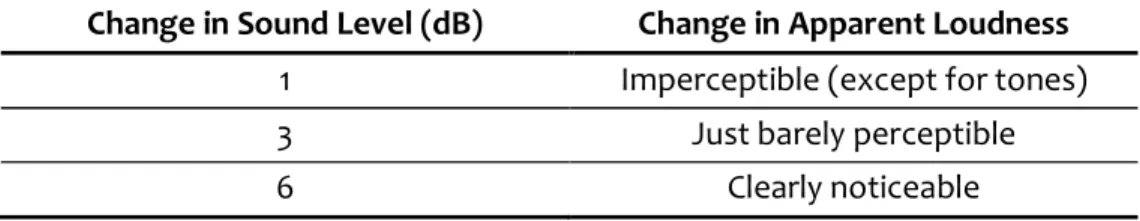
The apparent loudness for the subjective judgment, the changes in the sound level are given in Table 2.2. As it can be noted, a normal hearing person can barely notice the sound level change for 3 decibels. It is also said that an educated ear has the ability to detect a 2 decibels change, yet 1 decibel change is imperceptible for human ear (Egan, 1988).
Table 2.2. Change in subjective loudness due to the change in sound level (Egan, 1988, p. 21).
Change in Sound Level (dB) Change in Apparent Loudness
1 Imperceptible (except for tones)
3 Just barely perceptible
17
10 About twice (or half) as loud
20 About 4 times (or one-forth) as loud
In addition, as subjective sensation is not proportional with objective intensity of
loudness, a standardized measurement term is found, entitled loudness level measured in ‘phons’ (Maekawa, and Lord, 1994). During 1920’s and 1930’s a series of measurements had been done at Bell Laboratories and in 1933 Fletcher and Munson published a study stating the relation of the loudness of a tone by frequency and subjective evaluation of the listeners (Long, 2006). The results had lead to the formation of the Fletcher-Munson curves (see Figure 2.1.) presenting a group of loudness level contours. In the presented graph, loudness level is equalized with the sound pressure level (intensity) at 1000 Hz, which was also the fixed reference tone in the experiments (Long, 2006). Some crucial outcomes can be noted as, maximum sensitivity is between 3000 and 5000 Hz and decreases at higher levels (Maekawa and Lord, 1994).
One other outcome of the Fletcher’s experiment is the established relationship between loudness level measured in phons and subjective loudness expressed in ‘sones’. In other words, the unit of relative loudness of 1 sone is equal to the loudness level of 40 phons at 1000 Hz and when the sound is heard twice as loud as 1 sone, the relative loudness
becomes equal to 2 sones (Maekawa, and Lord, 1994). As a result, the loudness (in sones) versus loudness level (in phons) presents a linear graph (Long, 2006).
18
Figure 2.1. Fletcher and Munson curves of loudness level contours (Long, 2006, p.83).
2.2.3. Noisiness and Annoyance
Similar with the judgment of loudness in sones, a subjective rating scale is developed to measure noisiness in terms of ‘noys’. In the study of Kryter (1970), it was asked to compare third-octave bands of noise at differing levels for the subjective judgment of relative or absolute noisiness and the results were differing from the loudness evaluation (Long, 2006). When the noisiness ratings in noys were converted into a decibel like scale, the terminology changed to perceived noise level (PNL) presented in the units of PNdB and the graph shows a linear formation with the noisiness doubling every 10 dB. It should be noted that PNL is mostly used in the evaluation o aircraft noise (Long, 2006).
Noisiness is affected by factors different than in loudness. These factors are mainly, the spectrum complexity (concentration of energy in pure tone or narrow frequency bands),
19
total duration, the duration of the increase in level prior to the maximum level for non-impulsive sounds, and the increase in level in a 0.5 second interval for non-impulsive sounds (Long, 2006).
While the noisiness or loudness evaluation of individuals does not show great variance, annoyance is subjected to a highly personal judgment. Similarly, much of the studies are carried out in aircraft noise noting the response of people exposed to differing levels of noise (Long, 2006). There is not a defined measurement unit for annoyance; rather it gives information on the subjective evaluation of different types of sound and levels of noise in terms of descriptions and semantics.
The concept of human reaction to changes in sound pressure level has been determined by previous studies and experiments. The reactions to level changes can be described as; 1dB change to imperceptible (except for tones), 3 dB change to barely perceptible, 6 dB change to clearly noticeable, 10 dB change to doubling and 20 dB change to four times as loud (Egan, 1988).
2.3. Architectural Characteristics and Requirements of the Enclosed ‘non-acoustic’ Spaces
Architectural characteristics of a space are one important criterion that is effective on its acoustical properties. The acoustical formations within an enclosed space are directly related with the space properties and architectural elements that form the overall body of an enclosure. For this study, effects of volume, shape, and size of an enclosure as well
20
as specific architectural elements such as atrium void and glass dome ceiling are discussed from the perspective of interior acoustical characteristics of an enclosure.
2.3.1. Acoustical Requirements of Enclosed ‘non-acoustic space’
The acoustical requirements of varied spaces are assessed under two different topics regarding the function of the space as; ‘acoustic space’ and ‘non-acoustic space’ (Kang, 2003). Auditoriums, concert halls, theaters, opera houses, religious buildings (churches, cathedrals, mosques) and recording studios are examples of acoustic spaces as the main function in such spaces are related with music or perception of special acoustical indices that requires serious acoustical designs and treatments. On the other hand, the main function in residential, commercial, educational, health, public and industrial building is not related with acoustics, rather noise prevention and assessing acoustical comfort are the key requirements for these non-acoustic spaces.
As expected, the most studied spaces regarding acoustical requirements, treatments, varied parameters and auditory perception are the acoustic spaces. Studies on office buildings, lecture rooms and conference facilities gained speed in recent years by the need for better acoustical environments and with the developments of new
implementations, techniques and materials regarding acoustics. On the other hand, public spaces such as retail outlets or shopping centers are some of the least studied spaces in the literature. The main reason is that they are commercial buildings and people have the opportunity to choose among many possibilities setting forth the best
21
users should be considered during the design process of the building and necessary material selections and applications should be introduced.
2.3.2. Diffuse Field Requirements
An enclosed space with a diffuse sound field is where many reflections and less amount of absorption occur. For an enclosed space to be considered as a diffuse field, sound energy should show a homogenous decay in the enclosure or room and a uniform sound propagation in all directions should be obtained (Maekawa, and Lord, 1994). Such homogenous and uniform distribution of sound energy could be possible by repeated reflections and diffractions of sound waves within the space. It is also defined by Long (2006) as “a diffuse field is one which there is an equal energy density at all points in the room” meaning that the time average of the mean-square sound pressure is the same and the flow of acoustic energy in all directions is equally probable (p. 298). For interior and enclosed spaces that are treated with marble, concrete or glass the reflection and diffraction of sound waves are more probable yet it might not be result in a diffuse sound field. The reflected part of the sound field in such spaces are called the reverberation field or reverberant field and mainly measured by decay times such as early decay times (EDT) or reverberation time (T30).
2.3.3. Effects of Volume, Shape and Size
Volume, shape and size of a room or a space have crucial importance for the acoustical formations within that space (Meissner, 2007). Therefore, how the acoustical
characteristics vary accordingly with the changes in such architectural features should be assessed prior to the design and construction process for any kind of a building (Pavlovic -
22
Sumarac-, and Mijic, 2007). Especially for ‘acoustic’ spaces, the analysis of volume, shape and size have greater importance as there would be a need for special acoustical
treatments for the interior volume.
Architectural features, surrounding walls, ceiling, and floor, are important for the analysis of the acoustical properties in a space. For example, the shape of a wall or ceiling to be concave or convex affects the sound reflection characteristics. In such cases, the concave surfaces tend to concentrate or focus the reflected sounds, and the convex surfaces lead to diffused reflection (Maekawa, and Lord, 1994).
Acoustics spaces such as concert halls, opera houses and auditoria are studied in great detail in the literature regarding plan forms, shape and volume. For example,
Hetherington and Oldham (2007) analyze the geometric forms of auditoria and state that the majority are composed of basic plan forms and cross sections. They try to describe the efficiency of “different room forms for different acoustical functions with the aim of developing improved rules for the design of acoustical form and generate a large number of three dimensional models in which the geometries could be varied in a systematic manner” (p. 312).
2.3.4. Acoustical Characteristics of Atrium Void
The design of atriums with a covered court, arcade, galleria and winter garden came into use in the western world during the 19th century. Afterwards, the definition and the architectural formation of atriums changed in late 20th century with longer spans, better enclosures without glass ceiling that sits beneath towers (Hung, and Chow, 2001).
23
Atriums are architectural features that are widely used in mainly different kinds of
buildings. Especially, public and office buildings are designed with varied forms of atriums to obtain better aesthetics as well as visual connection of the overall space.
In cold regions, buildings with atriums and glass skylights that sit over the atrium void provides pleasant, naturally lit and environmentally controlled spaces in all seasons of the year (Bradley, 1998). Based on their findings, Chen and Kang (2004) noted that, “the acoustic characteristics in atriums are rather different from those of other large and open spaces like auditoriums” (p. 107). In this case the centralized atrium creates “flow of space from level to level” and “visual emphasis from the horizontal galleria to the vertical atria” (Hung, and Chow, 2001, p. 287). Bradley (1998) agreed with his study on the
acoustical measurements of ten differently functioned and architecturally varied atriums, that “the atria are found to be different to some other large indoor spaces” (p.2).
However, atrium void leads to crucial problems regarding acoustics because of its uncontrollable formation. One important property leading to bad acoustic indices is that atriums feature rather long reverberation at all frequencies. Chen and Kang (2004) pointed out the atrium void as one of the most important and commonly used architectural feature in shopping centers featuring the longest reverberation time at middle frequencies and the shortest at low frequencies. They indicated the reason of such reverberation characteristics as “the atrium roof glass and shop showcase glass absorb low frequency sounds while reflecting middle and high frequencies” (p. 109).
24 2.3.5. Acoustical Characteristics of Domes
Domes are commonly used in many enclosed spaces, omitting its distinct acoustical characteristic. Similarly with concave surfaces, domes are poor distributor of sound energy which leads to sound focus, dead spots and echo formation (Egan, 1988). In addition, reflected sound does not attenuate as it keeps reflecting within the dome itself increasing the reverberation time. When reflected sound does not decay in appropriate times the perceived sound becomes to be heard as hum of voices. Preventive actions include absorptive material treatments to diminish annoying sound reflections that reduces speech intelligibility (Egan, 1988).
In their article on the speech transmission performance and effect of acoustical remedies in a dome, Inoue et al (2009) evaluated the objective and subjective measures as well as their interrelations. They state that RASTI, EDT in 1 kHz, early-to-late arriving sound energy ratio and Ts (center time) corresponds well with speech intelligibility scores. One other important criterion they have been studied upon is the localization and direction of the sound source being at the center directed towards the dome at an angle of 90 degrees and the other being at the side but still towards the dome. The results of their study showed that reverberation time (T30) found to be longer at lower frequencies and shorter at higher frequencies. In addition, EDT and T30 values are not correlated with each other regarding different source locations. There are spots with longer EDT and shorter T30 values. They also noted that the sound field being excessively reverberant, the speech transmission performance varies for each source-receiver combination.
25 2.3.6. Materials and Applications
The design process of indoor spaces to obtain best possible acoustical conditions can be achieved by proper material selections and applications regarding the function of the building. Properties acoustical characteristics of the materials are the deterministic factors for their application techniques in a space.
One other important design criterion for better acoustical conditions for indoor spaces is to keep the background noise level as low as possible. The background noise occurrence for indoor spaces is mainly from HVAC or environmental sources. The necessary
treatments to lower such unwanted background noise has to be done so that a more comfortable acoustical environment can be achieved.
The frequency range of the noise or any type of unwanted sound is very important for deciding on the most proper acoustical treatment. Fuchs (2001) reminded that 50 to 100 Hz is the range where noise control measurements becomes difficult and have high impact on speech intelligibility and acoustic comfort in auditoria and small enclosures. He emphasized the three important points regarding the usage of various noise control materials and their applications, as follows;
• avoiding mineral fiber usage on acoustic damping for hygiene and health issues, • installing more resistive and non-abrasive materials for better durability under
dirty and aggressive environments,
• replacing absorbing surfaces with large perforation or porous coverings of practically closed, even and smooth surfaces.
26
The key point is to combine the most suitable material regarding the function (absorber, reflector, and isolator) as an architectural component of the space. The innovative acoustical treatments are progressing with better and aesthetic appearances that can easily blend with the designated design of the space.
The term reflection is used to describe the incidence of a sound wave returning from a surface (Egan, 1988). The important criterion for obtaining reflection rather than
absorption is to use a significantly larger reflector or reflective panel than the wavelength of the sound that it is designed to reflect. For any sound in which the frequency range and therefore, its wavelength distribution can be calculated, 2 or 4 times larger reflectors are sufficient. The main purpose of sound reflectors in an auditorium is to provide useful reinforcement of the direct sound to be reflected to audience who are not able to comprehend the direct sound. For music halls and opera houses, diffusers rather than direct sound reflectors are used. The main purpose of such diffusers is to scatter or random redistribute the sound wave to enhance the sensation of sound coming from all directions at equal levels (Egan, 1988). Yet, for spaces that are designed to be ‘non-acoustic’, excessive reflections are not needed. In such case, the reflected sound lowers the speech intelligibility and thereby causes noise annoyance.
In order to create better acoustical environments regarding enclosed ‘non-acoustic’ public spaces, absorbers should be introduced. There are three kinds of absorption mechanisms that are used in architectural design of indoor spaces; porous absorbers, panel absorbers and resonant absorbers (Lord, 2006). The absorption mechanisms have various applications under the main three types. For example, additions to porous
27
absorbers are; spaced porous absorbers, thick porous materials with an air cavity backing and screened porous absorbers. Panel absorbers have the mechanism that is identified as nonporous absorption and sub types are, unbacked panel absorbers, air backed panel absorbers, perorated panel absorbers, perorated metal grills and air backed perforated panels. The third type is absorption by resonant absorbers with sub types, Helmholtz resonator absorbers, mass-air-mass resonators and quarter wave resonators (Long, 2006). Maekawa and Lord (1994) implied that, “in practice, these 3 types, or a
combination of them are considered effective as absorptive building materials or as part of a construction” (pp.114-5).
All these three types of absorbers are effective at certain frequency ranges. Elliot (2002) stated that, active control of sound is most effective at low frequencies as the acoustic wavelength of sound waves is comparatively longer. The conventional passive noise control as absorption is more efficient for medium and high frequency sounds that have shorter wavelengths. As absorption is directly linked with the wavelength combinations of these different types gives a wider range of efficiency.
In order to understand how the material behaves for varying incident waves of different frequencies, reflection, transmission and absorption characteristics of the material has to be stated. Impedance tube testing or reverberation room method could be used to define the reflection, transmission and absorption coefficients of materials. As a result of these tests absorption coefficients of common materials have been determined and the values are put on a table with ranging frequencies (Long, 2006).
28
The porous absorbers are the most commonly used type that includes, fiberglass, mineral fiber products, fiberboard, pressed wood shavings, cotton, felt, open-cell neoprene foam, carpet, sintered metal and many other similar materials (Long, 2006). In his study,
Berhault (2001) mentioned about various materials and their application techniques, in accordance with their characteristics. For a porous absorber namely, ‘porous recycling glass’, varied characteristics support different kinds of applications such as, self-bearing characteristics for applications on screens, mechanically robust for partitions, chemically resistant for enclosures, temperature resistive for linings, non-flammable for ceilings, water-proved for baffles, and finally easy recycling for silencer splitters.
Braccesi and Bracciali (1998) studied on the development and validation of the acoustical behaviors regarding porous materials that are classified as conventional or innovative. They noted that, “acoustic treatments with porous materials are widely used to reduce reverberation properties of closed spaces and to increase the transmission loss
properties of multilayered panels” (p. 59). In order to estimate flow resistivity, they used reflection coefficient data and to estimate structure factor, least square fitting
procedure.
There are many other mechanisms and materials with different acoustical properties, yet the examples in this chapter are chosen to be well related with the study case, CEPA Shopping Center. The criteria discussed in this chapter kept parallel with the case and the study objectives. The hypothesis and scope in relation with the method and assessment tools set forth the objective and subjective criteria and acoustical parameters that will be concentrated on the following chapters.
29
3. DESIGN OF THE STUDY
An experimental study is designed to put forth the objective parameters in the food court area in CEPA and the subjective noise annoyance ratings of the users in that food court area. The comparisons and correlations of these quantitative and qualitative assessments is tried to be accomplished for the evaluation of noise in enclosed public spaces. Other factors such as the demographics and the auditory perception classifications as well as the space utilization characteristics of the users are defined, analyzed and discussed in addition to the main correlated parameters. The methodology and assessment tools used for this study are chosen to fulfill either the quantitative (objective) or qualitative
(subjective) approach.
3.1. Research Questions
The questions that should be investigated to form the basis of this study are;
1. What are the acoustical parameters, reverberation time (RT), early decay time (EDT), Speech Transmission Index (STI) of the food court area in CEPA shopping center?
2. What are the equivalent continuous sound pressure levels (Leq) in the food court area of CEPA in different time slot on the weekdays and the weekends?
3. What is the relationship between RT and STI?
4. How the users rate their noise annoyance in food court of CEPA and what are the users’ auditory perception characteristics?
5. What kind of relations are there between equivalent continuous sound pressure levels (Leq) and noise annoyance ratings in food court area of CEPA?
6. What are the demographics of the users in food court and do these factors affect auditory perception and noise annoyance ratings?
30 3.2. Objectives
Each research question is fulfilled by the defined objectives;
1. To determine the acoustical parameters, reverberation time (RT), early decay time (EDT), Speech Transmission Index (STI) of the food court area in CEPA shopping center. 2. To assess the equivalent continuous sound pressure levels (Leq) in the food court area of CEPA in different time slot on the weekdays and the weekends.
3. To investigate the relationship between RT and STI.
4. To present the users’ noise annoyance ratings and auditory perception characteristics in food court of CEPA.
5. To relate equivalent continuous sound pressure levels (Leq) and noise annoyance ratings in food court area of CEPA.
6. To put forth the demographical factors of the users in food court that may be affective on their auditory perception and noise annoyance ratings?
3.3. Hypotheses
The main hypothesis is, the presence of a central atrium with a glass dome ceiling leads to poor speech transmission index in CEPA Shopping Center.
The second hypothesis is that the measured mean Leq values well relate with the noise annoyance of CEPA Shopping Center food court users.
The third hypothesis is, auditory perception and noise annoyance could be interfered by the users’ demographic, and activity patterns and could be effective on time spent preferences for this case.
31 3.4. Methodology
In order to fulfill the objectives of the study, three different methods are used as, computer simulations and noise measurements being the objective part and
questionnaires as the subjective part. The three assessment tools used in the study are; Odeon 6.5 acoustical analyzer software, Dirac 3.0 room acoustics software and Bruel & Kjaer type 2230 sound level meter, and auditory perception and noise annoyance survey.
Cross-comparisons are done between the results of these three different methods and their relations with each other are evaluated by percentage frequencies, Mann-Whitney U test, Kruskal-Wallis One-way ANOVA test, Kendall’s Tau-c test, linear regression analysis, and Pearson’s chi-square test.
3.4.1. Computer Simulations
The first method is computer simulation that is done by Odeon 6.5 acoustical analyzer software deriving reverberation time (T30), early decay time (EDT), and speech transmission index (STI) results and distribution maps of defined acoustical parameters. There are many different technological achievements in the field of architectural acoustics regarding measurement and application techniques. Computer simulations are widely used for the acoustical calculations of the buildings and for assessing and modifying the acoustical characteristics of a space during the design phase (Rindel, 2000). The computer simulations for this study are done by ODEON 6.5 Room Acoustics Software. The software uses predictions algorithms as image-source method combined with ray tracing for the simulation of acoustical incidences and formations for interior spaces. The software is used to analyze and evaluate on acoustical properties of any kind
32
of enclosed space as well as to assess recommendations for better acoustical environments (Rindel, 2000).
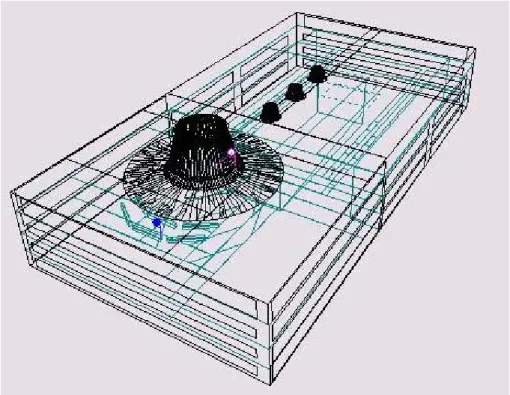
Figure 3.1. Axonometric view of CEPA Shopping Center showing source and receiver positions from the computer simulation.
In order to accomplish the computer simulations on ODEON 6.5 software, firstly, the 3D model of the building is drawn in AutoCAD 2007 with face modeling technique and saved in DXF format. The whole space is modeled for obtaining more reliable results. Then, it has been imported to ODEON 6.5 and the model is formed as seen in the Figure 3.1. After the model has been successfully imported (see Figure 3.2), the materials used in the space are determined and assigned to the identified surfaces. Then, the source and receiver positions are defined.
33 Figure 3.2. 3D view of the model from the receiver.
The enclosed space information given by ODEON Room Acoustics Software is as follows:
• Number of corners: 3246 • Number of surfaces: 1006 • Number of vertices: 4770 • Total surface area: 1155 m2
• Dimensions of the space:
o X: 155 m o Y: 80 m o Z: 40 m
34 3.4.2. Noise Measurements
The second method is noise measurements on the soundscape. Dirac 3.0 room acoustics software and Bruel & Kjaer type 2230 sound level meter (see Figure 3.3) are used to measure equivalent continuous noise level (Leq). This measurement system detects various room acoustic parameters by using either external (impulse or noise) or internal (MLS signal, the sweep or swept sine, white noise and pink noise) excitation signals. In this study, the external excitation signals as impulse or noise are used. The mean Leq value is obtained for each frequency by one-minute measurements done on each measurement point and time.
Figure 3.3. Bruel & Kjaer Type 2230 Sound Level Meter.
3.4.3. Questionnaires
The third method is a questionnaire that is structured not only for evaluating the noise annoyance ratings of the users but also providing information on users’ space utilization characteristics and demographics which may affect their auditory perception. In literature it is found that, a wide number of acoustical comfort evaluation surveys are developed in order to determine the most suitable noise annoyance rating scale. As noise is widely recognized as an important pollutant, many countries have developed their
35
nation-wide noise abatement and control policies (Schultz, 1978). For this study, a survey including fourteen questions is prepared by in-depth examination and consideration of the previously recognized noise annoyance ratings (see Appendix C). The survey is most like a structured interview consisting of three main sections namely; 1- demographics, 2- users’ space utilization, 3- auditory perception and noise annoyance ratings in food court area of CEPA. As Ader and Mellenbergh (2008) advise, all the questions are structured accordingly either with a Likert scale 1 to 5 (1- strongly disagree to 5-strongly agree), closed-ended questions (dichotomous, nominal-polytomous, or ordinal-polytomous) or open-ended questions.
3.5. The Case: Food Court Area of CEPA Shopping Center 3.5.1. Architecture, Shape and Size
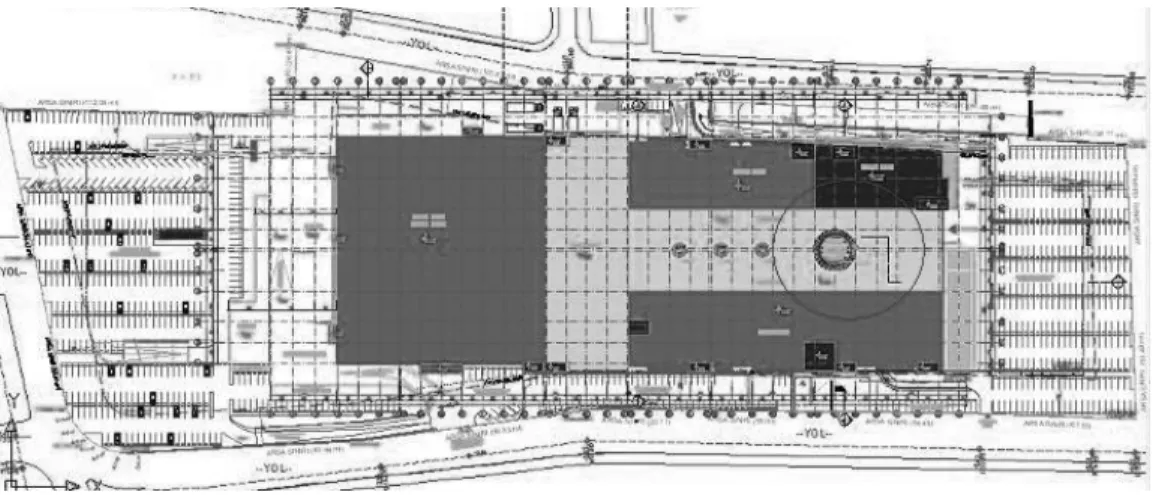
CEPA Shopping Center is one of the widely used public spaces in Ankara. It is located at side of one of the main highways in the city across to Middle East Technical University. The localization of the shopping center is quite central by means of easy access. The shopping center is adjacent to one of the biggest house and garden equipment stores in the city called Bauhaus, which makes the whole center to be more preferred as the result of diverse shopping options (see Figure 3.4).
36
Figure 3.4. The site plan of CEPA Shopping Center and Bauhaus Store.
The height of the CEPA Shopping Center is 40 meters, the width is 80 meters, and the length is 155 meters. The total volume of the Center is 370,000 meter cubes. CEPA is designed with an atrium at the entrance level which connects all floors with each other. The spaces with different functions such as movie theatre, food court or shops are located separately from each other having a unified but at the same time distinct localizations. It should also been noted that, there is a fountain located at the entrance level of the shopping center, which acts as a sound source in the enclosed space.
37
The overall plan is rectangular and designed to have two different circulation axes which are linked to each other at the beginning and at the end (see Figure 3.5). The food court area, which is considered for this study is located at the third floor (see Figure 3.6).
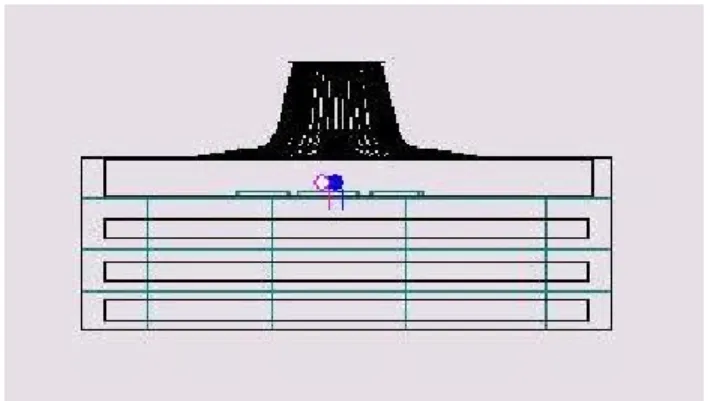
Figure 3.6. The cross-section of CEPA Shopping Center.
Figure 3.7. The longitudinal section of CEPA Shopping Center.
The food court area is the circular enclosed space that is surrounded by various
restaurants and cafes at the sides and a glass dome ceiling above. The considered volume of the food court area is approximately 30,000 m3. The atrium is located at the middle of