JHEP11(2021)153
Published for SISSA by Springer
Received: July 27, 2021 Accepted: October 26, 2021 Published:November 19, 2021
Search for new particles in events with energetic jets and large missing transverse momentum in
proton-proton collisions at √
s = 13 TeV
The CMS collaboration
E-mail: [email protected]
Abstract:A search is presented for new particles produced at the LHC in proton-proton collisions at√
s= 13 TeV, using events with energetic jets and large missing transverse mo- mentum. The analysis is based on a data sample corresponding to an integrated luminosity of 101 fb−1, collected in 2017–2018 with the CMS detector. Machine learning techniques are used to define separate categories for events with narrow jets from initial-state radiation and events with large-radius jets consistent with a hadronic decay of a W or Z boson. A statistical combination is made with an earlier search based on a data sample of 36 fb−1, collected in 2016. No significant excess of events is observed with respect to the standard model background expectation determined from control samples in data. The results are interpreted in terms of limits on the branching fraction of an invisible decay of the Higgs boson, as well as constraints on simplified models of dark matter, on first-generation scalar leptoquarks decaying to quarks and neutrinos, and on models with large extra dimen- sions. Several of the new limits, specifically for spin-1 dark matter mediators, pseudoscalar mediators, colored mediators, and leptoquarks, are the most restrictive to date.
Keywords: Beyond Standard Model, Dark matter, Hadron-Hadron scattering (experi- ments), Higgs physics
ArXiv ePrint: 2107.13021
Open Access, Copyright CERN, https://doi.org/10.1007/JHEP11(2021)153
JHEP11(2021)153
Contents
1 Introduction 2
2 The CMS detector and event reconstruction 3
3 Simulated samples 6
4 Event selection 7
5 Background estimation 10
5.1 Likelihood function 10
5.2 Estimation of the QCD multijet background 11
5.3 Systematic uncertainties 14
6 Results and interpretation 16
6.1 Higgs portal interpretation 16
6.2 Interpretation in a DM simplified model with a colorless mediator 16
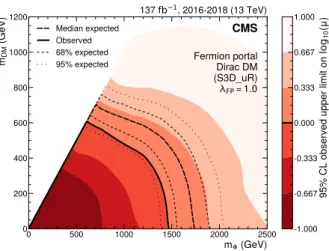
6.3 Fermion portal interpretation 22
6.4 The ADD interpretation 22
6.5 Leptoquark interpretation 22
7 Summary 24
A Additional figures and tables 26
A.1 Event selection summary tables 26
A.2 Hadronic recoil distributions in the control regions 27 A.3 Exclusion in the Higgs portal interpretation split by data taking year 34 A.4 Coupling limits in a simplified DM model with a vector mediator 35 A.5 Two-dimensional exclusion in the simplified DM model with pseudoscalar
mediator 36
A.6 Table of exclusion limits in the ADD model 37
B Supplemental material 38
B.1 Comparison with direct-detection experiments 38
B.2 Distributions of jet tagging variables 39
B.3 Large-radius jet tagging efficiencies for reinterpretation 40 B.4 MonojetpmissT distribution for the full data set 42
B.5 Analysis implementation inMadAnalysis 43
B.6 Event display 45
The CMS collaboration 52
JHEP11(2021)153
1 Introduction
The standard model (SM) of particle physics has been widely recognized as a very success- ful, yet incomplete theory. Many important features of the universe, such as gravity and the existence of dark matter (DM), are not described in the SM. It is therefore paramount to search for evidence of physics beyond the SM (BSM). Attempts at finding BSM physics often center around the production of new, hypothetical particles, which subsequently de- cay to the observable SM particles. In this search, we aim at scenarios that are hidden from such searches, because the decay products of BSM particles are not necessarily detectable.
Scenarios with new particles that are not directly observable in collider detectors are motivated by many BSM theories. One of the strongest motivations stems from the idea of particle DM. Over the last decades, cosmological evidence for the existence of DM has been steadily accumulating [1], yet with few hints as to its nature or detailed properties.
One theoretically attractive model of DM is that of a thermally produced weakly interact- ing massive particle (WIMP). If such a particle has just the right mass and couplings, the abundance of DM in the universe, as well as many of the observed phenomena commonly ascribed to DM, can be explained. In this search, multiple scenarios of DM production are considered. A Higgs portal scenario [2–4] is tested, in which DM particles are pro- duced in decays of the Higgs boson [5–7]. Many of the properties of the new boson have already been measured with impressive precision, but a decay branching fractionBto non- detectable particles of up to about 20% is allowed by the current constraints [8,9]. Beyond the Higgs portal scenario, simplified models of DM production [10] via new bosonic medi- ators with spin 0 or 1 are explored. Colorless mediators coupled to a pair of quarks and to a pair of DM particles are considered, as well as colored mediators, which decay into a single quark together with a single DM candidate. The latter scenario is referred to as a “fermion portal” [11, 12]. In addition to a search for DM, a scenario with large extra dimensions proposed by Arkani-Hamed, Dimopoulos, and Dvali (ADD) [13, 14] is tested.
In this model, the existence of additional spatial dimensions beyond the known three could explain the large difference in strength between the gravitational and electroweak (EW) interactions. In this scenario, gravitons can be produced in proton-proton (pp) collisions via their enhanced couplings to quarks or gluons and avoid detection by escaping in the ad- ditional dimensions. Representative Feynman diagrams for a subset of these signal models are shown in the first three panels of figure 1.
In these models the final-state particles are not detectable, but one needs a visible detector signature to be able to identify and record such events. We use energetic hadronic jets accompanying the invisible particles to select signal candidates. The experimental signature therefore comprises one or more energetic jets and large missing transverse mo- mentum (pmissT ). While thepmissT is the intrinsic result of BSM or SM particles escaping a detector without leaving any trace, hadronic jets derive from either initial-state gluon radi- ation or hadronic decays of energetic heavy SM vector bosons (V) produced in association with BSM particles. Production in association with a V boson is particularly important for the Higgs portal scenario, where the Higgs boson couples directly to the vector boson.
For energetic V bosons, the hadronic decay products are Lorentz boosted in the laboratory
JHEP11(2021)153
frame and are reconstructed as a single large-radius jet with a characteristic substructure.
Machine learning algorithms based on artificial neural networks are used in order to iden- tify such signatures and efficiently suppress the overwhelming background coming from quantum chromodynamics (QCD) production of jets [15]. Separate signal categories are defined for events with and without an identified V candidate. Several control samples in data are used to constrain background contributions to the signal regions.
The chosen experimental signature can also be used to probe other BSM scenarios with new particles decaying into final states with visible and invisible particles. One such scenario probed by the present search is the production of leptoquarks (LQs). The LQs are hypothetical scalar or vector particles that carry both baryon and lepton numbers [16–18].
Here, a scenario with a single scalar LQ type is considered. This first-generation LQ decays into an up quark and an electron neutrino (νe), and can be either produced in pairs [19]
via a coupling to gluons, or singly [20,21] in association with aνe, through its coupling to the up quark and νe. Both processes result in a jets + pmissT signature. A representative Feynman diagram for single LQ production is shown in the last panel of figure 1.
Searches for new phenomena in events with jets and pmissT at√
s= 13 TeV have been previously published by the CMS [22] and ATLAS [23, 24] Collaborations. The search is carried out with the CMS detector at the CERN LHC, in pp collisions at√
s= 13 TeV, us- ing a data set collected in 2017–2018, corresponding to an integrated luminosity of 101 fb−1. Compared to refs. [22], we have tripled the amount of analyzed data and enhanced the analysis sensitivity by means of improved identification of hadronically decaying V bosons.
While such decays were previously selected usingN-subjettiness [25], we now use a criteria based on a deep neural network. We have further extended the sensitivity by combining the new results with those from ref. [22], which are based on a data set of 36 fb−1, yielding a total data set of 137 fb−1, equivalent in size to that of ref. [24].
This paper is organized as follows. After discussing the CMS detector in section 2 and the simulated samples in section 3, we describe the event selection in section 4, followed by the background estimation in section 5. Section 6 contains the results of the analysis and their interpretation in the context of the above scenarios. We summarize the paper in section 7. Tabulated results, as well as extensive material for use in reinterpretation, are provided in HEPData [26]. To further aid reinterpretation, an implementation of the analysis selection is provided in theMadAnalysisframework [27–29]. Information related to the validation of this implementation is provided as supplementary material.
2 The CMS detector and event reconstruction
The central feature of the CMS apparatus is a superconducting solenoid of 6 m internal diameter, providing a magnetic field of 3.8 T. Within the solenoid volume are a silicon pixel and strip tracker, a lead tungstate crystal electromagnetic calorimeter (ECAL), and a brass and scintillator hadron calorimeter (HCAL), each composed of a barrel and two endcap sections. Forward calorimeters extend the pseudorapidity (η) coverage provided by the barrel and endcap detectors. Muons are detected in gas-ionization detectors embedded in the steel flux-return yoke outside the solenoid.
JHEP11(2021)153
q q
q q
H V*
V
χ χ
q q
Z’
χ χ t Φ
u
u νe νe u*
LQ
Figure 1. Representative Feynman diagrams for a number of signal models: Higgs production in association with an SM vector boson (left), colorless spin-1 and spin-0 mediators (middle left and right, respectively), single leptoquark production (right). In all cases, subdominant production modes not pictured here are taken into account, as described in the text.
The silicon tracker measures charged particles within the pseudorapidity range |η|<
2.5. During the LHC running period when the data used in this paper were recorded, the silicon tracker consisted of 1856 silicon pixel and 15 148 silicon strip detector modules.
In the region |η|<1.74, the HCAL cells have widths of 0.087 in pseudorapidity and 0.087 in azimuth (φ). In the η-φ plane, and for |η| < 1.48, the HCAL cells map on to 5×5 arrays of ECAL crystals to form calorimeter towers projecting radially outwards from close to the nominal interaction point. For |η|>1.74, the coverage of the towers increases progressively to a maximum of 0.174 in ∆ηand ∆φ. The hadron forward (HF) calorimeter uses steel as an absorber and quartz fibers as the sensitive material. The two halves of the HF are located 11.2 m from the interaction region, one on each end, and together they provide coverage in the range 3.0<|η|<5.2.
Events of interest are selected using a two-tiered trigger system. The first level (L1), composed of custom hardware processors, uses information from the calorimeters and muon detectors to select events at a rate of around 100 kHz within a fixed latency of about 4µs [30]. The second level, known as the high-level trigger (HLT), consists of a farm of processors running a version of the full event reconstruction software optimized for fast processing, and reduces the event rate to around 1 kHz before data storage [31].
A more detailed description of the CMS detector, together with a definition of the coordinate system used and the relevant kinematic variables, can be found in ref. [32].
The candidate vertex with the largest value of summed physics-object transverse mo- mentap2Tis taken to be the primary vertex (PV) of the pp interaction. The physics objects are the jets, clustered using the jet finding algorithm [33, 34] with the tracks assigned to candidate vertices as inputs, and the associated missing transverse momentum, taken as the negative vector sum of thepT of those jets.
A particle-flow (PF) algorithm [35] aims to reconstruct and identify each individual particle in an event, with an optimized combination of information from the various ele- ments of the CMS detector. In this process, the identification of the PF candidate type (photon, electron, muon, and charged and neutral hadrons) plays an important role in the determination of the particle direction and energy. The energy of photons is obtained from the ECAL measurement. The energy of electrons is determined from a combination of the electron momentum at the PV as determined by the tracker, the energy of the correspond- ing ECAL cluster, and the energy sum of all bremsstrahlung photons spatially compatible
JHEP11(2021)153
with originating from the electron track. The energy of muons is obtained from the cur- vature of the corresponding track. The energy of charged hadrons is determined from a combination of their momentum measured in the tracker and the matching ECAL and HCAL energy deposits, corrected for the response function of the calorimeters to hadronic showers. Finally, the energy of neutral hadrons is obtained from the corresponding cor- rected ECAL and HCAL energies.
For each event, hadronic jets are clustered from the PF candidates using the infrared- and collinear-safe anti-kT algorithm [33, 34] with a distance parameter of 0.4 or 0.8. De- pending on the respective distance parameter, these jets are referred to as “AK4” or “AK8”
jets. Jet momentum is determined as the vectorial sum of all particle momenta in the jet, and is found from simulation to be, on average, within 5 to 10% of the true momentum over the entirepTspectrum and detector acceptance [36]. Additional pp interactions within the same or nearby bunch crossings (pileup) can contribute additional tracks and calorimetric energy depositions to the jet momentum. To mitigate this effect, charged particles identified as not originating from the PV are discarded and an offset correction is applied to correct for the remaining neutral pileup contributions [36]. Jet energy corrections are derived from simulation to bring the measured response of jets to that of particle-level jets on average.
In situ measurements of the momentum balance in the dijet,γ + jet, Z + jet, and multijet events are used to account for any residual differences in the jet energy scale (JES) and jet energy resolution (JER) in data and simulation [36]. The jet energy resolution amounts typically to 15–20% at 30 GeV, 10% at 100 GeV, and 5% at 1 TeV [36]. Additional selection criteria [37] are applied to each jet to remove jets potentially dominated by anomalous contributions from various subdetector components or reconstruction failures.
The missing transverse momentum vector~pTmiss is computed as the negative vector sum of the transverse momenta of all the PF candidates in an event, and its magnitude is denoted aspmissT . The~pTmiss is modified to account for corrections to the energy scale and resolution of the reconstructed jets in the event [38]. Anomalous high-pmissT events can be due to a variety of reconstruction failures, detector malfunctions, or noncollision backgrounds. Such events are rejected by dedicated filters that are designed to eliminate more than 85–90%
of the spurious high-pmissT events with a signal efficiency exceeding 99.9% [38].
Large-radius AK8 jets are used for the identification of hadronic decays of W and Z bosons. The pileup-per-particle identification (PUPPI) algorithm [39] is used to mitigate the effect of pileup at the reconstructed-particle level, making use of local shape informa- tion, event pileup properties, and tracking information. Charged particles identified as not originating from the PV are discarded. For each neutral particle, a local shape variable is computed using the surrounding charged particles within the tracker acceptance (|η|<2.5) compatible with the PV, and using both charged and neutral particles in the region outside of the tracker coverage. The momenta of the neutral particles are then rescaled accord- ing to their probability to originate from the PV deduced from the local shape variable, avoiding the need for jet-based pileup corrections [37]. The modified mass drop tagger algorithm [40,41], also known as the soft-drop (SD) algorithm, with the angular exponent β = 0, soft cutoff thresholdzcut <0.1, and characteristic radius R0 = 0.8 [42], is applied to remove soft, wide-angle radiation from the jet.
JHEP11(2021)153
3 Simulated samples
Monte Carlo (MC) simulated event samples are used to model signal and background contributions to all the analysis regions. In all cases, parton showering, hadronization, and underlying event properties are modeled using pythia[43] version 8.202 or later with the underlying event tune CP5 [44]. Simulation of interactions between particles and the CMS detector is based on Geant4 [45]. The same reconstruction algorithms used for data are applied to simulated samples. The NNPDF3.1 next-to-next-to-leading order (NNLO) set of parton distribution functions (PDFs) [46] is used for the generation of all samples.
For the V + jets processes, predictions with up to two partons in the final state are obtained at next-to-leading order (NLO) in QCD using MadGraph5_amc@nlo version 2.4.2 [47] with the FxFx matching scheme [48] between the jets from the matrix element calculations and the parton shower. Theγ+jets samples are simulated at NLO in QCD with up to one additional parton using MadGraph5_amc@nlo version 2.6.5. This version is also used for all other MadGraph5_amc@nlo samples, unless indicated otherwise.
Samples of events with top quark pairs are generated at NLO in QCD with up to two additional partons in the matrix element calculations usingMadGraph5_amc@nloand the FxFx jet matching scheme. Their cross sections are normalized to the inclusive cross section of the top quark pair production at NNLO in QCD [49]. Events with single top quarks are simulated using powheg 2.0 [50, 51] and normalized to the inclusive cross section calculated at NNLO in QCD [52] for single top quarks produced in association with a W boson, and NLO in QCD [53, 54] for production in association with a quark.
Production of diboson events (WW, WZ, and ZZ) is simulated at leading order (LO) in QCD using pythia, and normalized to the cross sections at NNLO precision for WW production [55] and at NLO precision for the others [56]. The production of Wγ and Zγ events is simulated using MadGraph5_amc@nloat NLO in QCD. Samples of QCD multijet events are generated at LO using pythia.
For the Higgs portal signal model, powhegis used to generate separate signal samples for the different production modes of the Higgs boson: via gluon fusion [57], in association with a SM vector boson (VH) [58], and via vector boson fusion (VBF) [59]. The samples are generated by enforcing decays of the SM Higgs boson to neutrinos, and are normalized to the SM cross sections evaluated at next-to-NNLO in QCD and NLO in EW corrections for the gluon fusion production, and at NNLO in QCD and NLO in EW for the VBF and VH modes [60]. Events for the simplified model scenarios of DM production are generated using MadGraph5_amc@nloand theDMsimp model implementation [61–63]. For the case of spin-1 mediators, events with a pair of DM particles and either one or two additional partons are generated at NLO in QCD, and the FxFx jet matching is used. The couplings between the mediator and quarks, as well as between the mediator and the DM particles, are set to gq = 0.25 and gχ= 1.0, respectively, as recommended by the LHC Dark Matter Working Group [64]. For DM production via spin-0 mediators, which is loop-induced, signal samples are generated at LO with one additional parton in the matrix element calculations, and the respective couplings are set togq =gχ= 1.0 [64]. Separate samples are generated for different coupling types (vector, axial vector, scalar, and pseudoscalar), as well as
JHEP11(2021)153
for different mass hypotheses for the mediator and DM particles. Signal events for the fermion portal scenario are generated using MadGraph5_amc@nlo and the S3D_uR implementation of ref. [65]. In this case, the mediator is assumed to couple to right-handed up quarks and a Dirac fermion DM candidate with a coupling ofλFP= 1. The single and pair production of scalar LQs are simulated at LO in QCD usingMadGraph5_amc@nlo version 2.6.0 with an implementation provided by the authors of ref. [19]. Decays of each LQ to an up quark and an electron neutrino are enforced, and separate samples are generated for the LQ mass values between 0.5 and 2.5 TeV, as well as for the LQ-u-νe coupling values λLQ ranging from 0.01 to 1.5, depending on the LQ mass. Finally, events with graviton production in the ADD scenario are generated at LO using pythia [66]. In this case, samples of signal events are generated for the number of extra dimensions dbetween 2 and 7, and the values of the fundamental Planck scaleMD between 5 and 15 TeV.
4 Event selection
The key feature of the analysis is the extensive use of control data samples for the purpose of precise prediction of the background contributions in the signal regions (SRs), which contain events with high-pT jets and largepmissT . The leading SM background contributions originate from Z → νν and W → `ν production (` = e,µ,τ), the properties of which are constrained using control regions (CRs) with charged leptons that are enriched in Z →``
and W→`νevents, respectively. Additionally, CRs enriched inγ+ jets events are defined.
The V + jets events in these CRs share many kinematic properties of the processes in the SRs and are used to constrain the latter. The CR and SR definitions share as many of the selection criteria as possible, in order to ensure that minimal selection biases are introduced. For each SR, five CRs are defined: dielectron and dimuon CRs enriched in Z → `` events, single-electron and single-muon CRs enriched in W → `ν events, and a fifth CR enriched inγ + jets events.
The SR events are selected using a trigger with a pmissT requirement of at least 120 GeV.
The trigger requirement for the SRs is based on an online calculation of pmissT based on all PF candidates reconstructed at the HLT, except for muons. Events with high-pT muons are therefore also assigned large online pmissT , and the same trigger is used to collect data populating the single-muon and dimuon CRs. The control samples with electrons are selected based on two different single-electron triggers requiring of pT > 35 (32) GeV for 2017 (2018) and pT >115 GeV, and on a single-photon trigger with a requirement of pT >200 GeV. The single-electron triggers differ in their usage of isolation requirements:
while the lower threshold trigger requires electrons to be well isolated, the higher-threshold trigger does not, which gives an improved efficiency at high pT. Similarly, the single- photon trigger avoids the reliance on the online track reconstruction and increases the overall efficiency for electrons withpT >200 GeV. The photon trigger is also used to select events for the photon control samples. During the 2017 data taking, a gradual shift in the timing of the inputs of the ECAL L1 trigger in the region at |η| > 2.0 caused a specific trigger inefficiency. For events containing an electron or a photon (a jet) with pT & 50 (100) GeV in this region, the efficiency loss is up to ≈10–20%, depending on pT, η, and
JHEP11(2021)153
time. Correction factors are computed from data and applied to the acceptance evaluated by simulation for the 2017 samples.
At the analysis level, a requirement of pmissT >250 GeV is applied to the SR events in order to ensure a pmissT trigger efficiency of at least 95%. Events are separated into three mutually exclusive categories based on the properties of the highestpT(“leading”) jet in the event: low-purity mono-V, high-purity mono-V, and monojet. For the mono-V categories, the leading AK8 jet is required to have pT >250 GeV and |η|<2.4. In order to preferen- tially select events where an AK8 jet originates from a hadronic decay of a W or Z boson, the jet is further required to be V tagged with the DeepAK8algorithm [15] and to have an SD-corrected mass of 65< mSD<120 GeV. TheDeepAK8 algorithm employs a deep neural network to differentiate between jets from vector boson, top quark, and Higgs boson decays, as well as jets originating from QCD radiation. The inputs to the neural network are features of up to 100 jet constituent PF candidates of a given jet and features related to up to seven secondary vertices reconstructed in a given collision event. For each jet, the output of the neural network is one numerical score for each of the jet classes, representing the likelihood that the jet originates from that class. In this analysis, separation between vector boson and QCD jets is sought, and a binary score is constructed by taking the ratio of the vector boson score to the sum of vector boson and QCD scores. The assignment to low- and high-purity mono-V categories is then based on the binary score of the leading jet.
The high-purity category selects genuine V jets (QCD jets) with an efficiency of 30 (0.7)%
at a jet pT of 250 GeV, rising to 40 (0.7)% at 800 GeV. For jets failing the high-purity selection, the low-purity selection has an efficiency of 40 (7)% at 250 GeV, falling to 30 (5)% at 800 GeV. Compared to the N-subjettiness-based selection employed in the previ- ous analysis [22], theDeepAK8 tagger reduces the rate of QCD jets incorrectly identified as vector boson jets by a factor of five to ten depending on jet pT without reducing the efficiency for genuine V jets. Events that do not pass the mono-V selection are considered for the monojet category. In this case, the leading AK4 jet in the event is required to have pT >100 GeV, |η|< 2.4, and to pass quality criteria based on the composition of the jet in terms of different types of PF candidates, such as a minimum charged-hadron energy fraction of 10% and a maximum neutral-hadron energy fraction of 80% [37].
In all categories, further requirements are imposed in order to suppress reducible back- ground processes. Events are rejected if they contain a well-reconstructed and isolated electron (photon) with pT > 10 (15) GeV and |η| < 2.5, or a muon with pT > 10 GeV and |η|<2.4 [67,68]. Hadronically decaying τ leptons are identified using the “hadrons- plus-strips” algorithm and a multivariate classifier at a working point corresponding to an efficiency of 70% for genuine τ decays and 0.5–3% for jets from QCD production, de- pending on jet pT [69]. Events with a hadronically decaying τ lepton candidate with pT >18 GeV and |η|<2.3 are removed. These requirements efficiently reject events with leptonic decays of the V bosons and top quarks, as well as backgrounds with photons.
Contributions from top quark processes are further suppressed by rejecting events with AK4 jets that have pT >20 GeV, |η|<2.4, and are identified to have originated from the hadronization of a bottom quark (“b-tagged jets”) using the DeepCSValgorithm with a
“medium” working point, corresponding to correctly identifying a b jet with a probability
JHEP11(2021)153
of 80% and misidentifying a light-flavor quark or gluon jet with a probability of 10% [70].
Finally, topological requirements are applied in order to reject contributions from QCD multijet events. These events do not have pmissT from genuine sources and require a pmissT mismeasurement in order to pass the SR selections, which can happen in two main ways.
In the first case, the energy of a jet in the event could be misreconstructed either as a result of an interaction between the jet with poorly instrumented or inactive parts of the detector, or because of failures in the readout of otherwise functioning detector modules.
In these cases, artificial pmissT is generated with a characteristically small azimuthal an- gle difference between the misreconstructed jet ~pT and the p~Tmiss vectors. Such events are rejected by requiring ∆φ(~pTjet, ~pTmiss) > 0.5. In the second case, large pmissT is gen- erated due to failures of the PF reconstruction, which are suppressed by considering an alternative calculation of pmissT based on calorimeter energy clusters and muon candidates, rather than the full set of all PF candidates. While the calorimeter-based pmissT has sig- nificantly worse resolution than PF pmissT , it is much simpler and more robust. To reduce the multijet background caused by PF reconstruction failures, events are required to have
∆pmissT (PF-calorimeter) = |pmissT (PF)/pmissT (calorimeter)−1| < 0.5. A similar criterion is constructed using an alternative pmissT calculation based exclusively on charged-particle candidates. Since charged particles are only reconstructed within the coverage of the pixel tracking detector, this pmissT variant is robust against noise and PU contributions in the forward calorimeters. Events in the SR are required to have a maximum angular separation in the transverse plane between the regular and charged-particle candidate pmissT vectors of
∆φ(PF,charged) < 2. Finally, a section of the HCAL was not functioning during a part of the 2018 data taking period corresponding to 65% of the total integrated luminosity recorded in that year, leading to irrecoverable mismeasurement in a localized region of the detector (−1.57 < φ < −0.87, −3.0 < η < −1.3). To avoid contamination from such mismeasurement, events where any jet withpT>30 GeV is found in the correspondingη-φ region are rejected in the analysis of the 2018 data set. Events where the mismeasurement is so severe that a jet is fully lost in this region are found to contribute at low values of pmissT <470 GeV and to have a characteristic signature inφ(~pTmiss). Such events are rejected by requiring thatφ(p~Tmiss)∈/[−1.62,−0.62] ifpmissT <470 GeV. The value of 470 GeV is the boundary of the optimal signal region binning just above this contamination region.
In each of the CRs, the same selection criteria are applied as for the corresponding SR (monojet, or low- or high-purity mono-V), with two exceptions: the charged-lepton and photon rejection criteria are inverted to allow the exact number of desired leptons or photons for each CR, and the p~Tmiss vector used in the SR definition is replaced by the hadronic recoil vector U~. The hadronic recoil is defined as the vectorial sum of the
~
pTmiss vector and the transverse momentum vectors of the selected charged lepton(s) or the photon in each event. The hadronic recoil therefore acts as a proxy of the momentum of the V boson or a photon in each CR, convolved with thepmissT resolution, which is equivalent to the role of pmissT in the SRs. In order to enhance the purity of the CRs, specific additional selection criteria are applied. For the charged-lepton CRs, at least one of the leptons is required to pass a more strict set of quality criteria and have pT >40 (20) GeV electrons (muons), while the photon in the photon CR is required to havepT >230 GeV in order to
JHEP11(2021)153
ensure high trigger efficiency. Additionally, events in the single-lepton CRs are required to have a transverse mass mT =p2pmissT p`T(1−cos[∆φ(p~Tmiss, ~p`T)])<160 GeV, and events in the single-electron CR are required to havepmissT >50 GeV in order to reject contributions from QCD multijet events. Finally, in order to enrich the dilepton CRs with Z events, the two leptons are required to have opposite signs and to have an invariant mass in the range 60< m``<120 GeV, consistent with the mass of the Z boson [71].
The event selection criteria for the signal regions of the different analysis categories, and the topological selection differences between regions in the same category are respectively summarized in tables 1and 2 in appendix A.1.
5 Background estimation
Background estimation and signal extraction are performed simultaneously, using a joint maximum likelihood (ML) fit across all SRs and the corresponding single-lepton, dilepton, and photon CRs. For each analysis category, a likelihood function is constructed to model the expected background contributions in each recoil variable bin of the SR and CRs, as well as the expected signal yield in each bin of the SR. The best fit background model, as well as the best fit signal strength, are obtained by maximizing the joint likelihood function of all categories.
5.1 Likelihood function
The likelihood function is defined in the same way as described in ref. [72] and previously used in ref. [22]. Separate approaches are adopted to estimate the dominant (Z + jets, W + jets, γ+ jets) and subdominant (tt, diboson, and QCD multijet) backgrounds.
The predictions for the dominant backgrounds are based on the yield of Z→νν events in each bin of the SR. The per-bin yields for this process are defined as free parameters of the likelihood function. The yields for the W + jets contribution to the SR, as well as the yields of theγ+ jets process in the photon CR and the Z→`` process in the dilepton CRs, are defined relative to the Z → νν yields by introducing a set of per-bin transfer factors. The yields of W → `ν events in the single-lepton CRs are similarly related via transfer factors to the W → `ν event yields in the SRs. This choice of transfer factors takes into account the correlations between the V + jets background contributions in all regions. In all cases, the central values of the transfer factors are obtained from the ratios of the simulated recoil spectra of the respective processes in the SRs to those in CRs. For the minor backgrounds, such as tt and QCD multijet production, the nominal expected yield per region is obtained directly from simulation (top quark and diboson backgrounds, as well as QCD multijet production in the single-lepton CRs) or by dedicated estimates based on control samples in data (QCD multijet production in the SRs and photon CRs).
Contributions from triboson processes are negligible.
Systematic uncertainties are incorporated in the likelihood function as nuisance param- eters, as described in more detail below. In the case of the V + jets processes, the nuisance parameters affect the values of the transfer factors in each recoil variable bin and thus con- trol the ratios of the contributions from different processes, as well as the ratios of the yields
JHEP11(2021)153
in the SRs to those in various CRs. For the subdominant background processes, the yields in each bin are directly parameterized in terms of the nuisance parameters. The final free pa- rameter of the likelihood function is the signal strength modifierµ, which — for a given sig- nal hypothesis — controls the signal normalization relative to the theoretical cross section.
The likelihood method relies on the accurate predictions of the ratios between the dom- inant backgrounds in the SRs and CRs, as well as on the absolute normalization and shape of the recoil distributions for the subdominant backgrounds. To achieve the most accurate possible predictions for these quantities, weights are applied to each simulated event to take into account both experimental and theoretical effects not present in the MC simulated samples. The experimental corrections are related to the trigger efficiencies, identification and reconstruction efficiencies of charged leptons, photons and b-tagged jets, and the pileup distribution in simulation. Theoretical corrections are applied to the V + jets processes in order to model the effects of NLO terms in the perturbative EW corrections [73]. The cor- rections are parameterized as functions of the generator-level boson pT and are evaluated separately for the W(`ν)+jets, Z(``)+jets, andγ+jets processes. For the diboson processes (WW, WZ, and ZZ), EW and QCD NLO corrections are applied differentially in the boson pT. The EW corrections are obtained from ref. [74], while the QCD corrections are derived from simulated samples generated with MadGraph5_amc@nloand powheg. The EW NLO corrections for the Wγ and Zγ processes are similarly obtained from refs. [75,76].
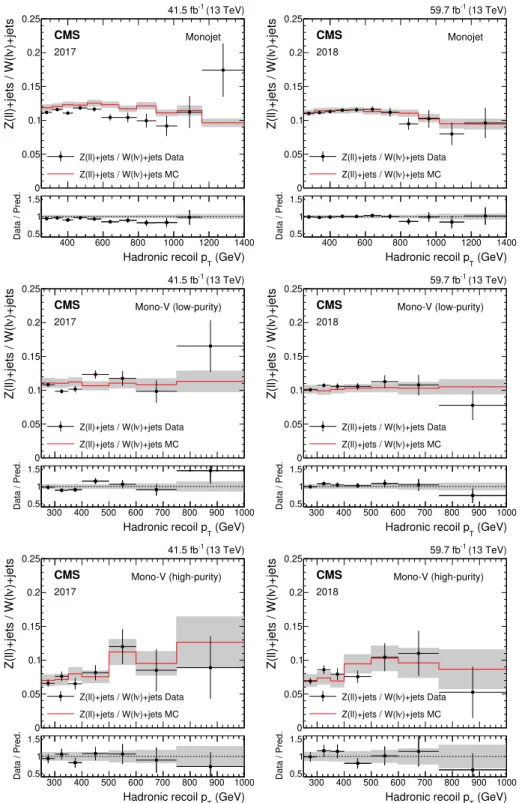
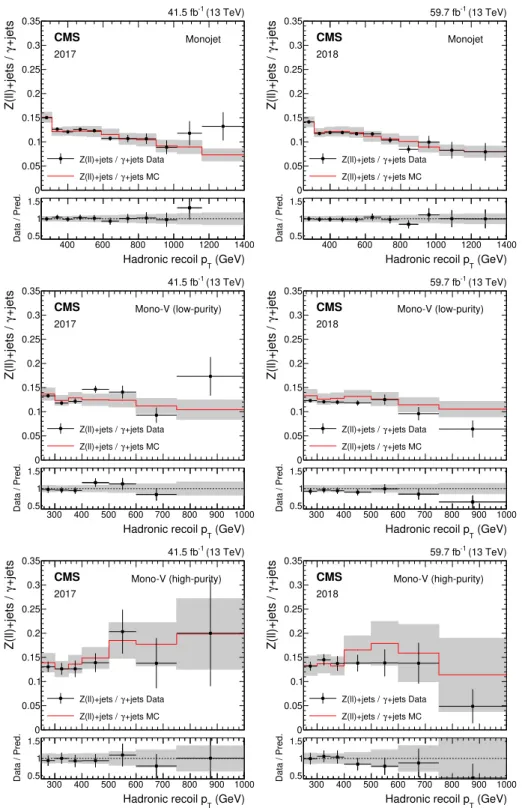
The validity of the predictions is checked by considering the differential ratio of yields in the CRs. The yield ratio serves as a proxy for the ratios of the different V+jets processes, which the fit relies on. The yield ratios between the dilepton and single-lepton CRs, and between the dilepton and photon CRs are shown in figures 2 and 3, respectively. Good agreement is observed between prediction and data. In the monojet categories, it is found that the rate of W→`νevents is initially underpredicted relative to Z →`` andγ events.
This underprediction is corrected in the ML fit, mostly via an adjustment of the nuisance parameters related to the experimental efficiencies for leptons and photons, as well as those related to the noncanceling components of the QCD higher-order corrections.
5.2 Estimation of the QCD multijet background
The contributions from QCD multijet events in each SR and the corresponding photon CR are estimated from data. Multijet events do not carry large intrinsic pmissT , and therefore could only contribute to the SR if one of the hadronic jets in an event is sig- nificantly misreconstructed or partially lost, leading to the ~pTmiss vector and the trans- verse momentum vector of the jet being aligned. The contribution from such events is estimated from a CR that is enriched in multijet events by inverting the requirement on ∆φ(~pTmiss, ~pjT) relative to the SR. The recoil spectrum of multijet events in the SR is obtained by multiplying the spectrum in data in this CR by a transfer factor ob- tained from simulation. The nonmultijet background components, as predicted from simulation, are subtracted from data before applying the transfer factor. The perfor- mance of the method is tested by splitting the low-∆φ(~pTmiss, ~pjT) CR into parts across different boundaries in ∆φ(~pTmiss, ~pjT) (e.g., for a boundary of 0.25, the regions would be
∆φ(~pTmiss, ~pjT)<0.25 and 0.25<∆φ(p~Tmiss, ~pjT)<0.5) and verifying that an estimate based
JHEP11(2021)153
)+jetsνZ(ll)+jets / W(l
0 0.05 0.1 0.15 0.2 0.25
)+jets Data Z(ll)+jets / W(lν
)+jets MC Z(ll)+jets / W(lν
(13 TeV) 41.5 fb-1
2017
Monojet
(GeV) Hadronic recoil pT 400 600 800 1000 1200 1400 Data / Pred. 0.5
1 1.5
CMS
)+jetsνZ(ll)+jets / W(l
0 0.05 0.1 0.15 0.2 0.25
)+jets Data Z(ll)+jets / W(lν
)+jets MC Z(ll)+jets / W(lν
(13 TeV) 59.7 fb-1
2018
Monojet
(GeV) Hadronic recoil pT
400 600 800 1000 1200 1400
Data / Pred. 0.5 1 1.5
CMS
)+jetsνZ(ll)+jets / W(l
0 0.05 0.1 0.15 0.2 0.25
)+jets Data Z(ll)+jets / W(lν
)+jets MC Z(ll)+jets / W(lν
(13 TeV) 41.5 fb-1
2017
Mono-V (low-purity)
(GeV) Hadronic recoil pT 300 400 500 600 700 800 900 1000 Data / Pred. 0.5
1 1.5
CMS
)+jetsνZ(ll)+jets / W(l
0 0.05 0.1 0.15 0.2 0.25
)+jets Data Z(ll)+jets / W(lν
)+jets MC Z(ll)+jets / W(lν
(13 TeV) 59.7 fb-1
2018
Mono-V (low-purity)
(GeV) Hadronic recoil pT 300 400 500 600 700 800 900 1000 Data / Pred. 0.5
1 1.5
CMS
)+jetsνZ(ll)+jets / W(l
0 0.05 0.1 0.15 0.2 0.25
)+jets Data Z(ll)+jets / W(lν
)+jets MC Z(ll)+jets / W(lν
(13 TeV) 41.5 fb-1
2017
Mono-V (high-purity)
(GeV) Hadronic recoil pT 300 400 500 600 700 800 900 1000 Data / Pred. 0.5
1 1.5
CMS
)+jetsνZ(ll)+jets / W(l
0 0.05 0.1 0.15 0.2 0.25
)+jets Data Z(ll)+jets / W(lν
)+jets MC Z(ll)+jets / W(lν
(13 TeV) 59.7 fb-1
2018
Mono-V (high-purity)
(GeV) Hadronic recoil pT 300 400 500 600 700 800 900 1000 Data / Pred. 0.5
1 1.5
CMS
Figure 2. Ratio of the dilepton to single-lepton control region yields predicted using simulation (red solid line), and observed in data (black points). The gray band represents the total uncertainty in the ratio. In the lower panels, the ratio of data over prediction is shown. From upper to lower, the rows show the monojet, low-purity, and high-purity mono-V categories, while the left (right) column represents the 2017 (2018) data set.
JHEP11(2021)153
+jetsγZ(ll)+jets /
0 0.05 0.1 0.15 0.2 0.25 0.3 0.35
+jets Data Z(ll)+jets / γ
+jets MC Z(ll)+jets / γ
(13 TeV) 41.5 fb-1
2017
Monojet
(GeV) Hadronic recoil pT
400 600 800 1000 1200 1400
Data / Pred. 0.5 1 1.5
CMS +jetsγZ(ll)+jets /
0 0.05 0.1 0.15 0.2 0.25 0.3 0.35
+jets Data Z(ll)+jets / γ
+jets MC Z(ll)+jets / γ
(13 TeV) 59.7 fb-1
2018
Monojet
(GeV) Hadronic recoil pT
400 600 800 1000 1200 1400
Data / Pred. 0.5 1 1.5
CMS
+jetsγZ(ll)+jets /
0 0.05 0.1 0.15 0.2 0.25 0.3 0.35
+jets Data Z(ll)+jets / γ
+jets MC Z(ll)+jets / γ
(13 TeV) 41.5 fb-1
2017
Mono-V (low-purity)
(GeV) Hadronic recoil pT 300 400 500 600 700 800 900 1000 Data / Pred. 0.5
1 1.5
CMS +jetsγZ(ll)+jets /
0 0.05 0.1 0.15 0.2 0.25 0.3 0.35
+jets Data Z(ll)+jets / γ
+jets MC Z(ll)+jets / γ
(13 TeV) 59.7 fb-1
2018
Mono-V (low-purity)
(GeV) Hadronic recoil pT 300 400 500 600 700 800 900 1000 Data / Pred. 0.5
1 1.5
CMS
+jetsγZ(ll)+jets /
0 0.05 0.1 0.15 0.2 0.25 0.3 0.35
+jets Data Z(ll)+jets / γ
+jets MC Z(ll)+jets / γ
(13 TeV) 41.5 fb-1
2017
Mono-V (high-purity)
(GeV) Hadronic recoil pT 300 400 500 600 700 800 900 1000 Data / Pred. 0.5
1 1.5
CMS +jetsγZ(ll)+jets /
0 0.05 0.1 0.15 0.2 0.25 0.3 0.35
+jets Data Z(ll)+jets / γ
+jets MC Z(ll)+jets / γ
(13 TeV) 59.7 fb-1
2018
Mono-V (high-purity)
(GeV) Hadronic recoil pT 300 400 500 600 700 800 900 1000 Data / Pred. 0.5
1 1.5
CMS
Figure 3. Ratio of the dilepton to photon control region yields predicted using simulation (red solid line), and observed in data (black points). The gray band represents the total uncertainty in the ratio. In the lower panels, the ratio of data over prediction is shown. From upper to lower, the rows show the monojet, low-purity, and high-purity mono-V categories, while the left (right) column represents the 2017 (2018) data set.
JHEP11(2021)153
on the low-∆φ(~pTmiss, ~pjT) part of the region (∆φ(p~Tmiss, ~pjT) <0.25 in the above example) can correctly predict the QCD multijet background contribution in the high-∆φ(~pTmiss, ~pjT) part (0.25<∆φ(~pTmiss, ~pjT)<0.5). The method is found to predict correctly the QCD back- ground contribution to approximately 25% for various choices of ∆φ(p~Tmiss, ~pjT) boundaries, a value which is assigned as a normalization uncertainty in the QCD multijet background estimate in the SR. Uncertainties related to the finite size of multijet samples, as well as to the choice of the transfer factor binning, are taken into account and may affect the normal- ization and shape of the background estimate by between 10 and 50% depending onpmissT . In the photon CR, multijet events can contribute if a jet is misreconstructed as an isolated photon. The fraction of photons resulting from jet misreconstruction is estimated from the distribution of the lateral shower width of the photons. The distribution of this variable shows a characteristic peak for genuine photons, while being significantly more flat for the contribution from jets misreconstructed as photons. A template fit is performed to the distribution in data in order to extract the relative contributions of the two com- ponents. Templates for genuine photons are obtained from simulation, while templates for misreconstructed jets are taken from a CR in data with an inverted photon isolation requirement that is enriched in QCD multijet events. The fraction of photons originating from jet misreconstruction is found to range between 3.5% at pT = 200 GeV and 1% at 800 GeV. A prediction for the recoil distribution in QCD multijet events in the photon CR is obtained by weighting the photon candidate spectrum in data by the misreconstructed jet fraction evaluated at the respectivepT of the photon candidates. A 25% uncertainty is assigned to the normalization of the QCD multijet background to account for mismodeling of the shower width in simulation. The uncertainty is estimated by repeating the mea- surement while varying the binning of the shower width distribution used for fitting, which serves to modulate the effect of the mismodeling. The statistical uncertainty in the deter- mination of the differential recoil shape is taken into account and ranges from less than 1%
at low recoil values up to 10 (20)% at a recoil value of 1.4 TeV in the 2017 (2018) data set.
5.3 Systematic uncertainties
The inputs to the ML fit are subject to various experimental and theoretical uncertainties.
The overall experimental uncertainty is dominated by the uncertainties in the efficiency of identifying and reconstructing lepton and photon candidates, as well as the uncertainty in the trigger efficiency. The uncertainties in the efficiencies of reconstructing and iden- tifying electron candidates are 1.0 and 2.5%, respectively. For muons, the corresponding uncertainties are 1%, with an additional 1% uncertainty in the efficiency of the isolation criteria. Finally, for photons, the uncertainty in the reconstruction efficiency is negligible, and the uncertainty in the identification efficiency ranges between 4% atpT= 200 GeV and 12% at 1 TeV. The uncertainties in the identification efficiency of lepton candidates are further propagated to the estimate of the contribution from background processes in the SRs, where events with identified leptons are rejected. These uncertainties predominantly affect the W →`ν process, and their magnitude is taken to be 1–2% of the total W →`ν yield for the identification of τ leptons, 1.5% for electrons, and less than 0.5% for muons.
The uncertainty in the photon energy calibration modeling is 1% of the photon momentum,
JHEP11(2021)153
leading to an effect on the background yield in the photon control region of up to 3% at low recoil values. The uncertainty in the b tagging efficiency leads to an uncertainty of 6% in the normalization of background processes with top quarks, and 2% in the normalization of the diboson and QCD multijet processes. The uncertainties in the trigger efficiency are 2%
for both the electron or photon triggers, and 1% per identified muon for thepmissT trigger for recoil values of less than 400 GeV, and negligible above this threshold. The muon multiplic- ity dependence of thepmissT trigger uncertainty reflects the differences in the reconstruction of muons at the trigger and offline levels, which affect the calculation of the hadronic recoil value. Uncertainties of 75% are assigned to the normalization of the QCD multijet back- ground contributions in the single-lepton regions, which are estimated from LO simulation.
Finally, additional uncertainties of 20% each are assigned to the rate of the Drell-Yan events entering the single-lepton CRs and of theγ + jets events entering the single-electron CRs.
The theoretical uncertainties in the transfer factors related to higher-order effects in the QCD and EW perturbative expansions are calculated according to the prescription given in ref. [73] and implemented, as described in ref. [22]. The uncertainty related to the modeling of PDFs is estimated using the replicas provided in the PDF4LHC15 PDF set [77–80]. Additionally, uncertainties of 10% each are assigned to the cross sections of the diboson and top quark processes, and a further 10% normalization uncertainty is assigned to account for the differences in the pT spectrum of simulated and observed top quark events [81]. For the diboson and Vγ processes, additional uncertainties related to unknown mixed QCD-EW NLO corrections are estimated based on the product of the individual EW and QCD correction terms. These uncertainties range between 1 and 10%, depending on the process and boson pT.
The likelihood functions obtained for the monojet and mono-V categories, as well as for the two data taking years, are combined in order to maximize the statistical power of the analysis. The results based on the data set analyzed here, which corresponds to an integrated luminosity of 101 fb−1, are further combined with the results of an earlier anal- ysis [22] based on a data set collected at the same center-of-mass energy in 2016 and corre- sponding to an integrated luminosity of 36 fb−1. The combination is performed by defining a combined likelihood describing all the analysis regions in all data sets. For this purpose, the effects of all theoretical uncertainties are assumed to be correlated. Most experimental uncertainties are dominated by the inherent precision of auxiliary measurements specific to each data set and are thus assumed to be uncorrelated between different data taking years.
The experimental uncertainties related to the JES and JER, as well as those related to the determination of the integrated luminosity are partially correlated between the data taking years, which is taken into account by splitting the total uncertainty into its correlated and uncorrelated components. In order to harmonize the theoretical signal treatment between the data sets, the signal templates from ref. [22] are replaced by the templates derived from simulated samples with generator configurations identical to those used in the analysis of the more recent data sets. Use of the more accurate generator worsens the excluded cross sections based on the 2016 data set alone by up to 13%, depending on the signal hypothesis.
The effect is reduced to a few percent level in the fully combined final result.
JHEP11(2021)153
6 Results and interpretation
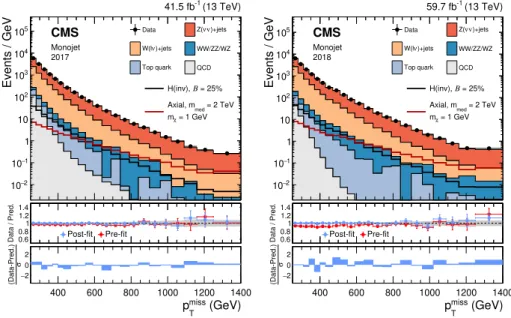
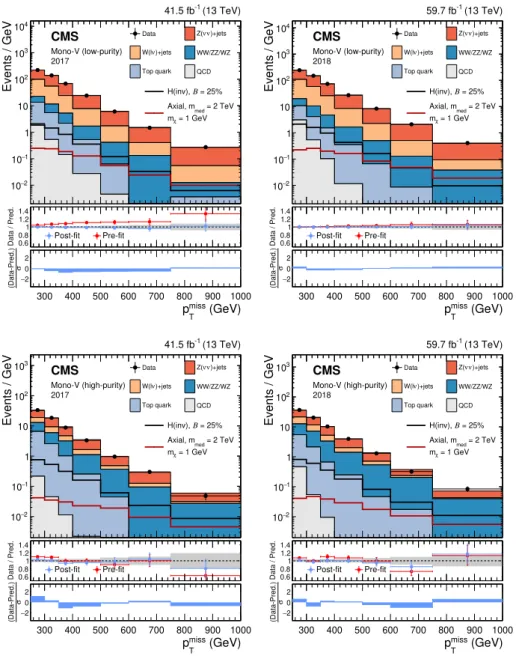
The ML fit is performed by combining the analysis categories as well as the 2017 and 2018 data sets. The pmissT distributions in the SRs before (“pre-fit”) and after (“post-fit”) the fit are shown in figure 4 for the monojet category and in figure 5 for the low-purity and high-purity mono-V categories. In all cases, good agreement is observed between the background-only post-fit result and the data. The corresponding distributions for the CRs are shown in figures 13–18in appendix A.2.
In the following, signal strength exclusion limits are presented for different signal hy- potheses. Unless explicitly stated, all data sets and categories are included. The exclusion limits are calculated using the asymptotic approximation of the CLsmethod [82–84]. In this method, a signal-plus-background fit is performed for each signal hypothesis in addition to the background-only fit. In the signal fits, the nuisance parameters are profiled, and the re- sulting best fit nuisance parameters vary for the different signal hypotheses. Consequently, different nonzero best fit values for the signal strength can be obtained for different signals even if the background-only fit succeeds in modeling the data. In the exclusion limits, this feature is represented by differences between the observed and expected limits.
6.1 Higgs portal interpretation
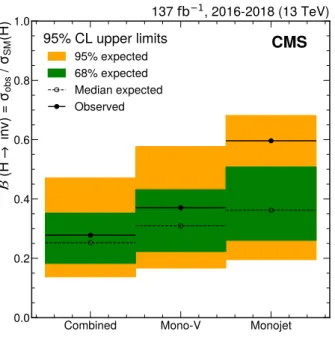
The results are interpreted in terms of the exclusion limits at 95% confidence level (CL) on the branching fraction of an otherwise SM-like Higgs boson to particles without detectable detector interactions (invisible decays). The limits are derived assuming the SM production cross section for the Higgs boson [60]. In the monojet category, values of B(H → inv.) larger than 59.6% are excluded (36.2% expected). In the combination of the mono-V categories, branching fractions of more than 37.0% are excluded (31.0% expected). Finally, the combination of all categories yields an exclusion limit of B(H→inv.)<27.8% (25.3%
expected). These limits are summarized in figure 6. The result from the combination of the mono-V and monojet channels exhibits a closer agreement between the expected and observed exclusions than either of the two channels individually. This is a result of correlations in the background model between the categories. A year-by-year breakdown of the sensitivity is shown in figure19in appendixA.3. Compared to the previous result in the same channel from ref. [22], which is included here, the exclusion limit is improved by a factor of 1.9 (1.6 expected), and represents the most stringent limit from the combined gluon-fusion and V(qq)H channels to date. The current best limit is 19% from ref. [9], in which multiple analyses based on data sets of up to 36 fb−1are combined, including ref. [22].
6.2 Interpretation in a DM simplified model with a colorless mediator
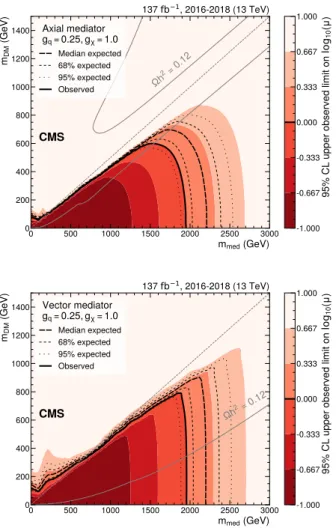
The results are further interpreted in terms of simplified models of DM production. In a model with a spin-1 mediator, exclusion limits are calculated in the two-dimensional parameter space of the DM and mediator particle masses, mDM and mmed. The coupling between the mediator and the SM quarks is set to a constant value of gq = 0.25, the mediator-DM coupling is set to gχ = 1.0, and vector and axial-vector type couplings are considered in separate interpretations. The resulting exclusion limits at 95% CL on
JHEP11(2021)153
Events / GeV
2
10− 1
10−
1 10 102
103
104
105
= 25%
Β H(inv),
= 1 GeV mχ
= 2 TeV Axial, mmed Data Z(νν)+jets
)+jets
W(lν WW/ZZ/WZ
Top quark QCD
(13 TeV) 41.5 fb-1
Monojet 2017
Data / Pred. 0.6 0.8 1 1.2 1.4
Post-fit Pre-fit
(GeV)
miss
pT
400 600 800 1000 1200 1400
σ(Data-Pred.) 2−
0 2
CMS
Events / GeV
2
10− 1
10−
1 10 102
103
104
105
= 25%
Β H(inv),
= 1 GeV mχ
= 2 TeV Axial, mmed Data Z(νν)+jets
)+jets
W(lν WW/ZZ/WZ
Top quark QCD
(13 TeV) 59.7 fb-1
Monojet 2018
Data / Pred. 0.6 0.8 1 1.2 1.4
Post-fit Pre-fit
(GeV)
miss
pT
400 600 800 1000 1200 1400
σ(Data-Pred.) 2−
0 2
CMS
Figure 4. Comparison between data and the background prediction in the monojet signal region before and after the simultaneous fit. The fit includes all control regions and the signal region in all categories and both data taking years, and the background-only fit model is used. The resulting distributions are shown separately for 2017 (left) and 2018 (right). Templates for two signal hypotheses are shown overlaid as black and dark red solid lines. The last bin includes the overflow. In the middle panels, ratios of data to the pre-fit background prediction (red solid points) and post-fit background prediction (blue solid points) are shown. The gray band in the middle panels indicates the post-fit uncertainty after combining all the systematic uncertainties. Finally, the distribution of the pulls, defined as the difference between data and the post-fit background prediction divided by the quadratic sum of the post-fit uncertainty in the prediction and statistical uncertainty in data, is shown in the lower panels.
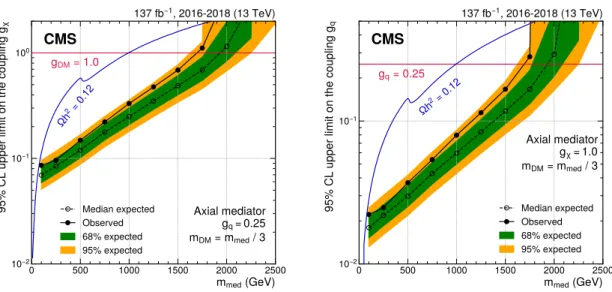
the signal strength µ are shown in figure 7. Values of mmed up to 1.95 TeV (2.2 TeV expected) are excluded for low mDM values. The maximum excluded values of mmed decrease with increasing mDM, as the branching fraction of the mediator to DM particle decays diminishes. The dependence of the branching fraction onmDM is more pronounced in the case of an axial-vector mediator, leading to a reduced maximal exclusion reach in mDM of 0.7 TeV, as opposed to 1 TeV for the vector case. Compared to the results of ref. [22], the combined limits improve the maximal exclusion in terms of the mediator mass by approximately 400 GeV, or 20%. In addition to the constraints in themDM-mmedplane, we also obtain exclusion limits in the planes ofmmed andgq, as well asmmed andgχ, which are shown in figure 8 for the case of axial-vector couplings. The coupling value exclusio