EUROPEAN ORGANIZATION FOR NUCLEAR RESEARCH (CERN)
CERN-EP-2018-258 2019/03/28
CMS-B2G-17-014
Search for top quark partners with charge 5/3 in the
same-sign dilepton and single-lepton final states in
proton-proton collisions at
√
s
=
13 TeV
The CMS Collaboration
∗Abstract
A search for the pair production of heavy fermionic partners of the top quark with charge 5/3 (X5/3) is performed in proton-proton collisions at a center-of-mass energy of 13 TeV with the CMS detector at the CERN LHC. The data sample analyzed corre-sponds to an integrated luminosity of 35.9 fb−1. The X5/3 quark is assumed always to decay into a top quark and a W boson. Both the right-handed and left-handed X5/3couplings to the W boson are considered. Final states with either a pair of same-sign leptons or a single lepton are studied. No same-significant excess of events is observed above the expected standard model background. Lower limits at 95% confidence level on the X5/3quark mass are set at 1.33 and 1.30 TeV respectively for the case of
right-handed and left-right-handed couplings to W bosons in a combination of the same-sign dilepton and single-lepton final states.
Published in the Journal of High Energy Physics as doi:10.1007/JHEP03(2019)082.
c
2019 CERN for the benefit of the CMS Collaboration. CC-BY-4.0 license
∗See Appendix A for the list of collaboration members
1
1
Introduction
The prediction of new heavy quarks is a common feature of many theories of physics beyond the standard model (SM). In composite Higgs models [1–3], heavy partners of the SM top quark solve the hierarchy problem caused by quadratic divergences in the quantum-loop corrections to the Higgs boson mass by providing contributions that offset those due to the SM top quark. Often in such models, new color-triplet partners are predicted, with one of them having an exotic electric charge of 5/3 times the charge of the positron, referred to as X5/3. In partially
composite scenarios [4], these exotically charged fermions need not contribute to the gluon-gluon fusion production mode of the Higgs boson [5] and hence such measurements set no constraints on the mass of the X5/3particle. This paper describes a search for such a fermionic
top quark partner, using proton-proton (pp) collision data collected during 2016 at a center-of-mass energy of 13 TeV with the CMS experiment at the CERN LHC, corresponding to an integrated luminosity of 35.9 fb−1.
The dominant mechanism for X5/3production, shown in Fig. 1, is via quantum
chromodynam-ics (QCD) processes, which yield particle-antiparticle pairs, since the X5/3 carries color charge.
The X5/3 particle can also be singly produced via electroweak processes, but that production
mode is model dependent and is not considered here. Since the pair production involves exclu-sively the SM QCD coupling, the tree-level cross section is independent of the X5/3properties, other than its mass. The X5/3particle is assumed to decay into a top quark and a W boson with a branching fraction of 100%, since this is the dominant decay mode in many models [6]. The decay can occur through either right-handed (RH) or left-handed (LH) couplings to W bosons, and this search presents results for either fully RH or fully LH decays. Thus we have not re-stricted the interpretation of the results to the case of vector-like quarks, whose left-handed and right-handed chirality states have the same transformation properties under the weak isospin SU(2)gauge group, although limits obtained with this assumption would be very similar to those set for pure-LH or pure-RH couplings.
q
q
g
5/3X
5/3X
+W
t
−W
t
g
g
g
5/3X
5/3X
+W
t
−W
t
Figure 1: Leading order Feynman diagrams showing pair production and decays of X5/3
par-ticles via QCD processes.
This search focuses on two different final states consisting of either exactly one lepton or mul-tiple leptons with the requirement that there be a pair of same-sign leptons. In both cases, additional hadronic activity in the event is required. Throughout the paper, the word lepton refers to an electron or a muon. Although leptonic tau decays are not specifically targeted in this analysis, their contribution to the signal efficiency is taken into account. The same-sign dilepton final state relies on its relatively clean signature and the large amount of jet activity from the other X5/3 particle in the event to discriminate against background processes. The
single-lepton channel exploits the shape of the distribution of the visible mass of the top quark reconstructed in the detector to discriminate against background events.
Previously, CMS conducted a search for the X5/3 particle using data collected at a center-of-mass energy of 8 TeV, corresponding to an integrated luminosity of 19.5 fb−1, in the same-sign dilepton channel only, setting a lower limit on the X5/3 mass of 800 GeV at 95% confidence level (CL) [7]. CMS has recently carried out another search [8] for X5/3in a combination of the same-sign dilepton and single-lepton final states using data collected in 2015 at√s = 13 TeV, corresponding to an integrated luminosity of 2.3 fb−1, setting a lower limit on the X5/3 mass of 1.02 (0.99) TeV for an RH (LH) coupling. Searches have also been performed by the ATLAS experiment at center-of-mass energies of 8 and 13 TeV [9–14]. The results based on√s=13 TeV with 36.1 fb−1of data set a lower limit of 1.37 TeV on the mass of the X5/3particle.
The present search follows closely the strategy of Ref. [8] and benefits from an order of magni-tude increase in the integrated luminosity. This paper is organized as follows: Section 2 briefly describes the CMS detector; Section 3 discusses the simulated signal and background samples; in Section 4, trigger details are given; Section 5 contains a description of the event reconstruc-tion; the analyses of the same-sign dilepton and single-lepton final states are detailed in Sec-tions 6–7; and the systematic uncertainties are discussed in Section 8. Finally, SecSec-tions 9–10 give the results and a summary.
2
The CMS detector
The central feature of the CMS apparatus is a superconducting solenoid of 6 m internal diame-ter, providing a magnetic field of 3.8 T. Within the solenoid volume are a silicon pixel and strip tracker, a lead tungstate crystal electromagnetic calorimeter (ECAL), and a brass and scintilla-tor hadron calorimeter (HCAL), each composed of a barrel and two endcap sections. Forward calorimeters extend the pseudorapidity (η) coverage provided by the barrel and endcap detec-tors. Muons are detected in gas-ionization chambers embedded in the steel flux-return yoke outside the solenoid. Events of interest are selected using a two-tiered trigger system [15]. The first level, composed of custom hardware processors, uses information from the calorimeters and muon detectors to select events at a rate of around 100 kHz within a time interval of less than 4 µs. The second level, known as the high-level trigger, consists of a farm of processors running a version of the full event reconstruction software optimized for fast processing, and reduces the event rate to less than 1 kHz before data storage.
A more detailed description of the CMS detector, together with a definition of the coordinate system used and the relevant kinematic variables, can be found in Ref. [16].
3
Simulation
The X5/3 signal processes are generated using a combination of MADGRAPH5 aMC@NLO
2.2.2 [17] and MADSPIN [18] for two coupling scenarios: allowing only RH or only LH X5/3
coupling to W bosons. The MADGRAPH5 aMC@NLOevent generator is used both to produce
X5/3 events and to decay each X5/3 to a top quark and a W boson, while the decays of the top
quarks and W bosons are simulated with MADSPIN. The signal events are simulated at leading order (LO) for X5/3masses from 800 to 1500 GeV, in 100 GeV steps, separately for each coupling
scenario. The signal samples are then normalized to the next-to-next-to-leading order cross sec-tions using the TOP++2.0 generator [19–24], with resummation of soft gluon corrections at the next-to-next-to-leading logarithmic accuracy.
3
A variety of event generators are used for the Monte Carlo (MC) simulation of the background processes. The POWHEG 2.0 [25–28] event generator is used to simulate tt, single top quark events in the t-channel and tW channel, ttH, WZ, and ZZ events to next-to-leading order (NLO) precision. The MADGRAPH5 aMC@NLOevent generator is used to simulate Z+jets, W+jets,
sin-gle top quark process in the s-channel, ttZ, ttW, and tttt processes, events with a combination of three W or Z bosons, and QCD multijet events. The Z+jets, W+jets, WW, and QCD multi-jet processes are generated at LO using the MLM matching scheme [29]. The FxFx matching scheme [30] is used for ttZ, ttW, tttt, triboson, and single top quark process in the s-channel, which are generated at NLO.
Additional pp interactions in the same or neighboring bunch crossings (pileup) are modeled by superimposing simulated minimum-bias interactions onto the simulated events for all pro-cesses. Simulated events are reweighted so that the number of pileup interactions matches the distribution observed in data.
Parton showering, hadronization, and the underlying event are simulated with PYTHIA
8.212 [31], using NNPDF 3.0 [32] parton distribution functions (PDFs) and the CUETP8M1 tune [33, 34] for all MC processes, except for the tt sample, which is produced with the CUETP8M2T4 tune [35]. Finally, for all MC samples, generated events are processed through the full GEANT4-based simulation of the CMS detector [36] and then reconstructed using the
same procedure as the data.
The transverse momentum (pT) spectrum of the top quarks in tt events is known to be
mis-modeled in simulation [37] and, therefore, corrections are applied to simulated tt events as a function of the top quark pT.
Many of the SM background processes in this search are similar and are therefore grouped to-gether in the discussion that follows. The same-sign dilepton final state groups SM processes according to their similarity to the signal topology and classifies them as “tt+X”, containing ttW, ttZ, ttH, and tttt, which are those processes most similar to the signal, and “multiboson”, comprising all processes mentioned above where two or three electroweak bosons are directly produced. For the single-lepton final state, the background processes are grouped into three categories. The first category is referred to as “TOP”, which is dominated by tt events, but also includes any process having at least one top quark. The second category is referred to as “EWK”, which is dominated by W+jets events, but includes all processes that contain elec-troweak bosons and no top quark. The third category is referred to as “QCD” and is the QCD multijet background.
4
Trigger and event selection
For the same-sign dilepton final state, candidate events are required to have passed triggers based on two electrons, two muons, or electron-muon combinations. For the first half of the data set, symmetric trigger pTthresholds were used for the dielectron and electron-muon
trig-gers, corresponding to a pTrequirement of 33 (30) GeV for the former (latter). During the
data-taking period, the instantaneous luminosity of the LHC steadily increased. Therefore, for the second half of the data set, to keep the trigger rate at an acceptable level, these triggers were replaced with new ones that had asymmetric pTrequirements, with the higher pT(leading)
lep-ton requirement of 37 GeV and the lower pT (subleading) lepton threshold of 27 GeV, for both
the dielectron and electron-muon triggers. Throughout the entire data taking period, the same dimuon trigger, which had pT requirements of 30 (11) GeV for the leading (subleading) muon,
In the single-lepton final state, events are required to pass either single-electron or single-muon triggers. For the single-electron triggers, either an electron isolated from nearby particles with pT >32 GeV, or a very loosely isolated electron with pT >15 GeV together with HT >350 GeV
is required, where HTis the scalar pT sum of all jets at the trigger level with pT > 30 GeV and |η| <3.0. The single-muon triggers require either a muon with pT >50 GeV with no isolation
requirement or a very loosely isolated muon with pT >15 GeV together with HT >350 GeV.
5
Object reconstruction
This search makes use of electrons, muons, jets, and missing transverse momentum. The re-construction of these objects is based on a particle-flow (PF) algorithm [38], which reconstructs and identifies particles using an optimized combination of subdetector information.
The candidate events are required to have at least one reconstructed vertex passing basic qual-ity criteria. In the case that there are multiple reconstructed vertices, the one with the largest value of summed physics-object p2T is taken to be the primary pp interaction vertex. Here, the physics objects are the jets, clustered using the jet finding algorithm [39, 40] with the tracks assigned to the vertex as inputs, and the associated missing transverse momentum, taken as the negative vector pT sum of those jets.
Electron candidates are reconstructed from a collection of electromagnetic clusters that are matched to reconstructed tracks in the tracker [41]. As in Ref. [8], the identification criteria for electrons are based on a multivariate analysis (MVA), which makes use of shower shape variables, track quality requirements, variables measuring compatibility between the track and matched electromagnetic clusters, distance from the track to the primary vertex, and the prob-ability that the electron candidate arises from a photon conversion.
In the same-sign dilepton final state, a consistency requirement is placed on the three mea-surements of the electron charge that result from three different methods. Two of these charge assignment methods are based solely on tracker information, where the charge of the track is determined by the standard CMS track reconstruction [42] or the Gaussian Sum Filter algo-rithm [43]. A third method is based on the difference in azimuthal angle (φ) between the ECAL cluster center of gravity and pixel detector seeds used to reconstruct the electron track. Because the third method has been found to be unreliable at high pT, only the results from the first two
charge determination methods are required to agree for electrons with pT above 100 GeV.
Re-laxing the requirement on this method recovers 5–10% of signal efficiency, depending on the mass of the X5/3. For electrons with pT below 100 GeV, all three charge measurements are
required to agree.
Muons are reconstructed using a global track fit of hits in the muon chambers and hits in the silicon tracker. The identification criteria are based on the number of hits used in the fit, the track quality, and the distance of the track to the primary vertex. For the same-sign dilepton final state in the dimuon channel, the two muons should not be both within|η| > 1.2, unless
they are in opposite sides of the detector in η or are well separated in φ (∆φ> 1.25 rad.). This last requirement is imposed because of a misconfiguration of part of the trigger system, in the first part of the data-taking period, affecting nearby muons in the endcap detectors and has no effect on signal efficiency.
We select charged leptons that are isolated from other activity in the detector. The isolation variable (I) for both electrons and muons is defined as the scalar pT sum of all PF candidates
5
isolation cone (R) is defined as:
R = 10 GeV
min(max(pT, 50 GeV), 200 GeV)
, (1)
where the lepton pT is measured in GeV. Corrections are applied to the computation of the
lepton isolation in order to account for the effect of pileup using the effective area method [44]. Two categories of leptons are defined, a “tight” lepton, which has I < 0.1 and also passes the relevant identification criteria above, and a “loose” lepton, which has I < 0.4. In addition, the definition of “loose” electrons includes a relaxed requirement on the MVA discriminant, and “loose” muons have relaxed requirements on several of the aforementioned identification re-quirements. The signal efficiencies for “tight” and “loose” electrons (muons) are≈88% (≈97%) and≈95% (≈100%) for|η| <2.5 (2.4), respectively, excluding the barrel-endcap transition
re-gion (1.44< |η| <1.57) for electrons.
Data-to-simulation scale factors to correct for imperfect detector simulation are obtained using the “tag-and-probe” method [45] for lepton trigger, identification, and isolation, as functions of the lepton pTand η.
Jets are clustered from the reconstructed PF candidates using the anti-kTalgorithm [39]
imple-mented in the FASTJETpackage [40, 44, 46] with a distance parameter of 0.4 (AK4) and are re-quired to satisfy pT >30 GeV and|η| <2.4. Additional selection criteria are applied to remove
spurious energy deposits originating from isolated noise patterns in certain HCAL regions and from anomalous signals caused by particles depositing energy in the silicon avalanche pho-todiodes used in the ECAL barrel region [47]. Jets that overlap with leptons have the four-momentum of any shared lepton subtracted from the jet four-four-momentum. Jet energy correc-tions are applied for residual nonuniformity, nonlinearity of the detector response, and the level of pileup in the event [48, 49].
In the single-lepton final state analysis, jets are tagged as originating from the decay of a bottom quark using a combined secondary vertex (CSVv2) algorithm [50], which classifies jets based on the distance between their vertex and the primary vertex, along with observables such as track impact parameter. At the working point chosen, the efficiency for correctly tagging jets from bottom quark decays is between 40–65%, depending on the jet pT. The efficiency of
tag-ging charm hadron jets is approximately 12%, averaged over jet pT, while the probability of
mistagging light-flavor jets is roughly 1%.
Large-radius jets are also reconstructed using the anti-kTalgorithm, with a distance parameter
of 0.8 (AK8), and are used to tag hadronic decays of Lorentz-boosted top quarks or W bosons in the single-lepton final state analysis. Two variables are used to classify AK8 jets as originating from merged top quark decays (t tagging): the jet mass after grooming with the soft-drop algorithm [51] and the ratio of N-subjettiness variables τ3/τ2 [52], a variable that provides
strong discrimination between AK8 jets with two and three subjets. For an AK8 jet to be labeled as t tagged, it must have pT >400 GeV, soft-drop mass between 105 and 220 GeV, and the ratio
τ3/τ2less than 0.81. This set of t tagging requirements yields an efficiency of roughly 60% and a
mistag rate of roughly 3% for the pTrange considered. Data-to-simulation scale factors [47] are
applied to events containing t-tagged jets in order to match the performance in the simulation to that seen in data.
If an AK8 jet fails the top quark identification criteria, it is considered for classification as a merged hadronic W boson decay (W tagging). An AK8 jet is labeled as W tagged if it has pT > 200 GeV, pruned mass between 65 and 105 GeV, and a ratio of N-subjettiness variables
and wide-angle radiated partons [53]. This set of requirements used to select W-tagged jets yields a signal efficiency of 60–80% and a mistag rate of 20–5%, depending on the pT of the
AK8 jet. The pruned mass scale is found to be consistent between data and simulation, but the mass resolution is found to be better in simulation and hence it is smeared in simulated events to match the resolution seen in data. Data-to-simulation scale factors [47] are also applied in order to match the performance of the W tagging in simulation to that seen in data.
The missing transverse momentum (~pTmiss) is defined as the negative of the vector pT sum of
all reconstructed PF candidates in an event and its magnitude is denoted as pmissT . Energy scale corrections applied to jets are also propagated to pmissT .
6
Same-sign dilepton final state
The search in the sign dilepton final state takes advantage of the rare signature of same-sign leptons, as well as the same-significant number of other high-pTleptons and jets from the decay
of the other X5/3particle in the event.
The background contributions associated with this channel fall into three main categories: same-sign prompt leptons (SSP), opposite-sign prompt leptons (ChargeMisID), and same-sign nonprompt dilepton (Nonprompt). The SSP background consists of SM processes that give prompt, same-sign dilepton signatures, where a prompt lepton is defined as one originating from the direct decay of either a W or Z boson. The contribution of these processes to the sig-nal region is estimated using simulation. The ChargeMisID background is composed of events that contain two opposite-sign leptons, but have the charge of one lepton mismeasured. This contribution is estimated from data. The Nonprompt background consists of events that con-tain at least one nonprompt lepton passing the lepton selection criteria. Such events arise from jets misidentified as leptons, nonprompt leptons from heavy-flavor decays or conversions in the detector material, etc. This contribution is also estimated using control samples in data. We first require two same-sign leptons that pass the tight definition given in Section 5. The same-sign lepton pair that maximizes the scalar pTsum of its constituents is taken as the signal
pair. Because the same-sign dilepton final state sample was collected in two different triggering eras, different pTrequirements are placed on the pair according to the triggering era in order to
ensure that the trigger has reached full efficiency. For the early (late) triggering era, the leading lepton is required to have pT > 40 (40) GeV while the subleading lepton is required to have
pT >35 (30) GeV.
A set of preselection requirements is defined as follows. First, the invariant mass of the same-sign lepton pair is required to be greater than 20 GeV (quarkonia veto) and the event is required to contain at least two AK4 jets passing the requirements outlined above. Second, events con-taining a Z boson are removed by vetoing any event with an opposite-sign, same-flavor pair of leptons having an invariant mass within 15 GeV of the mass of the Z boson. For the dielectron channel, this requirement is extended to the pair of same-sign electrons as well, in order to veto ChargeMisID background events. This eliminates the majority of Drell–Yan (DY) events, which would otherwise be a major contributor to the ChargeMisID background, without ad-versely affecting our signal efficiency.
After the preselection, two analysis-specific variables are defined as follows. The number of constituents (Nconst) is the number of AK4 jets in the event together with the number of
addi-tional (i.e. not in the same-sign pair) leptons passing the tight definition. The HTlepvariable is the scalar pTsum of all constituents including the same-sign pair.
6.1 Background modeling 7
The criteria on these two variables are optimized for expected signal significance and the final requirements are Nconst≥5 and HTlep > 1200 GeV. Figure 2 shows the HTlepdistributions at the
preselection level; the distributions of the Nconstvariable (not shown) were also confirmed to
be well described.
6.1 Background modeling
In this section, we summarize the background modeling used in the same-sign dilepton search. The estimated contribution for all backgrounds is presented in Table 1. For additional details see Ref. [8].
6.1.1 Same-sign prompt lepton background
The SSP background consists of processes with multiple W or Z bosons decaying to leptons, the bosons themselves either being created directly or through the decay of a top quark. The contributions from these processes are estimated using the simulation as described in Section 3. The systematic uncertainties included for the SSP background are discussed in Section 8.
6.1.2 Opposite-sign prompt lepton background
Background events in the ChargeMisID category arise from a pair of opposite-sign prompt leptons where the charge of one lepton is mismeasured, yielding a pair of same-sign leptons. The charge misidentification probability for muons is much smaller and hence is considered negligible [54]. For electrons, the probability of charge misidentification is measured using observed DY events by requiring a pair of electrons with an invariant mass (driven by ECAL information) between 81 and 111 GeV. The charge misidentification probability is binned by
|η|of the electron, and split into three different pT regions: below 100 GeV, between 100 and
200 GeV, and above 200 GeV. These regions capture the effects of the differences in charge consistency requirements for low- and high-pT electrons, as well as any remaining inherent
dependence of the charge misidentification probability on the electron pT. Values of the charge
misidentification probability range from 10−4 for low-pT electrons in the central part of the
detector to a few percent for high-pT electrons in the forward region of the detector.
To estimate the contribution of the ChargeMisID background, opposite-sign dilepton events that satisfy all signal region kinematic requirements are weighted by the relevant probability of charge misidentification according to the kinematics of the electron(s) in the opposite-sign pair.
To account for the differences seen in the overall charge misidentification rate between DY and tt events in simulation (roughly 25% higher in DY), and some small residual kinematic disagreements (pTdependent variation of roughly 5% or less), a 30% systematic uncertainty is
assigned to the estimate of the number of ChargeMisID background events.
6.1.3 Same-sign nonprompt background
The Nonprompt background arises from events where a nonprompt lepton (such as a lepton from a heavy-flavor decay, photon conversion, or a misidentified jet) passes the tight lepton identification requirements. Contributions from these types of events are estimated using the “Tight-Loose” method as described in Ref. [55]. This method relies on collecting a sample of dilepton events where the leptons are allowed to pass the loose definition described previously, and then scaling those events by weights involving the probability of a loose prompt lepton to pass the tight definition (“prompt rate”) and the probability of a loose nonprompt lepton to pass the tight definition (“misidentification rate”).
[GeV] lep T H 0 500 1000 1500 2000 2500 3000 Events / 120 GeV 2 − 10 1 − 10 1 10 2 10 3 10 4 10 Data NonPrompt ChargeMisID + X t t Di/tri-boson Bkg uncertainty LH (1 TeV) 5/3 X 5/3 X RH (1 TeV) 5/3 X 5/3 X CMS (13 TeV) -1 35.9 fb ee [GeV] lep T H 0 500 1000 1500 2000 2500 3000 uncertainty (obs-bkg) 2 − 0 2 HlepT [GeV] 0 500 1000 1500 2000 2500 3000 Events / 120 GeV 2 − 10 1 − 10 1 10 2 10 3 10 4 10 Data NonPrompt + X t t Di/tri-boson Bkg uncertainty LH (1 TeV) 5/3 X 5/3 X RH (1 TeV) 5/3 X 5/3 X CMS (13 TeV) -1 35.9 fb µ µ [GeV] lep T H 0 500 1000 1500 2000 2500 3000 uncertainty (obs-bkg) 2 − 0 2 [GeV] lep T H 0 500 1000 1500 2000 2500 3000 Events / 120 GeV 2 − 10 1 − 10 1 10 2 10 3 10 4 10 Data NonPrompt ChargeMisID + X t t Di/tri-boson Bkg uncertainty LH (1 TeV) 5/3 X 5/3 X RH (1 TeV) 5/3 X 5/3 X CMS (13 TeV) -1 35.9 fb µ e [GeV] lep T H 0 500 1000 1500 2000 2500 3000 uncertainty (obs-bkg) 2 − 0 2 HlepT [GeV] 0 500 1000 1500 2000 2500 3000 Events / 120 GeV 2 − 10 1 − 10 1 10 2 10 3 10 4 10 DataNonPrompt ChargeMisID + X t t Di/tri-boson Bkg uncertainty LH (1 TeV) 5/3 X 5/3 X RH (1 TeV) 5/3 X 5/3 X CMS (13 TeV) -1 35.9 fb µ µ + µ ee + e [GeV] lep T H 0 500 1000 1500 2000 2500 3000 uncertainty (obs-bkg) 2 − 0 2
Figure 2: The HTlepdistributions after the same-sign dilepton requirement, Z boson and quarko-nia lepton invariant mass vetoes, and the requirement of at least two AK4 jets in the event, for dielectron (upper left), dimuon (upper right), electron-muon (lower left) final states, and their combination (lower right). The hatched area shows the combined systematic and statistical uncertainty in the background prediction for each bin. The last bin includes overflow events. The lower panel in each plot shows the difference between the observed and the predicted numbers of events divided by the total uncertainty. The total uncertainty is calculated as the sum in quadrature of the statistical uncertainty in the observed measurement and the uncer-tainty in the background, including both statistical and systematic components. Also shown are the expected signal distributions for a 1 TeV X5/3with LH (solid line) and RH (dashed line)
6.2 Event yields 9
The prompt rate is determined using the “tag-and-probe” technique with DY-enriched dilepton data where the invariant mass of the leptons is within 10 GeV of the Z boson mass. For muons, the prompt rate is found to be flat to within a few percent as functions of η and pT and hence
the average of 0.94 is taken. The prompt rate for electrons is found to be flat versus η, but has a pT dependence, which is taken into account and gives values for the prompt rate ranging from
0.80 to 0.95.
The misidentification rate is determined using a sample enriched in QCD multijet events. The selection of this sample follows the approach described in Ref. [8] and requires exactly one loose lepton, at least one jet, low pmissT , and low MT, where MT is the transverse mass of the
lepton and pmissT . We also reject events if the invariant mass of the lepton and any jet is within 10 GeV of the Z boson mass.
Because of the significantly larger integrated luminosity used in this analysis, binning of the variation in the misidentification rate as a function of lepton η is possible; the values obtained range from 0.16 to 0.25 (0.34) for electrons (muons), with the lower values corresponding to leptons in the central part of the detector.
The uncertainty in the estimation of the Nonprompt background is derived by comparing the variation between the misidentification rates measured from different types of nonprompt lep-ton candidates, categorized by the generator-level origin of the nonprompt leplep-ton; the varia-tion in kinematic dependence of these misidentificavaria-tion rates with respect to pTand η; and the
overall level of closure seen in the method. The above checks are all performed using tt MC events. To ensure that all effects are covered, a 50% uncertainty is assigned to the estimate of the Nonprompt background.
6.2 Event yields
Summing over the three dilepton final states, between 1.8 (2.4) and 3.4 (4.1)% of the produced X5/3 pairs are expected to pass the full selection criteria for an LH (RH) signal, depending on the X5/3mass. The number of observed events, along with the expected number of background
events broken down by category, is shown in Table 1. The background predictions in the table are derived after a “background-only” fit to the data as described in Section 9, where the signal strength is assumed to be zero. The fit increases the predicted Nonprompt background by less than its originally assigned uncertainty, and reduces the uncertainty associated with this background by about 30%. Also shown is the number of expected signal events for an RH X5/3
with mass 1 TeV. The observed number of events in the signal region categories are compatible with the background predictions.
Table 1: Summary of yields from simulated prompt same-sign dilepton (SSP MC), same-sign nonprompt (Nonprompt), and opposite-sign prompt (ChargeMisID) backgrounds after the full analysis selection. Also shown are the number of expected events for an RH X5/3 particle with
a mass of 1 TeV. The uncertainties include both statistical and all systematic components (as described in Section 8). The number of events and uncertainties correspond to the background-only fit to data for the background, while for the signal they are based on the yields before the fit to data.
Channel RH X5/3(1 TeV) SSP MC Nonprompt ChargeMisID Total bkg. Data
Dielectron 11.6±0.8 3.9±0.3 4.6±1.7 2.4±0.7 10.9±1.9 10
Dimuon 16.1±1.2 5.7±0.5 5.5±1.9 — 11.2±2.0 12
7
Single-lepton final state
The single-lepton final state targets events where one of the four W bosons in the event decays leptonically and the others decay hadronically (including hadronic tau decays). Events are required to have exactly one tight lepton with pT >80 GeV. An event is discarded if it contains
another lepton that passes the loose identification criteria and has pT >10 GeV. In order to limit
the background contributions from QCD multijet events, selected events are required to have pmissT > 100 GeV and the AK4 jet that is closest to the lepton is either required to be separated by∆R>0.4, where∆R=
√
(∆η)2+ (∆φ)2, or the magnitude of the lepton momentum that is transverse to the jet axis is required to be greater than 40 GeV.
Since the signal topology includes significant levels of hadronic activity, events are also re-quired to have at least four AK4 jets, and the leading and subleading jets are rere-quired to have a pTgreater than 450 and 150 GeV, respectively. At least one of the four AK4 jets is required to
pass the b tagging requirement.
Two observables are found to provide strong discrimination between signal and background events as in Ref. [8]:∆R(`, j2), the angular separation between the lepton and subleading AK4
jet, and min[M(`, b)], the minimum mass reconstructed using the lepton and any AK4 jet in the event passing the b tagging requirement. Signal regions for this search are constructed from events with∆R(`, j2) > 1.0, with the distribution of min[M(`, b)] used for signal extraction.
Figure 3 shows the distributions for ∆R(`, j2) and min[M(`, b)] in events with at least three
AK4 jets, including a leading (subleading) jet with pT > 250 (150) GeV prior to the fit to data.
The distribution of min[M(`, b)]for the background, dominated by tt events, features a sharp drop around 150 GeV, since, for such events, this variable represents the visible mass of the top quark in the detector. The∆R(`, j2)variable shows that the subleading jets populate both the
same and opposite hemisphere relative to the lepton in the background events, whereas in the X5/3 signal events, the subleading jet is usually opposite to the lepton.
7.1 Background modeling
All of the background processes in the single-lepton analysis are modeled using the simula-tion. In order to confirm that this modeling is correct, the agreement between simulation and data is checked for the dominant (tt) and subdominant (W+jets) background processes using background-enriched control regions. The control regions have the same conditions as the sig-nal region, with the requirement on ∆R(`, j2) inverted such that 0.4 < ∆R(`, j2) < 1.0. The
W+jets enriched control region also requires that no jet passes the b tagging requirements, and is split into categories of either zero or at least one W-tagged jet. The tt enriched control region uses the b tagging requirements of the signal region and is split into either 1 or≥2 b-tagged jet categories. With the lack of b-tagged jets in the W+jets control region, the reconstructed mass of interest is modified to be the minimum mass of the lepton and any AK4 jet in the event (min[M(`, j)]).
The agreement between the data and the SM prediction from simulation is checked in all con-trol region categories and is found to be within the uncertainties in the prediction, which are detailed in Section 8. Figure 4 shows the distributions of min[M(`, b)] and min[M(`, j)]for the tt and W+jets enriched control regions, while Table 2 shows the predicted and observed numbers of events in each control region after the full analysis selection. The background pre-dictions in Fig. 4 and Table 2 are given after the background-only fit to data using all categories in both final states, including both signal and control regions.
7.1 Background modeling 11 Events / 20 GeV1000 2000 3000 4000 5000 +jets µ e/ 3 j ≥ 1 b, ≥ Data QCD EWK TOP Bkg uncertainty LH (0.9 TeV)x120 5/3 X 5/3 X RH (1.2 TeV)x120 5/3 X 5/3 X (13 TeV) -1 35.9 fb CMS min[M(l,b)] [GeV] 0 200 400 600 800 1000 uncertainty (obs-bkg) −2 0 2 Events / bin 200 400 600 800 1000 1200 1400 1600 1800 2000 +jets µ e/ 3 j ≥ 1 b, ≥ Data X5/3X5/3 LH (0.9 TeV)x70 QCD X5/3X5/3 RH (1.2 TeV)x70 EWK Bkg uncertainty TOP (13 TeV) -1 35.9 fb CMS ) 2 R(l,j ∆ 0 1 2 3 4 5 uncertainty (obs-bkg) −2 0 2
Figure 3: Distributions of min[M(`, b)] (left) and∆R(`, j2) (right) in data and simulation for
events with at least three AK4 jets, including a leading (subleading) jet with pT>250 (150) GeV,
after combining the electron and muon channels. Example signal distributions are also shown, scaled by a factor of 120 (70) in the min[M(`, b)] (∆R(`, j2)) distribution. The last bin includes
overflow events. The lower panel in each plot shows the difference between the observed and the predicted numbers of events in that bin divided by the total uncertainty. The total uncertainty is calculated as the sum in quadrature of the statistical uncertainty in the observed measurement and the statistical and systematic uncertainties in the background.
Table 2: Expected (observed) numbers of background (data) events passing the final selection requirements, in the tt and W+jets control region (0.4< ∆R(`, j2) <1.0) categories, after
com-bining the single-electron and single-muon channels. The numbers of events expected from two example signals are also shown. The event yields and their uncertainties correspond to the background-only fit to data for the background, while for the signal they are based on the values before the fit to data.
Sample ≥0 t,≥0 W, 1 b ≥0 t,≥0 W,≥2 b ≥0 t, 0 W, 0 b ≥0 t,≥1 W, 0 b LH X5/3(0.9 TeV) 13.15±0.61 10.90±0.58 1.46±0.27 3.60±0.36 RH X5/3(1.2 TeV) 3.02±0.13 2.34±0.12 0.32±0.06 1.00±0.08 TOP 953±97 668±72 274±30 134±14 EWK 200±16 29.5±3.1 789±57 204±15 QCD 12.9±5.4 1.05±0.55 14.5±4.6 7.2±3.9 Total bkg. 1170±100 699±72 1077±70 345±23 Data 1152 710 1062 335
< Events / GeV > 3 − 10 2 − 10 1 − 10 1 10 2 10 3 10 4 10 +jets µ e/ 4 j ≥ 1 b, Data X5/3X5/3 LH (0.9 TeV) QCD X5/3X5/3 RH (1.2 TeV) EWK Bkg uncertainty TOP (13 TeV) -1 35.9 fb CMS min[M(l,b)] [GeV] 0 200 400 600 800 1000 uncertainty (obs-bkg) −2 0 2 < Events / GeV > 3 − 10 2 − 10 1 − 10 1 10 2 10 e/µ+jets 4 j ≥ 2 b, ≥ Data X5/3X5/3 LH (0.9 TeV) EWK X5/3X5/3 RH (1.2 TeV) TOP Bkg uncertainty (13 TeV) -1 35.9 fb CMS min[M(l,b)] [GeV] 0 200 400 600 800 1000 uncertainty (obs-bkg) −2 0 2 b [GeV] ≠ min[M(l,j)], j < Events / GeV > 4 − 10 3 − 10 2 − 10 1 − 10 1 10 2 10 3 10 +jets µ e/ 0 W 4 j ≥ 0 b, Data X5/3X5/3 LH (0.9 TeV) QCD X5/3X5/3 RH (1.2 TeV) EWK Bkg uncertainty TOP (13 TeV) -1 35.9 fb CMS b [GeV] ≠ min[M(l,j)], j 0 200 400 600 800 1000 uncertainty (obs-bkg) −2 0 2 min[M(l,j)], j≠b [GeV] < Events / GeV > 4 − 10 3 − 10 2 − 10 1 − 10 1 10 2 10 +jets µ e/ 1 W ≥ 4 j ≥ 0 b, Data X5/3X5/3 LH (0.9 TeV) QCD X5/3X5/3 RH (1.2 TeV) EWK Bkg uncertainty TOP (13 TeV) -1 35.9 fb CMS b [GeV] ≠ min[M(l,j)], j 0 200 400 600 800 1000 uncertainty (obs-bkg) −2 0 2
Figure 4: Distributions of min[M(`, b)]in the tt control region, for 1 b-tagged jet (upper left) and≥2 b-tagged jets (upper right) categories, and of min[M(`, j)]in the W+jets control region, for 0 W-tagged jets (lower left) and≥1 W-tagged jets (lower right) categories. Example signal distributions are also shown. The background distributions correspond to background-only fit to data while signal distributions are before the fit to data. Electron and muon event samples are combined. The last bin includes overflow events and its content is divided by the bin width. The distributions in each category have variable-size bins, chosen so that the statistical uncertainty in the total background in each bin is less than 30%. The lower panel in each plot shows the difference between the observed and the predicted numbers of events in that bin divided by the total uncertainty. The total uncertainty is calculated as the sum in quadrature of the statistical uncertainty in the observed measurement and the statistical and systematic uncertainties in the background-only fit to data.
7.2 Event yields and template distributions 13
7.2 Event yields and template distributions
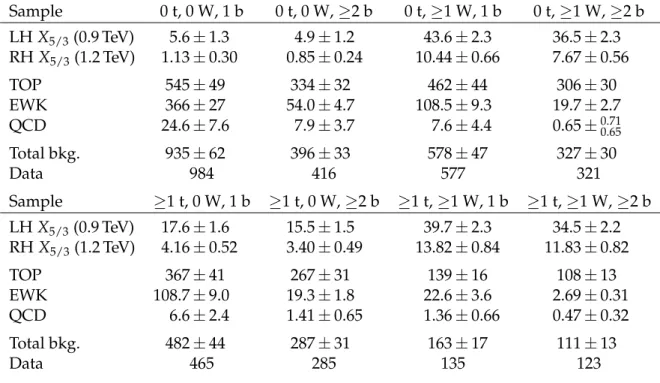
In the single-lepton signal region, the LH (RH) signal efficiencies range between 4.1 (5.0) and 13.1 (14.7)%. Events in the signal region are separated into 16 categories based on the flavor of the lepton (e, µ), the number of b-tagged jets (1,≥2), the number of W-tagged jets (0,≥1), and the number of t-tagged jets (0,≥1). Event yields for each analysis category are given in Table 3 after a background-only fit to data with the contribution from the electron and muon channels combined. Figure 5 shows the distribution for min[M(`, b)]for events with zero t-tagged jets, while Fig. 6 shows the min[M(`, b)]distribution for events with at least one t-tagged jet, both of which are shown after a background-only fit to data. The distributions are separated for each analysis category, but again the electron and muon channels are combined. No significant discrepancy is seen between the observed and predicted min[M(`, b)]distributions.
Table 3: Expected (observed) numbers of background (data) events passing the final selec-tion requirements, in the signal region (∆R(`, j2) >1.0) categories, after combining the
single-electron and single-muon channels. The numbers of events expected from two example signals are also shown. The event yields and their uncertainties correspond to the background-only fit to data for the background, while for the signal they are based on the values before the fit to data. Sample 0 t, 0 W, 1 b 0 t, 0 W,≥2 b 0 t,≥1 W, 1 b 0 t,≥1 W,≥2 b LH X5/3(0.9 TeV) 5.6±1.3 4.9±1.2 43.6±2.3 36.5±2.3 RH X5/3(1.2 TeV) 1.13±0.30 0.85±0.24 10.44±0.66 7.67±0.56 TOP 545±49 334±32 462±44 306±30 EWK 366±27 54.0±4.7 108.5±9.3 19.7±2.7 QCD 24.6±7.6 7.9±3.7 7.6±4.4 0.65±0.71 0.65 Total bkg. 935±62 396±33 578±47 327±30 Data 984 416 577 321 Sample ≥1 t, 0 W, 1 b ≥1 t, 0 W,≥2 b ≥1 t,≥1 W, 1 b ≥1 t,≥1 W,≥2 b LH X5/3(0.9 TeV) 17.6±1.6 15.5±1.5 39.7±2.3 34.5±2.2 RH X5/3(1.2 TeV) 4.16±0.52 3.40±0.49 13.82±0.84 11.83±0.82 TOP 367±41 267±31 139±16 108±13 EWK 108.7±9.0 19.3±1.8 22.6±3.6 2.69±0.31 QCD 6.6±2.4 1.41±0.65 1.36±0.66 0.47±0.32 Total bkg. 482±44 287±31 163±17 111±13 Data 465 285 135 123
8
Systematic uncertainties
The uncertainties in the lepton reconstruction, identification, and isolation efficiencies are de-rived from the uncertainties in the data-to-simulation scale factors and range from 1 to 3%. These uncertainties are applied per lepton. A 2.5% uncertainty is assigned to the integrated luminosity measurement [56] used to scale the simulated signal and background processes. The above uncertainties only affect the normalization of the simulated processes and not their shape.
Both final states have uncertainties in their simulation-based predictions from the uncertainties in the lepton triggering efficiency, the jet energy scale (JES), the jet energy resolution (JER), the pileup modeling, the cross section normalization, and the choice of PDFs. For the same-sign
< Events / GeV > 3 − 10 2 − 10 1 − 10 1 10 2 10 3 10 +jets µ e/ 0 t, 0 W 4 j ≥ 1 b, Data X5/3X5/3 LH (0.9 TeV) QCD X5/3X5/3 RH (1.2 TeV) EWK Bkg uncertainty TOP (13 TeV) -1 35.9 fb CMS min[M(l,b)] [GeV] 0 200 400 600 800 1000 uncertainty (obs-bkg) −2 0 2 < Events / GeV > 3 − 10 2 − 10 1 − 10 1 10 2 10 e/µ+jets 0 t, 0 W 4 j ≥ 2 b, ≥ Data X5/3X5/3 LH (0.9 TeV) QCD X5/3X5/3 RH (1.2 TeV) EWK Bkg uncertainty TOP (13 TeV) -1 35.9 fb CMS min[M(l,b)] [GeV] 0 200 400 600 800 1000 uncertainty (obs-bkg) −2 0 2 < Events / GeV > 3 − 10 2 − 10 1 − 10 1 10 2 10 3 10 +jets µ e/ 1 W ≥ 0 t, 4 j ≥ 1 b, Data X5/3X5/3 LH (0.9 TeV) QCD X5/3X5/3 RH (1.2 TeV) EWK Bkg uncertainty TOP (13 TeV) -1 35.9 fb CMS min[M(l,b)] [GeV] 0 200 400 600 800 1000 uncertainty (obs-bkg) −2 0 2 < Events / GeV > 3 − 10 2 − 10 1 − 10 1 10 2 10 e/µ+jets 1 W ≥ 0 t, 4 j ≥ 2 b, ≥ Data X5/3X5/3 LH (0.9 TeV) EWK X5/3X5/3 RH (1.2 TeV) TOP Bkg uncertainty (13 TeV) -1 35.9 fb CMS min[M(l,b)] [GeV] 0 200 400 600 800 1000 uncertainty (obs-bkg) −2 0 2
Figure 5: Distributions of min[M(`, b)]in events with 0 t-tagged jets, 0 (upper) or≥1 (lower) W-tagged jets, and 1 (left) or ≥2 (right) b-tagged jets for the combined electron and muon samples in the signal region. Example signal distributions are also shown. The background distributions correspond to the background-only fit to data, while signal distributions are be-fore the fit to data. The last bin includes overflow events and its content is divided by the bin width. The distributions in each category have variable-size bins, chosen so that the statistical uncertainty in the total background in each bin is less than 30%. The lower panel in each plot shows the difference between the observed and the predicted numbers of events in that bin divided by the total uncertainty. The total uncertainty is calculated as the sum in quadrature of the statistical uncertainty in the observed measurement and the statistical and systematic uncertainties in the background-only fit to data.
15 < Events / GeV > 3 − 10 2 − 10 1 − 10 1 10 2 10 3 10 +jets µ e/ 1 t, 0 W ≥ 4 j ≥ 1 b, Data X5/3X5/3 LH (0.9 TeV) QCD X5/3X5/3 RH (1.2 TeV) EWK Bkg uncertainty TOP (13 TeV) -1 35.9 fb CMS min[M(l,b)] [GeV] 0 200 400 600 800 1000 uncertainty (obs-bkg) −2 0 2 < Events / GeV > 3 − 10 2 − 10 1 − 10 1 10 2 10 +jets µ e/ 1 t, 0 W ≥ 4 j ≥ 2 b, ≥ Data X5/3X5/3 LH (0.9 TeV) EWK X5/3X5/3 RH (1.2 TeV) TOP Bkg uncertainty (13 TeV) -1 35.9 fb CMS min[M(l,b)] [GeV] 0 200 400 600 800 1000 uncertainty (obs-bkg) −2 0 2 < Events / GeV > 3 − 10 2 − 10 1 − 10 1 10 2 10 3 10 +jets µ e/ 1 W ≥ 1 t, ≥ 4 j ≥ 1 b, Data X5/3X5/3 LH (0.9 TeV) QCD X5/3X5/3 RH (1.2 TeV) EWK Bkg uncertainty TOP (13 TeV) -1 35.9 fb CMS min[M(l,b)] [GeV] 0 200 400 600 800 1000 uncertainty (obs-bkg) −2 0 2 < Events / GeV > −3 10 2 − 10 1 − 10 1 10 2 10 +jets µ e/ 1 W ≥ 1 t, ≥ 4 j ≥ 2 b, ≥ Data X5/3X5/3 LH (0.9 TeV) EWK X5/3X5/3 RH (1.2 TeV) TOP Bkg uncertainty (13 TeV) -1 35.9 fb CMS min[M(l,b)] [GeV] 0 200 400 600 800 1000 uncertainty (obs-bkg) −2 0 2
Figure 6: Distributions of min[M(`, b)]in events with≥1 t-tagged jets, 0 (upper) or≥1 (lower) W-tagged jets, and 1 (left) or ≥2 (right) b-tagged jets for the combined electron and muon samples in the signal region. Example signal distributions are also shown. The background distributions correspond to the background-only fit to data, while signal distributions are be-fore the fit to data. The last bin includes overflow events and its content is divided by the bin width. The distributions in each category have variable-size bins, chosen so that the statistical uncertainty in the total background in each bin is less than 30%. The lower panel in each plot shows the difference between the observed and the predicted numbers of events in that bin divided by the total uncertainty. The total uncertainty is calculated as the sum in quadrature of the statistical uncertainty in the observed measurement and the statistical and systematic uncertainties in the background-only fit to data.
dilepton final state, the uncertainty in the lepton triggering efficiency is 3% while for the single-lepton final state it ranges between 2 and 5%. In both final states, this uncertainty is applied per event. The JES and JER uncertainties are estimated by varying the relevant parameters up and down by one standard deviation (s.d.) and repeating the analysis selections. The pileup uncertainty is assessed by varying the total inelastic cross section (σinel.) used in the pileup
reweighting by±4.6% [57]. The uncertainty in the theoretical cross section from renormaliza-tion and factorizarenormaliza-tion energy scales is estimated by independently varying the scales up and down by a factor of two and taking the maximum variation as the uncertainty. The uncertainty associated with the PDFs used for the MC generation is evaluated from the set of NNPDF3.0 fitted replicas, following the standard procedure [32].
The single-lepton final state considers the shape variations in the signal distributions that come from varying the renormalization and factorization scales and the choice of PDF set. For the same-sign dilepton final state, only their effect on the signal acceptance is considered, since a “cut-and-count” analysis is used in this case. The normalization changes due to the variations in the signal acceptance are found to be negligible in the single-lepton final state. The details of the systematic uncertainties are shown in Table 4 for the same-sign dilepton final state and in Table 5 for the single-lepton final state.
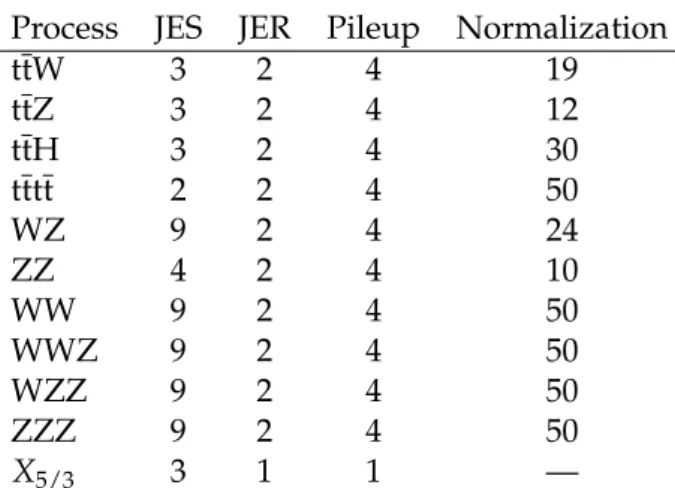
Table 4: Systematic uncertainties in percentage (%) in the same-sign dilepton final state, asso-ciated with the simulated processes. The “Normalization” column refers to the uncertainties from the cross section normalization and the choice of PDF set.
Process JES JER Pileup Normalization
ttW 3 2 4 19 ttZ 3 2 4 12 ttH 3 2 4 30 tttt 2 2 4 50 WZ 9 2 4 24 ZZ 4 2 4 10 WW 9 2 4 50 WWZ 9 2 4 50 WZZ 9 2 4 50 ZZZ 9 2 4 50 X5/3 3 1 1 —
In the single-lepton final state, uncertainties are also applied for the corrections on the b tag-ging, light quark mistagtag-ging, W tagtag-ging, and t tagging scale factors. The W tagging uncertain-ties have different components, which are treated as uncorrelated: corrections to the groomed mass scale and smearing, τ2/τ1selection efficiency, and its pT dependence. For the top quark
pTreweighting, the difference between the weighted and unweighted distributions is added as
a one-sided systematic uncertainty.
Lastly, in the same-sign dilepton final state, there are uncertainties in the predictions of back-ground processes whose estimates are made using control samples in data. As stated above, a 30% uncertainty is assigned to the predicted yield of background events from charge misiden-tification, and a 50% uncertainty is assigned to the predicted yield of background events from processes with nonprompt leptons.
Systematic uncertainties that have the same source for the two different final states (e.g. the uncertainty in the lepton identification) are treated as fully correlated between the two final states.
17
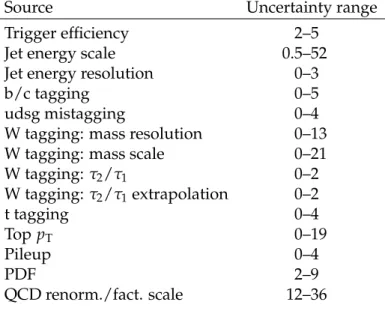
Table 5: Summary of systematic uncertainties in the single-lepton final state. These uncertain-ties are included in both signal and all background processes, except for the top pTsystematic
uncertainty, which is included only in tt. The range of uncertainty values in percentage (%) corresponds to the effect on the yields before the fit to data and is given across the relevant background processes and channels for each systematic uncertainty.
Source Uncertainty range
Trigger efficiency 2–5
Jet energy scale 0.5–52
Jet energy resolution 0–3
b/c tagging 0–5
udsg mistagging 0–4
W tagging: mass resolution 0–13
W tagging: mass scale 0–21
W tagging: τ2/τ1 0–2 W tagging: τ2/τ1extrapolation 0–2 t tagging 0–4 Top pT 0–19 Pileup 0–4 PDF 2–9 QCD renorm./fact. scale 12–36
9
Results
No significant excess of events is observed above the SM prediction. Upper limits at 95% CL are set on the production cross sections pp→X5/3X5/3for both couplings and for the different
final states, as well as for their combination. Bayesian statistics [58, 59] are used to calculate observed and expected limits with a flat prior taken for the signal cross section. The same-sign dilepton final state limits are based on a counting experiment, while in the single-lepton final state, a binned likelihood fit on the distributions of min[M(`, b)]is performed simultaneously in the signal and control regions. Systematic uncertainties are treated as nuisance parameters with normalization uncertainties having a log-normal prior and shape uncertainties a Gaussian prior. The fit does not change any nuisance parameter by a significant amount compared to its pre-fit value. After the full analysis selection described above, lower observed (expected) limits of 1.16 (1.20) and 1.10 (1.16) TeV are placed on the mass of the X5/3 particle with RH and LH couplings to W bosons, respectively, using the same-sign dilepton final state. In the single-lepton final state, observed (expected) limits of 1.32 (1.23) and 1.30 (1.23) TeV are placed on the mass of the X5/3particle with RH and LH couplings to W bosons, respectively. Combining the
two final states yields a lower observed (expected) limit on the X5/3mass of 1.33 (1.30) TeV for
an X5/3 particle with RH couplings to W bosons and 1.30 (1.28) TeV for an X5/3 particle with
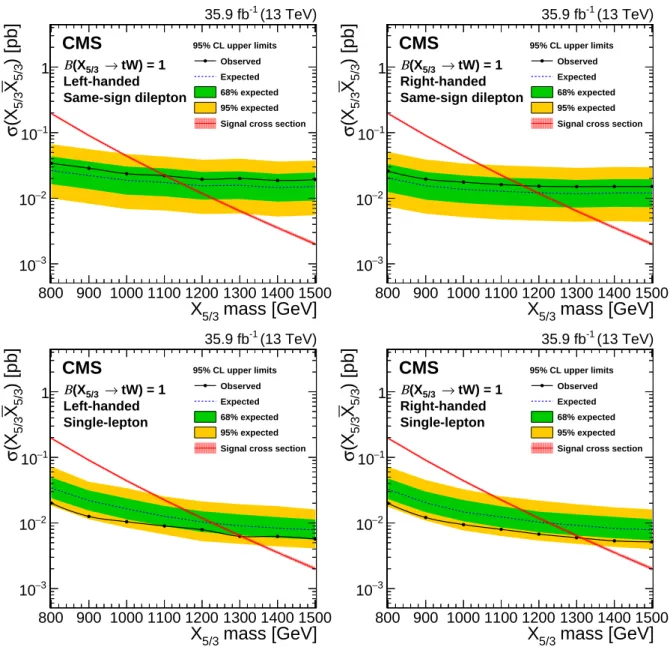
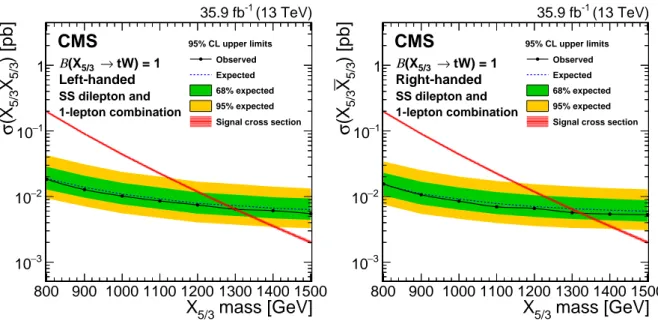
LH couplings to W bosons. Figure 7 shows the limits for the individual final states, while Fig. 8 shows the limits obtained by combining the two final states.
10
Summary
A search has been performed for a heavy top quark partner with an exotic 5/3 charge (X5/3)
using proton-proton collision data collected by the CMS experiment in 2016 at a center-of-mass energy of 13 TeV and corresponding to 35.9 fb−1. The X5/3 quark is assumed always to decay
into a top quark and a W boson. Two different final states, same-sign dilepton and single-lepton, are analyzed separately and then combined. No significant excess over the expected
mass [GeV]
5/3X
800 900 1000 1100 1200 1300 1400 1500) [pb]
5/3X
5/3X(
σ
3 − 10 2 − 10 1 − 10 1 (13 TeV) -1 35.9 fbCMS
95% CL upper limits Observed Expected 68% expected 95% expected Signal cross sectiontW) = 1 → 5/3 (X Β Left-handed Same-sign dilepton
mass [GeV]
5/3X
800 900 1000 1100 1200 1300 1400 1500) [pb]
5/3X
5/3X(
σ
3 − 10 2 − 10 1 − 10 1 (13 TeV) -1 35.9 fbCMS
95% CL upper limits Observed Expected 68% expected 95% expected Signal cross sectiontW) = 1 → 5/3 (X Β Right-handed Same-sign dilepton
mass [GeV]
5/3X
800 900 1000 1100 1200 1300 1400 1500) [pb]
5/3X
5/3X(
σ
3 − 10 2 − 10 1 − 10 1 (13 TeV) -1 35.9 fbCMS
95% CL upper limits Observed Expected 68% expected 95% expected Signal cross sectiontW) = 1 → 5/3 (X Β Left-handed Single-lepton
mass [GeV]
5/3X
800 900 1000 1100 1200 1300 1400 1500) [pb]
5/3X
5/3X(
σ
3 − 10 2 − 10 1 − 10 1 (13 TeV) -1 35.9 fbCMS
95% CL upper limits Observed Expected 68% expected 95% expected Signal cross sectiontW) = 1 → 5/3 (X Β Right-handed Single-lepton
Figure 7: Expected and observed limits at 95% CL for an LH (left) and RH (right) X5/3 after
combining all categories for the same-sign dilepton (upper row) and the single-lepton (lower row) final states. The theoretical uncertainty in the signal cross section is shown as a narrow band around the theoretical prediction.
19
mass [GeV]
5/3X
800 900 1000 1100 1200 1300 1400 1500) [pb]
5/3X
5/3X(
σ
3 − 10 2 − 10 1 − 10 1 (13 TeV) -1 35.9 fbCMS
95% CL upper limits Observed Expected 68% expected 95% expected Signal cross sectiontW) = 1 → 5/3 (X Β Left-handed SS dilepton and 1-lepton combination
mass [GeV]
5/3X
800 900 1000 1100 1200 1300 1400 1500) [pb]
5/3X
5/3X(
σ
3 − 10 2 − 10 1 − 10 1 (13 TeV) -1 35.9 fbCMS
95% CL upper limits Observed Expected 68% expected 95% expected Signal cross sectiontW) = 1 → 5/3 (X Β Right-handed SS dilepton and 1-lepton combination
Figure 8: Expected and observed limits at 95% CL for an LH (left) and RH (right) X5/3 after
combining the same-sign dilepton and single-lepton final states. The theoretical uncertainty in the signal cross section is shown as a narrow band around the theoretical prediction.
standard model backgrounds is seen in data. Lower limits are set on the mass of the X5/3
particle. The observed (expected) limit is 1.33 (1.30) TeV for an X5/3particle with right-handed
couplings to W bosons and 1.30 (1.28) TeV for an X5/3particle with left-handed couplings to W
bosons in a combination of the same-sign dilepton and single-lepton final states.
Acknowledgments
We congratulate our colleagues in the CERN accelerator departments for the excellent perfor-mance of the LHC and thank the technical and administrative staffs at CERN and at other CMS institutes for their contributions to the success of the CMS effort. In addition, we grate-fully acknowledge the computing centres and personnel of the Worldwide LHC Computing Grid for delivering so effectively the computing infrastructure essential to our analyses. Fi-nally, we acknowledge the enduring support for the construction and operation of the LHC and the CMS detector provided by the following funding agencies: BMWFW and FWF (Aus-tria); FNRS and FWO (Belgium); CNPq, CAPES, FAPERJ, and FAPESP (Brazil); MES (Bulgaria); CERN; CAS, MoST, and NSFC (China); COLCIENCIAS (Colombia); MSES and CSF (Croatia); RPF (Cyprus); SENESCYT (Ecuador); MoER, ERC IUT, and ERDF (Estonia); Academy of Fin-land, MEC, and HIP (Finland); CEA and CNRS/IN2P3 (France); BMBF, DFG, and HGF (Ger-many); GSRT (Greece); NKFIA (Hungary); DAE and DST (India); IPM (Iran); SFI (Ireland); INFN (Italy); MSIP and NRF (Republic of Korea); LAS (Lithuania); MOE and UM (Malaysia); BUAP, CINVESTAV, CONACYT, LNS, SEP, and UASLP-FAI (Mexico); MBIE (New Zealand); PAEC (Pakistan); MSHE and NSC (Poland); FCT (Portugal); JINR (Dubna); MON, RosAtom, RAS and RFBR (Russia); MESTD (Serbia); SEIDI, CPAN, PCTI and FEDER (Spain); Swiss Fund-ing Agencies (Switzerland); MST (Taipei); ThEPCenter, IPST, STAR, and NSTDA (Thailand); TUBITAK and TAEK (Turkey); NASU and SFFR (Ukraine); STFC (United Kingdom); DOE and NSF (USA).
Individuals have received support from the Marie-Curie programme and the European Re-search Council and Horizon 2020 Grant, contract No. 675440 (European Union); the Leventis
Foundation; the A. P. Sloan Foundation; the Alexander von Humboldt Foundation; the Belgian Federal Science Policy Office; the Fonds pour la Formation `a la Recherche dans l’Industrie et dans l’Agriculture (FRIA-Belgium); the Agentschap voor Innovatie door Wetenschap en Tech-nologie (IWT-Belgium); the F.R.S.-FNRS and FWO (Belgium) under the “Excellence of Science - EOS” - be.h project n. 30820817; the Ministry of Education, Youth and Sports (MEYS) of the Czech Republic; the Lend ¨ulet (“Momentum”) Programme and the J´anos Bolyai Research Schol-arship of the Hungarian Academy of Sciences, the New National Excellence Program ´UNKP, the NKFIA research grants 123842, 123959, 124845, 124850 and 125105 (Hungary); the Council of Science and Industrial Research, India; the HOMING PLUS programme of the Foundation for Polish Science, cofinanced from European Union, Regional Development Fund, the Mo-bility Plus programme of the Ministry of Science and Higher Education, the National Science Center (Poland), contracts Harmonia 2014/14/M/ST2/00428, Opus 2014/13/B/ST2/02543, 2014/15/B/ST2/03998, and 2015/19/B/ST2/02861, Sonata-bis 2012/07/E/ST2/01406; the National Priorities Research Program by Qatar National Research Fund; the Programa Estatal de Fomento de la Investigaci ´on Cient´ıfica y T´ecnica de Excelencia Mar´ıa de Maeztu, grant MDM-2015-0509 and the Programa Severo Ochoa del Principado de Asturias; the Thalis and Aristeia programmes cofinanced by EU-ESF and the Greek NSRF; the Rachadapisek Sompot Fund for Postdoctoral Fellowship, Chulalongkorn University and the Chulalongkorn Aca-demic into Its 2nd Century Project Advancement Project (Thailand); the Welch Foundation, contract C-1845; and the Weston Havens Foundation (USA).
References
[1] R. Contino and G. Servant, “Discovering the top partners at the LHC using same-sign dilepton final states”, JHEP 06 (2008) 026, doi:10.1088/1126-6708/2008/06/026, arXiv:0801.1679.
[2] A. De Simone, O. Matsedonskyi, R. Rattazzi, and A. Wulzer, “A first top partner hunter’s guide”, JHEP 04 (2013) 004, doi:10.1007/JHEP04(2013)004, arXiv:1211.5663. [3] K. Agashe, R. Contino, and A. Pomarol, “The minimal composite Higgs model”, Nucl.
Phys. B 719 (2005) 165, doi:10.1016/j.nuclphysb.2005.04.035, arXiv:hep-ph/0412089.
[4] D. B. Kaplan, “Flavor at SSC energies: A new mechanism for dynamically generated fermion masses”, Nucl. Phys. B 365 (1991) 259,
doi:10.1016/S0550-3213(05)80021-5.
[5] A. Azatov and J. Galloway, “Light custodians and Higgs physics in composite models”, Phys. Rev. D 85 (2012) 055013, doi:10.1103/PhysRevD.85.055013,
arXiv:1110.5646.
[6] G. Cacciapaglia et al., “Heavy vector-like quark with charge 5/3 at the LHC”, JHEP 03 (2013) 004, doi:10.1007/JHEP03(2013)004, arXiv:1211.4034.
[7] CMS Collaboration, “Search for top-quark partners with charge 5/3 in the same-sign dilepton final state”, Phys. Rev. Lett. 112 (2014) 171801,
doi:10.1103/PhysRevLett.112.171801, arXiv:1312.2391.
[8] CMS Collaboration, “Search for top quark partners with charge 5/3 in proton-proton collisions at√s=13 TeV”, JHEP 08 (2017) 073, doi:10.1007/JHEP08(2017)073, arXiv:1705.10967.
References 21
[9] ATLAS Collaboration, “Analysis of events with b-jets and a pair of leptons of the same charge in pp collisions at√s=8 TeV with the ATLAS detector”, JHEP 10 (2015) 150, doi:10.1007/JHEP10(2015)150, arXiv:1504.04605.
[10] ATLAS Collaboration, “Search for vector-like B quarks in events with one isolated lepton, missing transverse momentum and jets at√s=8 TeV with the ATLAS detector”, Phys. Rev. D 91 (2015) 112011, doi:10.1103/PhysRevD.91.112011, arXiv:1503.05425. [11] ATLAS Collaboration, “Search for pair production of heavy vector-like quarks decaying
to high-p√ T W bosons and b quarks in the lepton-plus-jets final state in pp collisions at
s =13 TeV with the ATLAS detector”, JHEP 10 (2017) 141, doi:10.1007/JHEP10(2017)141, arXiv:1707.03347.
[12] ATLAS Collaboration, “Search for pair production of heavy vector-like quarks decaying into high-p√ TW bosons and top quarks in the lepton-plus-jets final state in pp collisions at
s =13 TeV with the ATLAS detector”, JHEP 08 (2018) 048, doi:10.1007/JHEP08(2018)048, arXiv:1806.01762.
[13] ATLAS Collaboration, “Search for new phenomena in events with same-charge leptons and b-jets in pp collisions at√s=13 TeV with the ATLAS detector”, JHEP 12 (2018) 039, doi:10.1007/JHEP12(2018)039, arXiv:1807.11883.
[14] ATLAS Collaboration, “Combination of the searches for pair-produced vector-like partners of the third-generation quarks at√s =13 TeV with the ATLAS detector”, Phys. Rev. Lett. 121 (2018) 211801, doi:10.1103/PhysRevLett.121.211801,
arXiv:1808.02343.
[15] CMS Collaboration, “The CMS trigger system”, JINST 12 (2017) P01020, doi:10.1088/1748-0221/12/01/P01020, arXiv:1609.02366.
[16] CMS Collaboration, “The CMS experiment at the CERN LHC”, JINST 3 (2008) S08004, doi:10.1088/1748-0221/3/08/S08004.
[17] J. Alwall et al., “The automated computation of tree-level and next-to-leading order differential cross sections, and their matching to parton shower simulations”, JHEP 07 (2014) 079, doi:10.1007/JHEP07(2014)079, arXiv:1405.0301.
[18] P. Artoisenet, R. Frederix, O. Mattelaer, and R. Rietkerk, “Automatic spin-entangled decays of heavy resonances in Monte Carlo simulations”, JHEP 03 (2013) 015, doi:10.1007/JHEP03(2013)015, arXiv:1212.3460.
[19] M. Czakon and A. Mitov, “Top++: a program for the calculation of the top-pair cross-section at hadron colliders”, Comput. Phys. Commun. 185 (2014) 2930, doi:10.1016/j.cpc.2014.06.021, arXiv:1112.5675.
[20] M. Czakon, P. Fiedler, and A. Mitov, “The total top quark pair production cross-section at hadron colliders throughO(α4S)”, Phys. Rev. Lett. 110 (2013) 252004,
doi:10.1103/PhysRevLett.110.252004, arXiv:1303.6254.
[21] M. Czakon and A. Mitov, “NNLO corrections to top-pair production at hadron colliders: the all-fermionic scattering channels”, JHEP 12 (2012) 054,
[22] M. Czakon and A. Mitov, “NNLO corrections to top pair production at hadron colliders: the quark-gluon reaction”, JHEP 01 (2013) 080, doi:10.1007/JHEP01(2013)080, arXiv:1210.6832.
[23] P. B¨arnreuther, M. Czakon, and A. Mitov, “Percent level precision physics at the Tevatron: first genuine NNLO QCD corrections to q ¯q →t¯t+X”, Phys. Rev. Lett. 109 (2012) 132001, doi:10.1103/PhysRevLett.109.132001, arXiv:1204.5201.
[24] M. Cacciari et al., “Top-pair production at hadron colliders with next-to-next-to-leading logarithmic soft-gluon resummation”, Phys. Lett. B 710 (2012) 612,
doi:10.1016/j.physletb.2012.03.013, arXiv:1111.5869.
[25] P. Nason, “A new method for combining NLO QCD with shower Monte Carlo algorithms”, JHEP 11 (2004) 040, doi:10.1088/1126-6708/2004/11/040, arXiv:hep-ph/0409146.
[26] S. Frixione, P. Nason, and C. Oleari, “Matching NLO QCD computations with parton shower simulations: the POWHEG method”, JHEP 11 (2007) 070,
doi:10.1088/1126-6708/2007/11/070, arXiv:0709.2092.
[27] S. Alioli, P. Nason, C. Oleari, and E. Re, “A general framework for implementing NLO calculations in shower Monte Carlo programs: the POWHEG BOX”, JHEP 06 (2010) 043, doi:10.1007/JHEP06(2010)043, arXiv:1002.2581.
[28] S. Frixione, P. Nason, and G. Ridolfi, “A positive-weight next-to-leading-order Monte Carlo for heavy flavour hadroproduction”, JHEP 09 (2007) 126,
doi:10.1088/1126-6708/2007/09/126, arXiv:0707.3088.
[29] J. Alwall et al., “Comparative study of various algorithms for the merging of parton showers and matrix elements in hadronic collisions”, Eur. Phys. J. C 53 (2008) 473, doi:10.1140/epjc/s10052-007-0490-5, arXiv:0706.2569.
[30] R. Frederix and S. Frixione, “Merging meets matching in MC@NLO”, JHEP 12 (2012) 061, doi:10.1007/JHEP12(2012)061, arXiv:1209.6215.
[31] T. Sj ¨ostrand et al., “An introduction to PYTHIA 8.2”, Comput. Phys. Commun. 191 (2015) 159, doi:10.1016/j.cpc.2015.01.024, arXiv:1410.3012.
[32] NNPDF Collaboration, “Parton distributions for the LHC Run II”, JHEP 04 (2015) 040, doi:10.1007/JHEP04(2015)040, arXiv:1410.8849.
[33] CMS Collaboration, “Event generator tunes obtained from underlying event and multiparton scattering measurements”, Eur. Phys. J. C 76 (2016) 155,
doi:10.1140/epjc/s10052-016-3988-x, arXiv:1512.00815.
[34] P. Skands, S. Carrazza, and J. Rojo, “Tuning PYTHIA 8.1: the Monash 2013 tune”, Eur. Phys. J. C 74 (2014) 3024, doi:10.1140/epjc/s10052-014-3024-y,
arXiv:1404.5630.
[35] CMS Collaboration, “Investigations of the impact of the parton shower tuning in Pythia 8 in the modelling of tt at√s =8 and 13 TeV”, CMS Physics Analysis Summary
CMS-PAS-TOP-16-021, 2016.
[36] GEANT4 Collaboration, “GEANT4—a simulation toolkit”, Nucl. Instrum. Meth. A 506 (2003) 250, doi:10.1016/S0168-9002(03)01368-8.
References 23
[37] CMS Collaboration, “Measurement of the differential cross section for top quark pair production in pp collisions at√s =8 TeV”, Eur. Phys. J. C 75 (2015) 542,
doi:10.1140/epjc/s10052-015-3709-x, arXiv:1505.04480.
[38] CMS Collaboration, “Particle-flow reconstruction and global event description with the CMS detector”, JINST 12 (2017) P10003, doi:10.1088/1748-0221/12/10/P10003, arXiv:1706.04965.
[39] M. Cacciari, G. P. Salam, and G. Soyez, “The anti-kTjet clustering algorithm”, JHEP 04
(2008) 063, doi:10.1088/1126-6708/2008/04/063, arXiv:0802.1189.
[40] M. Cacciari, G. P. Salam, and G. Soyez, “FastJet user manual”, Eur. Phys. J. C 72 (2012) 1896, doi:10.1140/epjc/s10052-012-1896-2, arXiv:1111.6097.
[41] CMS Collaboration, “Performance of electron reconstruction and selection with the CMS detector in proton-proton collisions at√s=8 TeV”, JINST 10 (2015) P06005,
doi:10.1088/1748-0221/10/06/P06005, arXiv:1502.02701.
[42] CMS Collaboration, “CMS tracking performance results from early LHC operation”, Eur. Phys. J. C 70 (2010) 1165, doi:10.1140/epjc/s10052-010-1491-3,
arXiv:1007.1988.
[43] W. Adam, R. Fr ¨uhwirth, A. Strandlie, and T. Todorov, “Reconstruction of electrons with the Gaussian-sum filter in the CMS tracker at the LHC”, J. Phys. G 31 (2005) N9, doi:10.1088/0954-3899/31/9/N01, arXiv:physics/0306087.
[44] M. Cacciari and G. P. Salam, “Pileup subtraction using jet areas”, Phys. Lett. B 659 (2008) 119, doi:10.1016/j.physletb.2007.09.077, arXiv:0707.1378.
[45] CMS Collaboration, “Measurement of the inclusive W and Z production cross sections in pp collisions at√s =7 TeV”, JHEP 10 (2011) 132, doi:10.1007/JHEP10(2011)132, arXiv:1107.4789.
[46] M. Cacciari, G. P. Salam, and G. Soyez, “The catchment area of jets”, JHEP 04 (2008) 005, doi:10.1088/1126-6708/2008/04/005, arXiv:0802.1188.
[47] CMS Collaboration, “Jet algorithms performance in 13 TeV data”, CMS Physics Analysis Summary CMS-PAS-JME-16-003, 2017.
[48] CMS Collaboration, “Determination of jet energy calibration and transverse momentum resolution in CMS”, JINST 6 (2011) P11002,
doi:10.1088/1748-0221/6/11/P11002, arXiv:1107.4277.
[49] CMS Collaboration, “Jet energy scale and resolution in the CMS experiment in pp collisions at 8 TeV”, JINST 12 (2017) P02014,
doi:10.1088/1748-0221/12/02/P02014, arXiv:1607.03663.
[50] CMS Collaboration, “Identification of heavy-flavour jets with the CMS detector in pp collisions at 13 TeV”, JINST 13 (2018) P05011,
doi:10.1088/1748-0221/13/05/P05011, arXiv:1712.07158.
[51] A. J. Larkoski, S. Marzani, G. Soyez, and J. Thaler, “Soft drop”, JHEP 05 (2014) 146, doi:10.1007/JHEP05(2014)146, arXiv:1402.2657.

![Figure 3: Distributions of min [ M (` , b )] (left) and ∆R (` , j 2 ) (right) in data and simulation for events with at least three AK4 jets, including a leading (subleading) jet with p T > 250 (150) GeV, after combining the electron and muon channels](https://thumb-eu.123doks.com/thumbv2/9libnet/4592695.84855/13.892.117.773.213.528/distributions-simulation-including-leading-subleading-combining-electron-channels.webp)
![Figure 4: Distributions of min [ M (` , b )] in the tt control region, for 1 b-tagged jet (upper left) and ≥ 2 b-tagged jets (upper right) categories, and of min [ M (` , j )] in the W+jets control region, for 0 W-tagged jets (lower left) and ≥ 1 W-tagged](https://thumb-eu.123doks.com/thumbv2/9libnet/4592695.84855/14.892.115.784.218.857/figure-distributions-control-tagged-categories-control-tagged-tagged.webp)
![Figure 5: Distributions of min [ M (` , b )] in events with 0 t-tagged jets, 0 (upper) or ≥ 1 (lower) W-tagged jets, and 1 (left) or ≥ 2 (right) b-tagged jets for the combined electron and muon samples in the signal region](https://thumb-eu.123doks.com/thumbv2/9libnet/4592695.84855/16.892.114.780.222.868/figure-distributions-tagged-tagged-combined-electron-samples-signal.webp)
![Figure 6: Distributions of min [ M (` , b )] in events with ≥ 1 t-tagged jets, 0 (upper) or ≥ 1 (lower) W-tagged jets, and 1 (left) or ≥ 2 (right) b-tagged jets for the combined electron and muon samples in the signal region](https://thumb-eu.123doks.com/thumbv2/9libnet/4592695.84855/17.892.113.781.222.867/figure-distributions-tagged-tagged-combined-electron-samples-signal.webp)