Research Article
A Multi-Objective Stochastic Model for an Earthquake
Relief Network
Zeren D. Yenice and Funda Samanlioglu
Department of Industrial Engineering, Kadir Has University, Kadir Has Campus, Cibali, Istanbul 34083, Turkey
Correspondence should be addressed to Funda Samanlioglu; [email protected]
Received 26 December 2018; Revised 27 June 2019; Accepted 6 September 2019; Published 15 January 2020 Academic Editor: Eneko Osaba
Copyright © 2020 Zeren D. Yenice and Funda Samanlioglu. This is an open access article distributed under the Creative Commons Attribution License, which permits unrestricted use, distribution, and reproduction in any medium, provided the original work is properly cited.
Earthquake relief network involves storage and distribution of relief aid to people in need. In this paper, a new stochastic multi-objective mixed integer mathematical model is developed and implemented in Kadikoy municipality of Istanbul, Turkey in order to configure part of the earthquake relief network. The aim of the model is to help decision makers decide on the locations of storage areas for shelters pre-earthquake and distribution of shelters from these areas to temporary shelter areas post-earthquake while minimizing earthquake scenario-specific total expected distribution distance, total expected earthquake damage risk factor of storage areas and expected total penalty cost related to unsatisfied demand at temporary shelter areas, simultaneously. In the model, storage area capacity and coverage distance restrictions are taken into consideration. The data related to potential storage areas and shelter locations were obtained from Kadikoy municipality of Istanbul and Istanbul Metropolitan Municipality (IMM). The earthquake damage risk factors were determined based on possible earthquake scenarios given in Japan International Cooperation Agency’s (JICA) report. Four event scenarios with two different earthquake scenario likelihoods were considered and sample efficient solutions from the Pareto frontier were obtained implementing the normalized (scaled) weighted sum method.
1. Introduction
Today’s one of the prominent problems is natural disasters such as earthquakes. An accurate prediction of earthquakes is not yet possible, however it is possible to plan the stages of disaster operations management (mitigation, preparedness, response and recovery) based on several earthquake scenarios. Inefficient disaster management; emergency response and disaster relief may lead to starvation, diseases and eventually loss of lives even after an earthquake. Immediate typical needs post-earthquake are search and rescue operations, medical assistance, food and water procurement, and provision of tem-porary shelters. In this paper, a multi-objective stochastic model is developed to help decision makers in decisions related to storage and distribution of shelters.
Earthquake occurrence is the leading hazard in Turkey since the northern Anatolian fault crosses the country east to west, and the Anatolian fault north to south. 96% of the coun-try’s area is prone to earthquake risk and 66% contains active faults. Turkey went through several earthquake disasters in
the century and based on the Japan International Cooperation Agency’s (JICA) report [1], an earthquake is expected to occur in the following years at Marmara Sea which is very close to Istanbul and therefore people need to be prepared for it. An earthquake happened in August 17, 1999 and damaged several cities in the Marmara Region and the center of the earthquake was Golcuk. Estimated number of casualties were 15918, the number of heavily damaged houses were 66403, and the num-ber of heavily damaged business units were 15000 [2]. Around 60% of these houses and business units collapsed immediately during the earthquake. Number of weakly or medium dam-aged houses were 146493 and number of weakly or medium damaged business units were 21000 [3]. As a result, around 120000 families needed immediate shelter after the earthquake in Golcuk which shows the significance of shelter storage and distribution problem.
In the literature, stochastic models are developed to handle mostly location, allocation, and distribution decisions related to logistics. Logendran and Terrell [4] developed a facility location model with stochastic demands and determined
allocation of clients to uncapacitated plants. Louveaux and Peeters [5] presented a stochastic facility location model taking into consideration uncertain demands, uncertain transporta-tion and productransporta-tion costs and uncertain selling prices with different event scenarios. Laporte et al. [6] studied location of facilities and allocation of customers to facilities as first-stage, and determination of quantities to send as second-stage deci-sions. Mousavi and Niaki [7] presented a capacitated location allocation problem where demands and locations of customers were uncertain. They assumed that demands are fuzzy and locations have normal probability distribution, and minimized fuzzy expected cost while finding optimal stochastic location.
Stochastic models are also used to handle uncertainties in health services, security systems, and service systems. Carson and Batta [8] constructed a location allocation model for pre-paring dynamic ambulance position plan for campus emer-gency service. Demands changed based on the scenarios and ambulances were relocated in each scenario based on mini-mization of average response time. Mestre et al. [9] developed a stochastic location allocation model for hospital network planning of Portuguese National Health Service, minimizing total expected travel time and total expected cost under demand uncertainty. Michalopoulos et al. [10] developed a stochastic network model to determine the (priority) list of locations of radiation detectors to build in order to prevent nuclear smuggling. They created possible threat scenarios by determining smuggler population. Khoo and Teoh [11] pre-sented a methodology to determine optimal fleet management decisions taking into consideration stochastic travelers’ demand.
A number of stochastic models in the disaster relief liter-ature addressed the issues related to storage locations, inven-tory levels and distributions of relief supplies. Inveninven-tory and location decisions are long term strategic resource allocation decisions, typically done for preparedness pre-disaster and distribution decisions are short term allocation decisions, typically done for response post-disaster. However, several models integrate both preparedness and response decisions implementing scenario-based stochastic programming approaches. Pre-disaster operations are listed as evacuation from the potential disaster sites, stock pre-positioning and facility location and post disaster operations are given as evac-uation to shelters, relief distribution and casualty transporta-tion. In their literature survey, Altay and Green [12] identified research contributions in different stages of disaster opera-tions management and listed these stages as mitigation, pre-paredness, response and recovery. Caunhye et al. [13] stated that emergency transportation operations were divided into three parts in the literature: facility locations, relief distribu-tion and casualty transportadistribu-tion. For these three parts, they compared models based on their objective functions and con-straints, and showed that location models that plan pre-dis-aster operations are single-period, whereas models that plan relief transportation post-disaster are mostly multi-period. Extensive literature reviews related to relief distribution net-works, two-stage stochastic programs in disaster management with challenges and future research directions and facility locations in humanitarian relief can be found in Anaya-Arenas
et al. [14], Grass and Fischer’s [15] and Trivedi and Singh’s [16] research, respectively.
Some of the stochastic models in the disaster relief litera-ture include single objectives such as minimization of total cost, total delay, expected response time and maximization of total expected demand. Barbarosoglu and Arda [17] developed a two-stage stochastic multi-commodity, multi-modal net-work flow model to plan the transportation of vital first-aid commodities to disaster-affected areas, and validated the model with the data of 1997 Istanbul earthquake. In the model, resource requirements were taken as random variables and due to uncertainty of transportation systems in emergency situations, random arc capacities and supply amounts were used. The objective function was the minimization of the total first-stage transportation cost and the expected recourse cost which includes the total flow costs, mode shift costs and the penalty costs of inventory holding and shortage in the second stage. Chia [18] stated that the primary role of the logistic management in disasters is to deliver supplies in good condi-tions with the required quantities at the right time to the right place, while taking into consideration bottlenecks related to destruction of roads and security. Yi and Özdamar [19] intro-duced a location and distribution model that coordinates logistics and evacuation operations in emergency response management. The model was a mixed integer multi-commod-ity network flow model and its objective function was mini-mizing total delay in delivery of the commodities at aid centers and in the provision of healthcare for the injured survivors. Balcik and Beamon [20] introduced a maximal covering loca-tion model to maximize the total expected demand covered by distribution centers, while taking into consideration mul-tiple item types, and budget and capacity restrictions. Rawls and Turnquist [21] presented a two-stage stochastic optimi-zation model to pre-position various kinds of emergency sup-plies in storage areas pre-hurricane and to ship those to demand points post-hurricane and presented a case study focusing on the hurricane threat in the Gulf coast of US. In their model, they considered scenario-based demand loca-tions, quantities, and transportation capacities, and minimized the total cost which includes fixed cost of opening storage facilities, acquisition cost for items, expected cost of shipment to demand points, expected holding cost of unused items and expected penalty cost for shortage at demand points. Duran et al. [22] developed a stochastic model to increase effective-ness of CARE’s (Cooperative for Assistance and Relief Everywhere) average relief-aid emergency response time. The model included stochastic demands that change according to the disaster type and the objective was to minimize the expected response time. Davis et al. [23] developed a stochas-tic two stage expected cost minimization model in order to manage relief distribution before and after a hurricane. The first stage included preposition of relief goods between storage areas according to forecasts, and the second stage was the response phase that includes distribution of relief goods between storage points and demand points. Paul and MacDonald [24] developed a stochastic model to determine the location and capacity of distribution centers in order to mitigate the impacts of disasters with (almost) no forewarning such as earthquakes. The objective function in the model was
to minimize the sum of expected fatality costs, supply costs and the costs of building distribution centers. Cavdur et al. [25] studied the allocation problem of temporary disaster response facilities and presented an earthquake case-study in Turkey. They developed a two-stage stochastic program, min-imizing the total distance traveled, the unmet demand and the total number of facilities. Celik et al. [26] presented a two-stage mixed integer programming model that includes preposition of facility locations and pre-stocking levels of relief supplies along with minimization of total fixed facility locating cost at the first stage. At the second stage, proposed model allocates located distribution centers to affected locations and distrib-utes relief supplies to demand points. They considered uncer-tainty in demand and minimized the expected cost of satisfying demand based on different scenarios. Maharjan and Hanaoka [27] determined the optimal number and location of ware-houses for relief distribution problem in Nepal by modeling it as a modified maximal covering location problem. Mohamadi and Yaghoubi [28] presented a bi-objective sto-chastic optimization model for the location of transfer points and medical supplies distribution centers, taking into consid-eration triage system and failure of distribution centers and routes, and utilizing backup distribution centers. They con-verted the bi-objective model to a single-objective model with e-constraint method and presented a case study about the erathquake disaster in Iran.
Some stochastic models in the disaster relief literature include multiple objectives. Sheu [29] presented a dynamic multi-criteria relief demand management model to meet urgent relief demands based on time-varying relief demand and demand urgency of the affected area. Mete and Zabinsky [30] developed a two-stage stochastic programming model for storage and distribution of medical supplies and presented a case study in Seattle area. At the first stage, warehouse loca-tions and inventory levels are determined minimizing the total warehouse operation cost and at the second stage, the amount of medical supplies to be distributed to the hospitals are deter-mined minimizing the total transportation duration and the penalty of unfulfilled demand. Zhang et al. [31] introduced a node-weighted bottleneck Steiner tree based multi-objective location optimization model for emergency response logistics. The weights represented the importance of demand points and the model had two objective functions, minimizing the total distance and minimizing the maximum distance between facilities and demand points. Bozorgi-Amiri et al. [32] devel-oped a bi-objective stochastic model for disaster relief logistics where the demands, supplies and the procurement and trans-portation costs were considered uncertain. The objectives in the model were minimization of the sum of the expected value and the variance of the total cost and penalty due to infeasi-bilities and minimization of the sum of the maximum short-ages in the affected demand points. Najafi et al. [33] presented a multi-commodity, multi-mode and multi-period stochastic model to manage the logistics of commodities and injured people in the earthquake response. In their model, they min-imized the total (weighted) unserved injured people, the total (weighted) unsatisfied demand, and the total number of used vehicles. Liberatore et al. [34] worked on distribution of emer-gency goods and presented a multi-criteria model called
RecHADS with a case study about 2010 Haiti earthquake. Their model included reliability and security attributes as well as cost attribute. Hong et al. [35] developed a goal program-ming multi-objective facility location model and presented a case study with the data of South Carolina, USA. In the model, the goals were about the minimization of total logistics costs that consist of fixed facility costs and transportation costs and the minimization of the expected number of disrupted relief items in an emergency logistics network. Tofighi et al. [36] presented a two-stage stochastic model for storage and distri-bution of critical and noncritical relief supplies and presented a case study in Tehran. At the first stage, they determined locations of warehouses and distribution centers along with inventory levels and capacities of warehouses, minimizing the total cost of operation warehouses and distribution centers and inventory costs. At the second stage, they planned the distribution of items, minimizing the total distribution time, the maximum weighted distribution time for the critical items and the total cost of unused inventories and the weighted shortage cost of unmet demands based on different scenarios. Moreno et al. [37] developed a two-stage stochastic location and transportation model which involves social concerns by considering deprivation costs in an emergency distribution network. At the first stage, they tried to obtain locations of relief centers and transportation capacities, minimizing costs of opening and operating relief centers and acquiring trans-portation capacities. At the second stage, they determined transportation of relief goods, minimizing total costs of acquiring extra transportation capacity, transportation costs, inventory holding costs and monetary cost of depriving victims.
In this paper, a multi objective stochastic mixed integer location and distribution model was developed in order to prepare an inventory and distribution plan and solve predicted shelter provision problem. In the model, the criteria consid-ered were simultaneous minimization of total expected dis-tribution distance, total expected earthquake damage risk factor of storage areas and total expected unsatisfied demand penalty cost of demand points. Here, total expected distribu-tion distance was used as one of the objectives instead of total expected distribution cost or response time since in this research these are assumed to be positively correlated with the distribution distance. Here, locations of shelter storage areas (SA) are determined from potential SA and shelters are dis-tributed from the SA to temporary shelter areas (TSA), taking into consideration earthquake scenario dependent demand, earthquake damage risk factor of storage areas, coverage dis-tance and storage capacity restrictions. To the best of authors’ knowledge, none of the stochastic models presented in the disaster relief literature include simultaneously these objec-tives and coverage distance and capacity restrictions. Kadikoy municipality in Istanbul Turkey was chosen as the pilot appli-cation area, and efficient solutions from the Pareto frontier were obtained in order to make decisions related to pre-earth-quake shelter storage and post-earthpre-earth-quake shelter distribution to survivors. In Section 2, details of the mathematical model are presented, along with the normalized (scaled) weighted sum method implementation. Details of the application of the mathematical model in Turkey is given in Section 3, along
s.t.
The first objective function (1) is the minimization of total expected distribution distance between SA and TSA. Second objective function (2) is the minimization of total expected earthquake damage risk factor of SA. Third objective function (3) is the minimization of total expected penalty cost related to unsatisfied demand at TSA. Note that, in (3) penalty cost of unsatisfied demand at TSA depends on the potential earth-quake damage risk factor of TSA. Constraint (4) limits the distribution of shelters from SA to SA’s storage capacity. Constraint (5) is about the satisfaction of demand at TSA.
Constraint (6) is to relate 𝑋𝑛𝑗𝑡 and 𝐵𝑛𝑗𝑡 variables and assign “1”
to variable Bnjt if related SA sends shelter(s) to TSA. Constraint
(7) is to mark fixed SA (already decided storage areas). Constraint (8) is the coverage distance restriction for
distribu-tion of shelters from SA to TSA. Constraint (9) is to relate 𝐵𝑛𝑗𝑡
and 𝐴𝑛 variables and to ensure that only used SA serves to TSA.
Constraints (10) and (11) are for binary decision variables and Constraints (12) and (13) are nonnegativity restrictions.
In this paper, a three-objective mathematical model is for-mulated in order to simultaneously consider three objectives and due to its simplicity, normalized (scaled) weighted sum method is used to obtain representative efficient solutions from the Pareto frontier. The solution of (normalized) weighted sum problem is efficient (Pareto optimal) if all weights are positive [38].
A MOP, min𝑓(𝑥) = {𝑓1(𝑥), 𝑓2(𝑥), . . . , 𝑓𝑘(𝑥),} 𝑠.𝑡. 𝑥 ∈ 𝑋
is assumed to have k competing objective functions
(𝑓𝑖: R𝑛→ R) that are to be minimized simultaneously.
Definition 1. A decision vector 𝑥∈ 𝑋 is efficient (Pareto
optimal) for MOP if there does not exist a 𝑥 ∈ 𝑋, 𝑥 ̸= 𝑥 such
(3) 𝑀𝑖𝑛𝑖𝑚𝑖𝑧𝑒 𝑓3(𝑥) = ∑ 𝑡∈𝑆𝑐𝑃𝑡{∑𝑗∈𝐷𝑀𝑗𝑡𝑈𝑗𝑡}. (4) ∑ 𝑗∈𝐷𝑋𝑛𝑗𝑡≤ 𝐶𝑛𝐴𝑛∀𝑛 ∈ 𝑆, 𝑡 ∈ 𝑆𝑐. (5) ∑ 𝑛∈𝑆𝑋𝑛𝑗𝑡+ 𝑈𝑗𝑡= 𝐷𝑗𝑡∀𝑗 ∈ 𝐷, 𝑡 ∈ 𝑆𝑐. (6) 𝑋𝑛𝑗𝑡≤ 𝐻𝐵𝑛𝑗𝑡∀𝑛 ∈ 𝑆, 𝑗 ∈ 𝐷, 𝑡 ∈ 𝑆𝑐. (7) 𝐴𝑛= 1∀𝑛 ∈ 𝐹. (8) 𝑇𝑛𝑗𝐵𝑛𝑗𝑡≤ 𝐾∀𝑛 ∈ 𝑆, 𝑗 ∈ 𝐷, 𝑡 ∈ 𝑆𝑐. (9) 𝐵𝑛𝑗𝑡≤ 𝐴𝑛∀𝑛 ∈ 𝑆, 𝑗 ∈ 𝐷, 𝑡 ∈ 𝑆𝑐. (10) 𝐴𝑛∈ {0, 1}∀𝑛 ∈ 𝑆. (11) 𝐵𝑛𝑗𝑡∈ {0, 1}∀𝑛 ∈ 𝑆, 𝑗 ∈ 𝐷, 𝑡 ∈ 𝑆𝑐. (12) 𝑋𝑛𝑗𝑡≥ 0∀𝑛 ∈ 𝑆, 𝑗 ∈ 𝐷, 𝑡 ∈ 𝑆𝑐. (13) 𝑈𝑗𝑡≥ 0∀𝑗 ∈ 𝐷, 𝑡 ∈ 𝑆𝑐.
with conclusions and suggestions for future directions in Section 4.
2. The Mathematical Model
The proposed mathematical model is a stochastic multi-crite-ria mixed integer model. Expected values are optimized in stochastic models since uncertainty creates possible different probabilistic scenarios. The notation, parameters, and decision variables of the model are presented below.
Sets;
𝑆 = {𝑛|𝑛 = 1 . . . 𝑁} set of SA.
𝐹 ⊂ 𝑆 set of fixed SA.
𝐷 = {𝑗|𝑗 = 1 . . . 𝑀} set of TSA.
𝑆𝑐 = {𝑡|𝑡 = 1 . . . 𝑊} set of earthquake scenario in the model.
Decision Variables;
𝐴𝑛: { 10 otherwiseif storage area𝑛 is used for storing shelters 𝑛 ∈ 𝑆
𝑋𝑛𝑗𝑡: Amount of shelters sent from SA n to TSA j according
to scenario t,𝑗 ∈ 𝐷, 𝑡 ∈ 𝑆𝑐.
𝑈𝑗𝑡: Amount of unsatisfied demand at TSA j according
to scenario t, 𝑗 ∈ 𝐷, 𝑡 ∈ 𝑆𝑐. 𝐵𝑛𝑗𝑡 { { { { {
1 if storage area 𝑛 servesto shelter
area𝑗 according to scenario 𝑡, 𝑛 ∈ 𝑆, 𝑗 ∈ 𝐷, 𝑡 ∈ 𝑆𝑐 0 otherwise
Parameters;
𝑃𝑡: Probability of earthquake scenario t, 𝑡 ∈ 𝑆𝑐.
𝐶𝑛: Potential storage capacity of SA n, 𝑛 ∈ 𝑆.
𝑅𝑛𝑡: Potential earthquake damage risk factor of SA n
according to scenario t,𝑛 ∈ 𝑆,𝑡 ∈ 𝑆𝑐.
𝐷𝑗𝑡: Demand of TSA j according to scenario t, 𝑗 ∈ 𝐷
,𝑡 ∈ 𝑆𝑐.
𝑇𝑛𝑗: Distance between SA n and TSA j, 𝑛 ∈ 𝑆, 𝑗 ∈ 𝐷.
𝑅𝑗𝑡: Potential earthquake damage risk factor of TSA j
according to scenario t, 𝑗 ∈ 𝐷, 𝑡 ∈ 𝑆𝑐.
𝑀𝑗𝑡: Penalty cost for unsatisfied demand of TSA j
accord-ing to scenario t, 𝑗 ∈ 𝐷, 𝑡 ∈ 𝑆𝑐.
𝑀𝑗𝑡= 𝐿∗𝑅𝑗𝑡∀𝑗 ∈ 𝐷, 𝑡 ∈ 𝑆𝑐, where𝐿 = max𝑛𝑆{𝐶𝑛}.
Useful Definitions;
Definition 1: K is the distance limit for shelter allocation
and defined as𝐾 ≈ [max𝑛∈𝑆,𝑗∈𝐷{𝑇𝑛𝑗}]/2, K value can be
changed according to decision maker’s preference.
Definition 2: H is a large enough number and defined
as𝐻 ≈ max𝑛∈𝑆{𝐶𝑛}.
The mathematical model is as follows:
(1) Minimize 𝑓1(𝑥) = ∑ 𝑡∈𝑆𝑐𝑃𝑡{∑𝑛∈𝑆𝑗∈𝐷∑𝑇𝑛𝑗𝐵𝑛𝑗𝑡}. (2) Minimize 𝑓2(𝑥) = ∑ 𝑡∈𝑆𝑐𝑃𝑡{∑𝑛∈𝑆𝑅𝑛𝑡𝐴𝑛}.
Model D: This scenario assumes that the fault line in the
north of Marmara Sea intersects with Cinarcik Graben and creates earthquake which has 6.7 Mw moment magnitude.
Among these 4 earthquake scenarios, Model A has the greatest probability to take place and Model C is the worst-case scenario to happen. In the JICA report [1], detailed data were available only for these two earthquake scenarios, so in this application only Model A (earthquake scenario 1) and Model C (earthquake scenario 2) were considered. In Tables 1, 4 event scenarios were created taking into consideration that Model A (earthquake scenario 1) is more likely to occur than Model C (earthquake scenario 2) based on the JICA report [1].
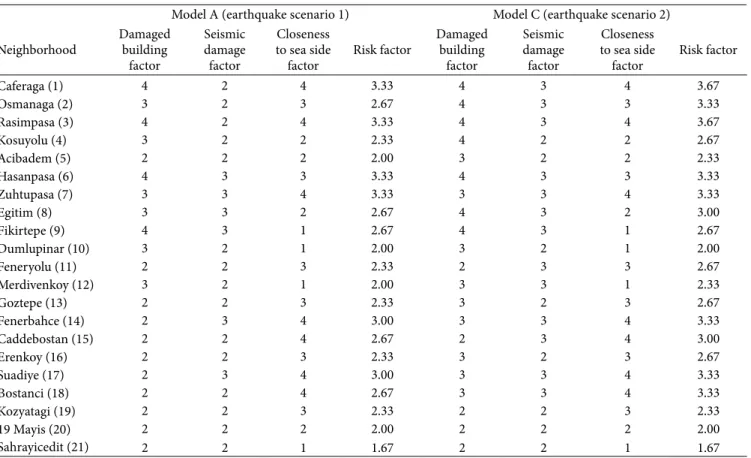
JICA report [1] contains maps of Istanbul with color-coded areas that are based on the expected number of heavily dam-aged buildings and seismic intensity for both Model A and C. These maps are given in Figures 1–4. Red and orange colored areas will be affected heavily, yellow colored areas will suffer moderate level damage, green and blue colored areas will be affected lightly from the earthquake. From these maps, Kadiköy municipality is enlarged and related maps of Kadiköy munici-pality are given in Figures 5–8. In Figure 5, previously listed neighborhood numbers of Kadiköy municipality are also pre-sented to show the readers the locations of these neighborhoods and potential SA and TSA. These maps are used to determine the potential earthquake damage risk factors of SA and TSA. For model A (earthquake scenario 1) and C (earthquake sce-nario 2), risk factor of each SA and TSA was calculated, depend-ing on the neighborhood it is located at, as the average of damaged building factor, seismic damage factor and closeness to sea side factor due to possibility of tsunami. The neighbor-hoods of Kadiköy and related risk factors are given in Table 2. Damaged building factor and seismic damage factor were deter-mined from color-coded hazard maps of JICA report [1], which are given in Figures 1–8. For these factors, numerical values 1–5 were assigned, 5 for very high risk and 1 for very low risk. Areas close to sea could be damaged more than far ones due to tsunami and south shores of Istanbul might be damaged as a result of an earthquake affecting Marmara Sea. To determine closeness to sea side factor of each SA and TSA, numerical values 1–5 were assigned, 5 for very close and 1 for very far.
In Table 3, 12 TSA and related shelter demands and earth-quake damage risk factors are given for both earthearth-quake sce-nario 1 (Model A) and 2 (Model C). Amount of required shelters (demands) were calculated by IMM Disaster Coordination Center (AKOM) according to the sizes of TSA and those quantities were used as demands for the worst-case earthquake scenario (model C, earthquake scenario 2). Based on the JICA report [1], Model C has 2313 units of heavily
that 𝑓𝑖(𝑥) ≤ 𝑓𝑖(𝑥) 𝑓𝑜𝑟 𝑖 = 1, . . . , 𝑘 with strict inequality
holding for at least one index i. (𝑥∈ 𝑋 is efficient, 𝑓
𝑖(𝑥) is
non-dominated.)
Definition 2. A decision vector 𝑥∈ 𝑋 is weakly efficient
(weakly Pareto optimal) for MOP if there does not exist a
𝑥 ∈ 𝑋, 𝑥 ̸= 𝑥 such that 𝑓
𝑖(𝑥) < 𝑓𝑖(𝑥) 𝑓𝑜𝑟 𝑖 = 1, ..., 𝑘. (𝑥∈ 𝑋
is weakly efficient, 𝑓𝑖(𝑥) is weakly non-dominated.)
The normalized weighted sum formulation of this problem is given in (14) as:
s.t. (4)–(13).
where 𝑤𝑖> 0 are the importance weights (∑𝑖=3𝑖=1𝑤𝑖= 1),
𝑓∗
𝑖 (𝑥) (i = 1, 2, 3) is the utopia point defined as
𝑓∗
𝑖 (𝑥) = min𝑥∈𝑋𝑓𝑖(𝑥) − 𝛿𝑖= for i = 1, 2, 3 (𝛿𝑖> 0) and 𝑓𝑖𝑛(𝑥)
(i = 1, 2, 3) is the nadir point defined as the upper bound of the Pareto optimal set. Problem (14) with different weights
(w𝑖< 0 and ∑𝑖w𝑖= 1) is solved each time to obtain several
representative efficient solutions of the problem.
3. Application in Turkey
The mathematical model is applied in Kadikoy municipality of Istanbul, Turkey. The data related to the potential SA and TSA were obtained from Kadikoy municipality of Istanbul and Istanbul Metropolitan Municipality (IMM). Kadikoy munic-ipality has 21 neighborhoods and in the paper for simplicity these neighborhoods are given numbers as: Caferaga (1), Osmanaga (2), Rasimpasa (3), Kosuyolu (4), Acibadem (5), Hasanpasa (6), Zuhtupasa (7), Egitim (8), Fikirtepe (9), Dumlupinar (10), Feneryolu (11), Merdivenkoy (12), Goztepe (13), Fenerbahce (14), Caddebostan (15), Erenkoy (16), Suadiye (17), Bostanci (18), Kozyatagi (19), 19 Mayis (20) and Sahrayicedit (21). The earthquake damage risks were deter-mined based on possible earthquake scenarios presented in JICA report [1]. JICA team created four possible earthquake scenarios for fault line breakdowns of the expected earthquake in Turkey. These four earthquake scenarios were created based on historical earthquakes and North Anatolian fault line and listed below.
Model A: Approximately 120 km long fault line of 1999
Izmit earthquake causes disaster and seismic activity goes from east to west. Moment magnitude was assumed to be 7.5 Mw.
Model B: Approximately 110 km long fault line of 1912
Murefte-Sarkoy earthquake causes disaster and its moment magnitude was expected to be 7.4 Mw.
Model C: This scenario assumes that 170 km long North
Anatolian fault line in Marmara Sea will break at the same time. The moment magnitude is expected to be 7.7 Mw. It is the biggest magnitude that will occur in this area. The largest earthquake that has occurred around the Marmara Sea in the history has 7.6 Mw moment magnitude.
(14) min𝑧 = 𝑖=3 ∑ 𝑖=1𝑤𝑖[ 𝑓 𝑖(𝑥) − 𝑓𝑖∗(𝑥) 𝑓∗ 𝑖(𝑥) − 𝑓𝑖𝑛(𝑥)],
Table 1: Event scenarios. Event
scenario no (earthquake scenario 1)Probability of model A (earthquake scenario 2)Probability of model C
1 0.9 0.1
2 0.8 0.2
3 0.7 0.3
assumed to be approximately 20% lower than Model C’s (earthquake scenario 2) demands.
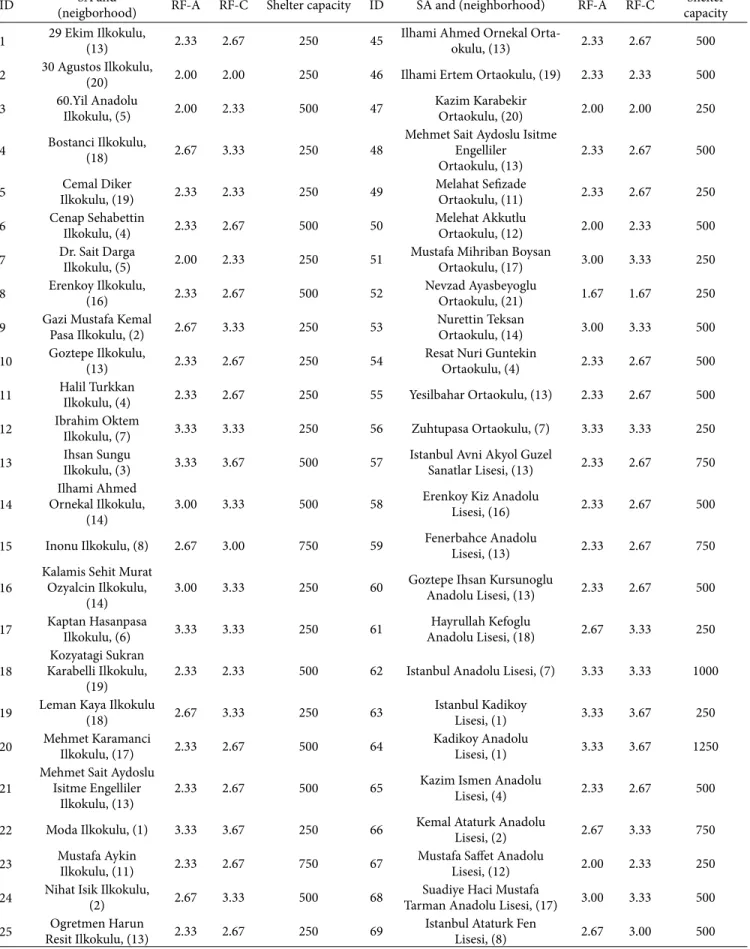
88 potential SA were considered in this research, and these were available public schools in Kadikoy. Also, in Chen et al. buildings and model A has 1944 units. There is about 17%
difference between these scenarios in terms of heavily dam-aged buildings and seismic intensity will also be lower in model A. So, model A’s (earthquake scenario 1) demands were
Table 2: Risk factors of neighborhoods of Kadiköy municipality for model A (earthquake scenario 1) and C (earthquake scenario 2). Model A (earthquake scenario 1) Model C (earthquake scenario 2)
Neighborhood Damaged building factor Seismic damage factor Closeness to sea side
factor Risk factor
Damaged building factor Seismic damage factor Closeness to sea side
factor Risk factor
Caferaga (1) 4 2 4 3.33 4 3 4 3.67 Osmanaga (2) 3 2 3 2.67 4 3 3 3.33 Rasimpasa (3) 4 2 4 3.33 4 3 4 3.67 Kosuyolu (4) 3 2 2 2.33 4 2 2 2.67 Acibadem (5) 2 2 2 2.00 3 2 2 2.33 Hasanpasa (6) 4 3 3 3.33 4 3 3 3.33 Zuhtupasa (7) 3 3 4 3.33 3 3 4 3.33 Egitim (8) 3 3 2 2.67 4 3 2 3.00 Fikirtepe (9) 4 3 1 2.67 4 3 1 2.67 Dumlupinar (10) 3 2 1 2.00 3 2 1 2.00 Feneryolu (11) 2 2 3 2.33 2 3 3 2.67 Merdivenkoy (12) 3 2 1 2.00 3 3 1 2.33 Goztepe (13) 2 2 3 2.33 3 2 3 2.67 Fenerbahce (14) 2 3 4 3.00 3 3 4 3.33 Caddebostan (15) 2 2 4 2.67 2 3 4 3.00 Erenkoy (16) 2 2 3 2.33 3 2 3 2.67 Suadiye (17) 2 3 4 3.00 3 3 4 3.33 Bostanci (18) 2 2 4 2.67 3 3 4 3.33 Kozyatagi (19) 2 2 3 2.33 2 2 3 2.33 19 Mayis (20) 2 2 2 2.00 2 2 2 2.00 Sahrayicedit (21) 2 2 1 1.67 2 2 1 1.67
Table 3: Data of temporary shelter areas (TSA). ID Place and (Neighbor-hood) Area (m2) Shelter demands
(model A) Shelter demands (model C) Risk factors (Rmodel Aj1) of Risk factors (Rmodel Cj2) of
100 Kosuyolu park, (4) 12000 192 240 2.33 2.67
101 Kadikoy Municipali-ty parking area, (6) 17000 272 340 3.33 3.33
102 Yogurtcu park, (2) 25000 400 500 2.67 3.33
103 Kadikoy Anadolu Lisesi, (1) 22000 352 440 3.33 3.67
104 and parking area, (1)Moda bazaar area 8000 128 160 3.33 3.67
105 Fenerbahce park, (14) 60000 960 1200 3.00 3.33
106 IETT bus station, (8) 8000 128 160 2.67 3
107 Fenerbahce sport facilities, (10) 19000 304 380 2.00 2
108 Selamicesme Ozgur-luk park, (13) 120000 1920 2400 2.33 2.67
109 Goztepe park, (15) 90000 1440 1800 2.67 3
110 Cebe sokak, (21) 70000 1120 1400 1.67 1.67
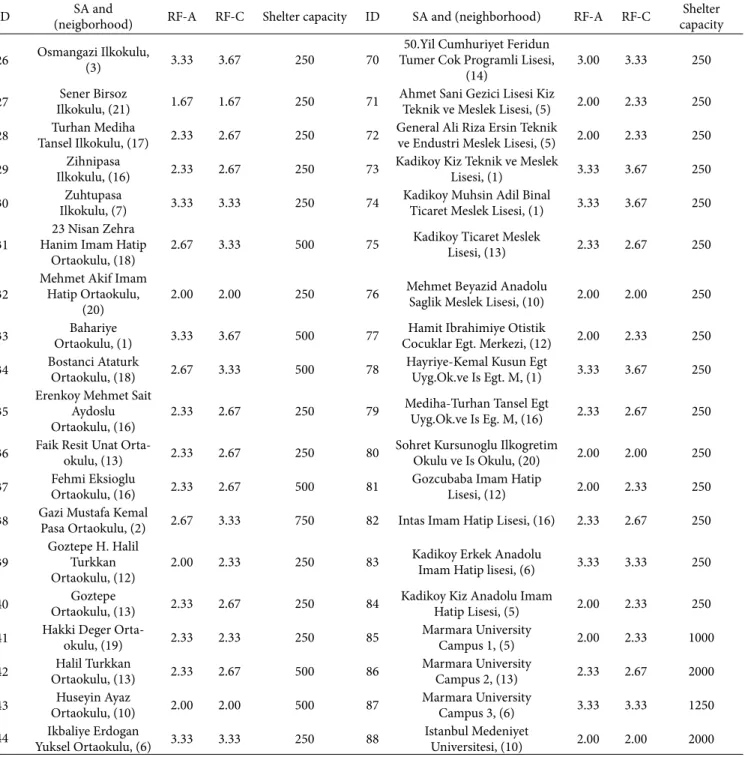
Table 4: Earthquake damage risk factors (RF) of storage areas (SA) based on model A (RF-A) and model C (RF-C) and shelter capacities in units.
ID (neigborhood)SA and RF-A RF-C Shelter capacity ID SA and (neighborhood) RF-A RF-C capacityShelter 1 29 Ekim Ilkokulu, (13) 2.33 2.67 250 45 Ilhami Ahmed Ornekal Orta-okulu, (13) 2.33 2.67 500 2 30 Agustos Ilkokulu, (20) 2.00 2.00 250 46 Ilhami Ertem Ortaokulu, (19) 2.33 2.33 500 3 60.Yil Anadolu Ilkokulu, (5) 2.00 2.33 500 47 Kazim Karabekir Ortaokulu, (20) 2.00 2.00 250 4 Bostanci Ilkokulu, (18) 2.67 3.33 250 48 Mehmet Sait Aydoslu Isitme Engelliler
Ortaokulu, (13) 2.33 2.67 500
5 Ilkokulu, (19)Cemal Diker 2.33 2.33 250 49 Melahat Sefizade Ortaokulu, (11) 2.33 2.67 250 6 Cenap Sehabettin Ilkokulu, (4) 2.33 2.67 500 50 Melehat Akkutlu Ortaokulu, (12) 2.00 2.33 500 7 Dr. Sait Darga Ilkokulu, (5) 2.00 2.33 250 51 Mustafa Mihriban Boysan Ortaokulu, (17) 3.00 3.33 250 8 Erenkoy Ilkokulu, (16) 2.33 2.67 500 52 Nevzad Ayasbeyoglu Ortaokulu, (21) 1.67 1.67 250 9 Gazi Mustafa Kemal Pasa Ilkokulu, (2) 2.67 3.33 250 53 Nurettin Teksan Ortaokulu, (14) 3.00 3.33 500 10 Goztepe Ilkokulu, (13) 2.33 2.67 250 54 Resat Nuri Guntekin Ortaokulu, (4) 2.33 2.67 500 11 Halil Turkkan Ilkokulu, (4) 2.33 2.67 250 55 Yesilbahar Ortaokulu, (13) 2.33 2.67 500 12 Ibrahim Oktem Ilkokulu, (7) 3.33 3.33 250 56 Zuhtupasa Ortaokulu, (7) 3.33 3.33 250 13 Ihsan Sungu Ilkokulu, (3) 3.33 3.67 500 57 Istanbul Avni Akyol Guzel Sanatlar Lisesi, (13) 2.33 2.67 750 14 Ornekal Ilkokulu, Ilhami Ahmed
(14) 3.00 3.33 500 58
Erenkoy Kiz Anadolu
Lisesi, (16) 2.33 2.67 500
15 Inonu Ilkokulu, (8) 2.67 3.00 750 59 Fenerbahce Anadolu Lisesi, (13) 2.33 2.67 750 16 Kalamis Sehit Murat Ozyalcin Ilkokulu,
(14) 3.00 3.33 250 60
Goztepe Ihsan Kursunoglu
Anadolu Lisesi, (13) 2.33 2.67 500 17 Kaptan Hasanpasa Ilkokulu, (6) 3.33 3.33 250 61 Anadolu Lisesi, (18)Hayrullah Kefoglu 2.67 3.33 250 18 Karabelli Ilkokulu, Kozyatagi Sukran
(19) 2.33 2.33 500 62 Istanbul Anadolu Lisesi, (7) 3.33 3.33 1000
19 Leman Kaya Ilkokulu (18) 2.67 3.33 250 63 Istanbul Kadikoy Lisesi, (1) 3.33 3.67 250 20 Mehmet Karamanci Ilkokulu, (17) 2.33 2.67 500 64 Kadikoy Anadolu Lisesi, (1) 3.33 3.67 1250 21 Mehmet Sait Aydoslu Isitme Engelliler
Ilkokulu, (13) 2.33 2.67 500 65
Kazim Ismen Anadolu
Lisesi, (4) 2.33 2.67 500
22 Moda Ilkokulu, (1) 3.33 3.67 250 66 Kemal Ataturk Anadolu Lisesi, (2) 2.67 3.33 750 23 Mustafa Aykin Ilkokulu, (11) 2.33 2.67 750 67 Mustafa Saffet Anadolu Lisesi, (12) 2.00 2.33 250 24 Nihat Isik Ilkokulu, (2) 2.67 3.33 500 68 Tarman Anadolu Lisesi, (17)Suadiye Haci Mustafa 3.00 3.33 500 25 Resit Ilkokulu, (13)Ogretmen Harun 2.33 2.67 250 69 Istanbul Ataturk Fen Lisesi, (8) 2.67 3.00 500
Shortest road distances between each SA and TSA (in km) were obtained by utilizing Arcview 9.3 GIS software and Istanbul geographical database.
The mathematical model was written in “zpl” format with ZIMPL programming language, and solved with SCIP (Solving Constraint Integer Programs) Solver version 3.1, on an AMD 8 core 3.00 Gigahertz computer with 8 gigabyte RAM. SCIP is a noncommercial solver for mixed integer programming and mixed integer nonlinear programming and it is also a framework for constraint integer programming and branch-cut-and-price (SCIP 2018). Branch-branch-cut-and-price method is a combination of branch-and-price and branch-and-cut [39] research, potential shelter locations in a pilot area in
China were analyzed and 41% of potential shelter locations were determined to be school playgrounds. For model A (earthquake scenario 1) and C (earthquake scenario 2), risk factor of each SA was calculated, depending on the neighbor-hood it is located at, using the risk factor of neighborneighbor-hoods in Table 2. Shelter capacity of each SA was determined based on the size of its’ garden, since shelters are planned to be stored in standard transportation containers at the gardens of schools for storage and transportation convenience. In Table 4, 88 SA are presented along with their shelter capacities and calculated earthquake damage risk factors based on Model A and C.
Table 4: Continued.
ID (neigborhood)SA and RF-A RF-C Shelter capacity ID SA and (neighborhood) RF-A RF-C capacityShelter 26 Osmangazi Ilkokulu, (3) 3.33 3.67 250 70 Tumer Cok Programli Lisesi, 50.Yil Cumhuriyet Feridun
(14) 3.00 3.33 250
27 Ilkokulu, (21)Sener Birsoz 1.67 1.67 250 71 Ahmet Sani Gezici Lisesi Kiz Teknik ve Meslek Lisesi, (5) 2.00 2.33 250 28 Tansel Ilkokulu, (17)Turhan Mediha 2.33 2.67 250 72 General Ali Riza Ersin Teknik ve Endustri Meslek Lisesi, (5) 2.00 2.33 250 29 Ilkokulu, (16)Zihnipasa 2.33 2.67 250 73 Kadikoy Kiz Teknik ve Meslek Lisesi, (1) 3.33 3.67 250 30 Ilkokulu, (7)Zuhtupasa 3.33 3.33 250 74 Kadikoy Muhsin Adil Binal Ticaret Meslek Lisesi, (1) 3.33 3.67 250 31 Hanim Imam Hatip 23 Nisan Zehra
Ortaokulu, (18) 2.67 3.33 500 75
Kadikoy Ticaret Meslek
Lisesi, (13) 2.33 2.67 250
32 Mehmet Akif Imam Hatip Ortaokulu,
(20) 2.00 2.00 250 76
Mehmet Beyazid Anadolu
Saglik Meslek Lisesi, (10) 2.00 2.00 250 33 Ortaokulu, (1)Bahariye 3.33 3.67 500 77 Cocuklar Egt. Merkezi, (12)Hamit Ibrahimiye Otistik 2.00 2.33 250 34 Bostanci Ataturk Ortaokulu, (18) 2.67 3.33 500 78 Hayriye-Kemal Kusun Egt Uyg.Ok.ve Is Egt. M, (1) 3.33 3.67 250 35 Erenkoy Mehmet Sait Aydoslu
Ortaokulu, (16) 2.33 2.67 250 79
Mediha-Turhan Tansel Egt
Uyg.Ok.ve Is Eg. M, (16) 2.33 2.67 250 36 Faik Resit Unat Orta-okulu, (13) 2.33 2.67 250 80 Sohret Kursunoglu Ilkogretim Okulu ve Is Okulu, (20) 2.00 2.00 250 37 Ortaokulu, (16)Fehmi Eksioglu 2.33 2.67 500 81 Gozcubaba Imam Hatip Lisesi, (12) 2.00 2.33 250 38 Gazi Mustafa Kemal Pasa Ortaokulu, (2) 2.67 3.33 750 82 Intas Imam Hatip Lisesi, (16) 2.33 2.67 250 39 Goztepe H. Halil Turkkan
Ortaokulu, (12) 2.00 2.33 250 83
Kadikoy Erkek Anadolu
Imam Hatip lisesi, (6) 3.33 3.33 250 40 Ortaokulu, (13)Goztepe 2.33 2.67 250 84 Kadikoy Kiz Anadolu Imam Hatip Lisesi, (5) 2.00 2.33 250 41 Hakki Deger Orta-okulu, (19) 2.33 2.33 250 85 Marmara University Campus 1, (5) 2.00 2.33 1000 42 Ortaokulu, (13)Halil Turkkan 2.33 2.67 500 86 Marmara University Campus 2, (13) 2.33 2.67 2000 43 Ortaokulu, (10)Huseyin Ayaz 2.00 2.00 500 87 Marmara University Campus 3, (6) 3.33 3.33 1250 44 Yuksel Ortaokulu, (6)Ikbaliye Erdogan 3.33 3.33 250 88 Istanbul Medeniyet Universitesi, (10) 2.00 2.00 2000
relaxation is solved with a column generation approach and whenever one of the implicitly given variables improve the current LP solution, it is added explicitly to the problem methods. In branch-and-cut, the linear program (LP)
relaxa-tion of the sub-problems of branch-and bound is strengthened by cutting planes. In branch-and-price, at each node, the LP
Number of heavily damaged building: model A
Ağir Hasarli Binalarin ayisi: model A
Legend District boundary Highway Fault: Model A Number of building Heavily damaged model A No data 0–20 0 2 4 6 8 10 N E S W Km 20–50 50–100 100–200 200–500 Silivri Çatalca
Istanbul metropolitan municipality (IMM) Japan international cooperation agency (JICA)
Source : JICA study team In Istanbul including seismic microzonation In the republic of Turkey
The study on a disaster prevention/mitigation basic plan
Figure 1: Number of heavily damaged buildings in model A [1].
Number of heavily damaged building: model C
Ağir Hasarli Binalarin ayisi: model C
Legend District boundary Highway Fault: Model C Number of building Heavily damaged model C No data 0–20 20–50 50–100 100–200 200–500 0 2 4 6 8 N E S W Km Silivri Çatalca 100 10
Istanbul metropolitan municipality (IMM) Japan international cooperation agency (JICA)
Source : JICA study team In Istanbul including seismic microzonation The study on a disaster prevention/mitigation basic plan In the republic of Turkey
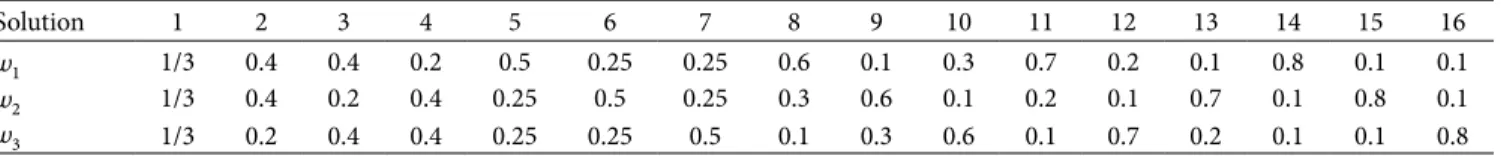
To determine representative efficient solutions of the prob-lem from the Pareto frontier, a group of 16 dispersed weight
vectors were generated in Table 6, where 𝑤𝑖> 0 are the weights
[40, 41]. For each event scenario, each objective function was individually minimized to obtain utopia and nadir points as seen in Table 5.
Legend District boundary Highway Fault: Model A
Seismic indensity (EMS-98) 9 8 7
Silivri
Çatalca
Seismic intesity : model A
0 2 4 6 8 N E S W
Km
Istanbul metropolitan municipality (IMM) Japan international cooperation agency (JICA)
Source : JICA study team In Istanbul including seismic microzonation In the republic of Turkey
10
10
The study on a disaster prevention/mitigation basic plan
Sismik iddet: model A
Figure 3: Seismic intensity in model A [1].
Seismic intesity : model C
Legend District boundary Highway Fault: Model C
Seismic indensity (EMS-98) 10 9 8 7 0 4 6 8 10 N E S W Km Silivri Çatalca 2
Istanbul metropolitan municipality (IMM) Japan international cooperation agency (JICA)
Source : JICA study team In Istanbul including seismic microzonation In the republic of Turkey
The study on a disaster prevention/mitigation basic plan
Sismik iddet: model C
Figure 5: Map of number of damaged buildings of Kadiköy for model A [1].
Figure 6: Seismic intensity map of Kadiköy for model A [1].
Figure 7: Map of number of damaged building of Kadiköy for model C [1].
Figure 8: Seismic intensity map of Kadiköy for model C [1]. Table 5: Utopia and nadir points for each event scenario.
Scenario 1 min𝑓1(𝑥) min𝑓2(𝑥) min𝑓3(𝑥) Scenario 2 min𝑓1(𝑥) min𝑓2(𝑥) min𝑓3(𝑥)
𝑓1(𝑥) 0 15.25 1450.63 𝑓1(𝑥) 0 15.25 1450.63 𝑓2(𝑥) 225.087 3.362 225.087 𝑓2(𝑥) 227.634 3.398 227.634 𝑓3(𝑥) 40179424 40179424 0 𝑓3(𝑥) 41719488 41719488 0 𝑓∗ 𝑖(𝑥) = 0 3.362 0 𝑓𝑖∗(𝑥) = 0 3.398 0 𝑓𝑛 𝑖(𝑥) = 1450.63 225.087 40179424 𝑓𝑖𝑛(𝑥) = 1450.63 227.634 41719488
Scenario 3 min𝑓1(𝑥) min𝑓2(𝑥) min𝑓3(𝑥) Scenario 4 min𝑓1(𝑥) min𝑓2(𝑥) min𝑓3(𝑥)
𝑓1(𝑥) 0 15.25 1450.63 𝑓1(𝑥) 0 15.25 1450.63 𝑓2(𝑥) 230.181 3.432 230.181 𝑓2(𝑥) 232.728 3.466 232.728 𝑓3(𝑥) 43259552 43259552 0 𝑓3(𝑥) 44799616 44799616 0 𝑓∗ 𝑖(𝑥) = 0 3.432 0 𝑓𝑖∗(𝑥) = 0 3.466 0 𝑓𝑛 𝑖(𝑥) = 1450.63 230.181 43259552 𝑓𝑖𝑛(𝑥) = 1450.63 232.728 44799616
a different weight vector to obtain 16 representative efficient (Pareto optimal) solutions of the problem from the Pareto frontier. In Table 7, these solutions are presented along with CPU times in seconds.
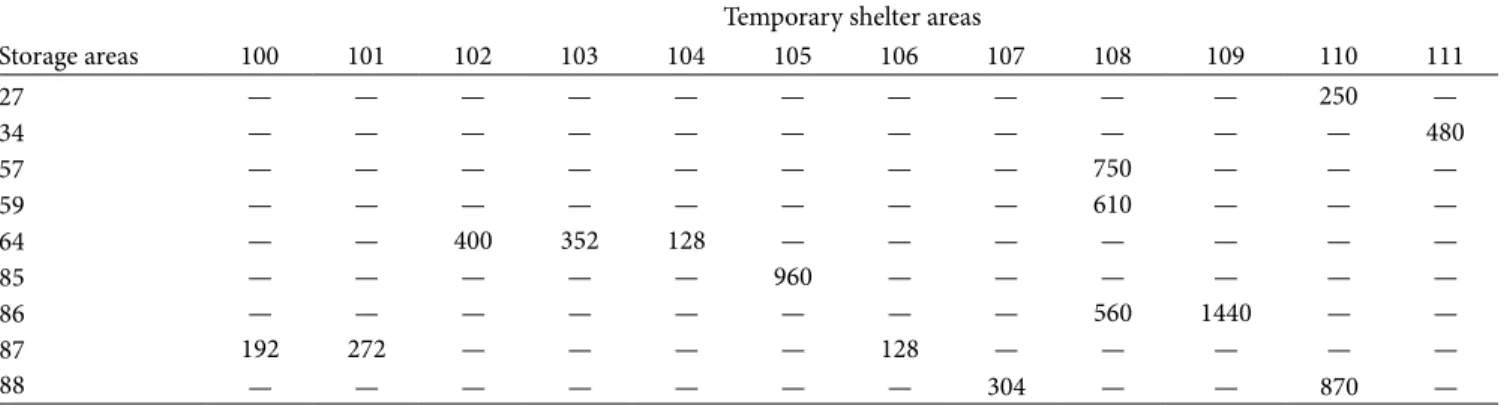
In Tables 8 and 9, shelter distribution plan of a sample efficient solution (solution number 10 of event scenario 3 in (Table 7) is presented for model A (earthquake scenario 1) and C (earthquake scenario 2). In these tables, expected
(∑𝑖w𝑖= 1 ). Same set of dispersed weight vectors were also
used in Samanlioglu’s research [42] to find representative effi-cient solutions. Readers can find methods for generating dis-persed weight vectors in Steuer’s research [43].
These weight vectors were then used in normalized (scaled) weighted sum formulation of this problem (14) to obtain sample efficient solutions of the Pareto front. For each event scenario, problem (14) was solved 16 times, each with
Table 6: 16 dispersed weight vectors.
Solution 1 2 3 4 5 6 7 8 9 10 11 12 13 14 15 16
𝑤1 1/3 0.4 0.4 0.2 0.5 0.25 0.25 0.6 0.1 0.3 0.7 0.2 0.1 0.8 0.1 0.1
𝑤2 1/3 0.4 0.2 0.4 0.25 0.5 0.25 0.3 0.6 0.1 0.2 0.1 0.7 0.1 0.8 0.1
𝑤3 1/3 0.2 0.4 0.4 0.25 0.25 0.5 0.1 0.3 0.6 0.1 0.7 0.2 0.1 0.1 0.8
Table 7: 16 representative efficient solutions from the Pareto frontier for each event scenario.
Scenario 1 Scenario 2
Sol. no z in (14) 𝑓1(𝑥) 𝑓2(𝑥) 𝑓3(𝑥) CPU z in (14) 𝑓1(𝑥) 𝑓2(𝑥) 𝑓3(𝑥) CPU
1 0.028 22.724 15.421 589526 32 0.029 16.528 20.318 146560 4 2 0.031 22.724 15.421 589526 284 0.033 22.748 15.522 1164400 58 3 0.020 13.97 20.55 73280 24 0.021 14.948 20.79 146560 67036 4 0.030 22.724 15.421 589526 6 0.034 16.528 20.318 146560 4 5 0.025 17.114 17.225 490780 205 0.025 14.948 20.79 146560 8 6 0.035 22.724 15.421 589526 79 0.038 22.748 15.522 1164400 7 7 0.023 15.554 20.149 73.280 4 0.023 15.554 20.149 146560 8010 8 0.027 18.604 16.158 697556 214 0.028 16.618 17.46 1084400 237 9 0.039 22.72 15.421 582200 5 0.042 22.748 15.522 1084400 3 10 0.011 14.25 22.225 0 4620 0.012 15.5 22.46 0 5521 11 0.022 16.66 17.225 589526 84 0.023 14.24 20.79 246760 42 12 0.010 14.25 22.225 0 5642 0.011 15.5 22.46 0 23325 13 0.043 22.724 15.421 582200 17 0.045 22.748 15.522 1084400 12 14 0.015 11.747 20.886 296380 4 0.016 11.198 23.858 165240 8 15 0.041 19.275 9.761 2129496 2 0.043 18.89 9.862 4258992 2 16 0.009 15.871 21.819 0 33447 0.009 17.134 21.819 0 1218 Scenario 3 Scenario 4
Sol. no z in (14) 𝑓1(𝑥) 𝑓2(𝑥) 𝑓3(𝑥) CPU z in (14) 𝑓1(𝑥) 𝑓2(𝑥) 𝑓3(𝑥) CPU
1 0.031 17.502 20.487 219840 34 0.031 18.476 20.656 293120 546 2 0.036 22.772 15.623 1746600 31 0.036 18.476 20.656 293120 5 3 0.022 17.571 22.157 20040 29774 0.021 18.568 22.326 0 26293 4 0.035 17.502 20.487 219840 169 0.035 18.476 20.656 293120 117 5 0.026 17.502 20.487 219840 534 0.027 18.476 20.656 293120 677 6 0.041 22.772 15.623 1746600 12 0.042 18.476 20.656 293120 3 7 0.024 18.33 22.157 0 14146 0.024 19.58 22.326 0 1493 8 0.029 18.152 17.157 1626600 53 0.030 18.602 18.19 1540944 90 9 0.046 22.772 15.623 1746600 6 0.048 18.88 20.656 293120 4 10 0.012 16.75 22.695 0 5382 0.012 18 22.93 0 25839 11 0.024 14.86 21.025 370140 10 0.024 15.48 21.26 493520 7 12 0.011 18.33 22.157 0 21512 0.011 19.688 22.326 0 31976 13 0.047 22.772 15.623 1746600 3 0.050 22.796 15.724 2328800 3 14 0.016 11.526 24.688 199800 42 0.017 12.168 24.924 266400 100 15 0.044 18.505 9.963 6398508 2 0.046 18.12 10.064 8517984 2 16 0.010 18.33 22.157 0 16030 0.010 19.58 22.326 0 5340
Due to the nature of stochastic multi-criteria decision problem, the decision process has strategic importance. Proposed results show that while some of the solutions remain persistent along changing event scenarios, some of them may change dramatically. For instance, solution 7 in Table 7 pro-vides solutions with fully satisfied demand for event scenarios 3 and 4 but there is unsatisfied demand for event scenarios 1 and 2. Figure 9 shows box plots and means of each objective quantities of shelters that will be shipped from selected SA and
TSA are given, and based on this sample efficient solution, all the shelter demands of TSA are satisfied for both earthquake
scenarios, which can also be confirmed by the 0 value of 𝑓3(𝑥)
in Table 7. Also, Tables 8 and 9 show that changes in demand between earthquake scenarios (model A and C) affect the dis-tribution process. The number of links between supply and demand points increase from 15 (model A) to 19 (model C).
Table 8: Expected distribution plan of 10th solution of scenario 3 if model A occurs (𝑋 𝑛𝑗1).
Temporary shelter areas
Storage areas 100 101 102 103 104 105 106 107 108 109 110 111 27 — — — — — — — — — — 250 — 34 — — — — — — — — — — — 480 57 — — — — — — — — 750 — — — 59 — — — — — — — — 610 — — — 64 — — 400 352 128 — — — — — — — 85 — — — — — 960 — — — — — — 86 — — — — — — — — 560 1440 — — 87 192 272 — — — — 128 — — — — — 88 — — — — — — — 304 — — 870 —
Table 9: Expected distribution plan of 10th solution of scenario 3 if model C occurs (𝑋 𝑛𝑗2).
Temporary shelter areas
Storage areas 100 101 102 103 104 105 106 107 108 109 110 111 27 — — — — — — — — — — 150 100 34 — — — — — — — — — — — 500 57 — — — — — — — — 750 — — — 59 — — — — — — — — 750 — — — 64 — — — 440 160 650 — — — — — — 85 240 — 500 — — — 160 — — — — — 86 — — — — — — — — 200 1800 — — 87 — 340 — — — 550 - 330 — — — — 88 — — — — — — — 50 700 — 1250 — 24 22 20 18 16 14 12 10 f1 (x) f2 (x) f3 (x) 8 6 4 2 0 0 5 10 15 20 25 9,000,000 8,000,000 7,000,000 6,000,000 5,000,000 4,000,000 3,000,000 2,000,000 1,000,000 0 1 2 3 Event scenario 4 1 2 3 Event scenario 4 1 2 3 Event scenario 4
of survivors rather than budget issues, however if there are also strict budget limitations, storage and distribution costs should be included in the model besides penalty cost for unsatisfied demand. Also, as part of future research direction, in the model, minimization of total distribution time, and the effects of pos-sible traffic and road closures may be taken into consideration.
Data Availability
The data needed is in the manuscript and no other data is available.
Conflicts of Interest
The authors declare that they have no conflicts of interest.
References
[1] JICA, “The study on disaster prevention/mitigation basic plan,” vol. 16, no. 12, pp. 899–900, 2002, https://www.preventionweb. net/go/43027.
[2] K. Sinasi, L. Gary, and P. J. Curran, “Displaying earthquake damage in an urban area using a vegetation–ous–soil model and remotely sensed data,” in Proceedings of the International
Society for Photogrammetry and Remote Sensing Conference,
pp. 634–638, 2004.
[3] M. Sahin and E. Tari, “The august 17 kocaeli and the november 12 duzce earthquakes in Turkey,” Earth, Planets and Space, vol. 52, no. 10, pp. 753–757, 2000.
[4] R. Logendran and M. P. Terrell, “Uncapacitated plant location-allocation problems with price sensitive stochastic demands,”
Computers & Operations Research, vol. 15, no. 2, pp. 189–198,
1988.
[5] F. V. Louveaux and D. Peeters, “A dual-based procedure for stochastic facility location,” Operations Research, vol. 40, no. 3, pp. 564–573, 1992.
[6] G. Laporte, F. V. Louveaux, and L. van Hamme, “Exact solution to a location problem with stochastic demands,” Transportation
Science, vol. 28, no. 2, pp. 95–103, 1994.
[7] S. M. Mousavi and S. T. A. Niaki, “Capacitated location allocation problem with stochastic location and fuzzy demand: a hybrid algorithm,” Applied Mathematical Modelling, vol. 37, no. 7, pp. 5109–5119, 2013.
[8] Yolanda M. Carson and Rajan Batta, “Locating an ambulance on the amherst campus of the state university of New York at buffalo,” Interfaces, vol. 20, no. 5, pp. 43–49, 1990.
[9] A. M. Mestre, M. D. Oliveira, and A. P. Barbosa-Póvoa, “Location-allocation approaches for hospital network planning under uncertainty,” European Journal of Operational Research, vol. 240, no. 3, pp. 791–806, 2014.
[10] D. P. Michalopoulos, D. P. Morton, and J. W. Barnes, “Prioritizing network interdiction of nuclear smuggling,” in Stochastic
Programming, vol. 4, pp. 313–346, 2012.
[11] H. L. Khoo and L. E. Teoh, “An optimal aircraft fleet management decision model under uncertainty,” Journal of Advanced
Transportation, vol. 48, no. 7, pp. 798–820, 2014.
[12] N. Altay and W. G. Green, “OR/MS research in disaster operations management,” European Journal of Operational
Research, vol. 175, no. 1, pp. 475–93, 2006.
function against event scenario probabilities. Objective func-tion 2 (total expected earthquake damage risk factor) is sensi-tive to scenario probabilities since there is an increase in mean and median values with respect to event scenarios. On the other hand, for objective function 1, it can be concluded that the mean of the total expected distribution distance is not sen-sitive to scenario probabilities. Additionally, all of the objective functions are sensitive to event scenario probabilities in terms of variance within the results of objective functions.
4. Conclusions
In this study, a stochastic multi-objective mixed integer math-ematical model for the location and distribution decisions in an earthquake relief network was developed. The model includes some aspects that can be seen in the literature; however, none of the existing models in the relief network literature simulta-neously include decisions related to: pre-earthquake shelter storage at SA and post-earthquake shelter distribution from SA to TSA while taking into consideration storage capacity restric-tions, earthquake scenario dependent demand, earthquake damage risk factor of SA, and coverage distance restrictions.
In this paper, three potentially conflicting significant cri-teria that needs to be minimized simultaneously were pre-sented. These are; minimization of total expected distribution distance between SA and TSA, minimization of total expected earthquake damage risk factor of SA, and minimization of total expected unsatisfied demand penalty cost of TSA. To obtain efficient solutions from the Pareto frontier, as the mul-ti-criteria decision making method, normalized (scaled) weighted summethod was implemented for its simplicity. For each event scenario, representative Pareto optimal solutions for the problem were obtained, by generating dispersed weight vectors and solving the problem each time with different weight vectors. In reality, these weights are assigned to each objective function depending on decision-makers’ prefer-ences, specifically importance they give to each objective.
The model was implemented in a pilot area; Kadikoy municipality of Istanbul, Turkey and based on these results, suggestions were made to the municipality. While some assumptions were made due to a lack of some information, in the implementation, many real-life aspects of the earthquake relief network were considered and realistically implemented in the model. In the implementation, 12 TSA and 88 SA were taken into consideration and related data was obtained from Kadikoy municipality of Istanbul, IMM, and JICA report [1]. In the application, four event scenarios with two earthquake scenarios (model A and C presented in JICA report [1]), hav-ing different likelihoods, were created. Mathematical model was written with ZIMPL programming language and solved by SCIP Solver. The computational effort is reasonable since this problem is a multi-criteria strategic decision making prob-lem which will be solved infrequently.
For future research, to solve larger problems in a shorter time, an efficient heuristic may be developed. In the mathemat-ical model, minimization of total storage and distribution costs were not taken into consideration since for relief networks, gen-erally priority is given to improving the temporary life quality
Research Part E: Logistics and Transportation Review, vol. 46,
no. 1, pp. 1–17, 2010.
[30] H. O. Mete and Z. B. Zabinsky, “Stochastic optimization of medical supply location and distribution in disaster management,” International Journal of Production Economics, vol. 126, no. 1, pp. 76–84, 2010.
[31] J. Zhang, M. Dong, and F. Frank Chen, “A bottleneck steiner tree based multi-objective location model and intelligent optimization of emergency logistics systems,” Robotics and Computer-Integrated
Manufacturing, vol. 29, no. 3, pp. 48–55, 2013.
[32] Ali Bozorgi-Amiri, M. S. Jabalameli, and S. M. J. Mirzapour Al-e-Hashem, “A Multi-ojective rbust sochastic pogramming mdel for dsaster relief logistics under uncertainty,” OR Spectrum, vol. 35, no. 4, pp. 905–33, 2013.
[33] M. Najafi, K. Eshghi, and W. Dullaert, “A multi-objective robust optimization model for logistics planning in the earthquake response phase,” Transportation Research Part E: Logistics and
Transportation Review, vol. 49, no. 1, pp. 217–249, 2013.
[34] F. Liberatore, M. T. Ortuño, G. Tirado, B. Vitoriano, and M. P. Scaparra, “A hierarchical compromise model for the joint optimization of recovery operations and distribution of emergency goods in humanitarian logistics,” Computers and
Operations Research, vol. 42, pp. 3–13, 2014.
[35] J.-D. Hong, K.-Y. Jeong, Y. Xie, and Management Engineering, “A multi-objective approach to planning in emergency logistics network design,” International Journal of Industrial Engineering, vol. 22, no. 4, pp. 412–25, 2015.
[36] S. Tofighi, S. A. Torabi, and S. A. Mansouri, “Humanitarian logistics network design under mixed uncertainty,” European
Journal of Operational Research, vol. 250, no. 1, pp. 239–250,
2016.
[37] A. Moreno, D. Alem, D. Ferreira, and A. Clark, “An effective two-stage stochastic multi-trip location-transportation model with social concerns in relief supply chains,” European Journal
of Operational Research, vol. 269, no. 3, pp. 1050–1071, 2018.
[38] R. T. Marler and J. S. Arora, “The weighted sum method for multi-objective optimization: new insights,” Structural and
Multidisciplinary Optimization, vol. 41, no. 6, pp. 853–862, 2010.
[39] W. Chen, G. Zhai, C. Ren, Y. Shi, and J. Zhang, “Urban resources selection and allocation for emergency shelters: in a multi-hazard environment,” International Journal of Environmental
Research and Public Health, vol. 15, no. 6, 2018.
[40] G. Gamrath, ““Generic branch-cut-and-price”. Master’s Thesis,”
Institut Für Mathematik, Technischen Universitat Berlin, http://
scholar.google.com/scholar?hl=en&btnG=Search&q=intitle:G eneric+Branch-Cut-and-Price#2, 2010.
[41] J. Desrosiers and M. E. Lübbecke, ““Branch-price-and-cut algorithms”,” Wiley Encyclopedia of Operations Research and
Management Science (EORMS), 2011.
[42] F. Samanlioglu, “A multi-objective mathematical model for the industrial hazardous waste location-routing problem,” European
Journal of Operational Research, vol. 226, no. 2, pp. 332–340, 2013.
[43] R. E. Steuer, Multiple Criteria Optimization: Theory,
Computation, and Application. Wiley Series in Probability and Mathematical Statistics, Wiley, 1986, https://books.google.com.
tr/books?id=2YxeAQAACAAJ. [13] Aakil M. Caunhye, Xiaofeng Nie, and Shaligram Pokharel,
“Optimization models in emergency logistics: a literature review,” Socio-Economic Planning Sciences, vol. 46, no. 1, pp. 4–13, 2012.
[14] A. M. Anaya-Arenas, J. Renaud, and A. Ruiz, “Relief distribution networks: a systematic review,” Annals of Operations Research, vol. 223, no. 1, pp. 53–79, 2014.
[15] E. Grass and K. Fischer, “Two-stage stochastic programming in disaster management: a literature survey,” Surveys in Operations
Research and Management Science, vol. 21, no. 2, pp. 85–100,
2016.
[16] A. Trivedi and A. Singh, “Facility location in humanitarian relief: a review,” International Journal of Emergency Management, vol. 14, no. 3, pp. 213–232, 2018.
[17] G. Barbarosoǧlu and Y. Arda, “A Two-stage stochastic programming framework for tansportation panning in dsaster response,” Journal of the Operational Research Society, vol. 55, no. 1, pp. 43–53, 2004.
[18] E. S. Chia, “Engineering disaster relief,” in IEEE International
Symposium on Technology and Society, November 2006.
[19] W. Yi and L. Özdamar, “A dynamic logistics coordination model for evacuation and support in disaster response activities,”
European Journal of Operational Research, vol. 179, no. 3,
pp. 1177–1193, 2007.
[20] B. Balcik and B. M. Beamon, “Facility location in humanitarian relief,” International Journal of Logistics Research and
Applications, vol. 11, no. 2, pp. 101–21, 2008.
[21] C. G. Rawls and M. A. Turnquist, “Pre-positioning of emergency supplies for disaster response,” Transportation Research Part B:
Methodological, vol. 44, no. 4, pp. 521–534, 2010.
[22] Serhan Duran, Marco A. Gutierrez, and Pinar Keskinocak, “Pre-positioning of emergency items for care international,”
Interfaces, vol. 41, no. 3, pp. 223–37, 2011.
[23] L. B. Davis, F. Samanlioglu, X. Qu, and S. Root, “Inventory planning and coordination in disaster relief efforts,”
International Journal of Production Economics, vol. 141, no. 2,
pp. 561–573, 2013.
[24] J. A. Paul and L. MacDonald, “Location and capacity allocations decisions to mitigate the impacts of unexpected disasters,”
European Journal of Operational Research, vol. 251, no. 1,
pp. 252–263, 2016.
[25] F. Cavdur, M. Kose-Kucuk, and A. Sebatli, “Allocation of temporary disaster response facilities under demand uncertainty: an earthquake case study,” International Journal
of Disaster Risk Reduction, vol. 19, pp. 159–66, 2016.
[26] E. Celik, N. Aydin, and A. T. Gumus, “A stochastic location and allocation model for critical items to response large-scale emergencies: a case of Turkey,” International Journal of
Optimization & Control: Theories & Applications, vol. 7, no. 1,
pp. 1–15, 2017.
[27] R. Maharjan and S. Hanaoka, “Warehouse location determination for humanitarian relief distribution in Nepal,”
Transportation Research Procedia, vol. 25, pp. 1151–1163, 2017.
[28] A. Mohamadi and S. Yaghoubi, “A Bi-objective stochastic model for emergency medical services network design with backup services for disasters under disruptions: an earthquake case study,” International Journal of Disaster Risk Reduction, vol. 23, pp. 204–217, 2017.
[29] J. B. Sheu, “Dynamic relief-demand management for emergency logistics operations under large-scale disasters,” Transportation
International Journal of
Aerospace
Engineering
Hindawi www.hindawi.com Volume 2018Robotics
Journal of Hindawi www.hindawi.com Volume 2018 Hindawi www.hindawi.com Volume 2018Active and Passive Electronic Components VLSI Design Hindawi www.hindawi.com Volume 2018 Hindawi www.hindawi.com Volume 2018
Shock and Vibration Hindawi
www.hindawi.com Volume 2018
Civil Engineering
Advances inAcoustics and VibrationAdvances in Hindawi
www.hindawi.com Volume 2018
Hindawi
www.hindawi.com Volume 2018
Electrical and Computer Engineering Journal of Advances in OptoElectronics Hindawi www.hindawi.com Volume 2018
Hindawi Publishing Corporation
http://www.hindawi.com Volume 2013 Hindawi www.hindawi.com
The Scientific
World Journal
Volume 2018 Control Science and Engineering Journal of Hindawi www.hindawi.com Volume 2018 Hindawi www.hindawi.com Journal ofEngineering
Volume 2018Sensors
Journal of Hindawi www.hindawi.com Volume 2018 Hindawi www.hindawi.com Volume 2018 Modelling & Simulation in Engineering Hindawi www.hindawi.com Volume 2018 Hindawi www.hindawi.com Volume 2018 Chemical EngineeringInternational Journal of Antennas and
Propagation International Journal of Hindawi www.hindawi.com Volume 2018 Hindawi www.hindawi.com Volume 2018 Navigation and Observation International Journal of Hindawi www.hindawi.com Volume 2018

![Figure 2: Number of heavily damaged buildings in model C [1].](https://thumb-eu.123doks.com/thumbv2/9libnet/4336077.71598/9.900.132.770.591.1023/figure-number-heavily-damaged-buildings-model-c.webp)
![Figure 4: Seismic intensity in model C [1].](https://thumb-eu.123doks.com/thumbv2/9libnet/4336077.71598/10.900.133.772.598.1026/figure-seismic-intensity-in-model-c.webp)
![Figure 6: Seismic intensity map of Kadiköy for model A [1].](https://thumb-eu.123doks.com/thumbv2/9libnet/4336077.71598/11.900.81.438.107.400/figure-seismic-intensity-map-kadiköy-model.webp)