978-1-5386-1887-5/17/$31.00 ©2017 IEEE
Fuzzy Logic for Decision Extraction from Product
Reviews
Mhd Tahssin Altabbaa, Tarik Ayabakan, Arif Selcuk Ogrenci
Electrical-Electronics EngineeringKadir Has University Istanbul, Turkey
{tahsin.altabbaa, tarik.ayabakan, ogrenci}@khas.edu.tr
Abstract— Most of manufacturers and merchants sell their
products via internet websites where customers buy them and write their reviews regarding the purchased product. These reviews carry a lot of information. Prospective customers are heavily interested in the experience of the predecessor customers where enormous number of reviews are offered by the website per product. In this study, given a dataset of reviews, we give a solution to estimate a total score of sentiment for the product reviewed. For this purpose, fuzzy logic is used to process the subjective comments and to obtain a reliable average estimation for the decision from those individual reviews. The method is executed over different models to search the effects of the frequency of features on the outcome.
Keywords—sentiment; product reviews; fuzzy inference.
I. INTRODUCTION
Recently, the demand of e-commerce is growing and product reviews written by customers give an important feedback for prospective customers making their decision about the purchase [1]. Consequently, popular products may get thousands of reviews. Moreover, many reviews are unnecessarily long, they contain only a few sentences related to the customer’s opinion about the product, which makes it hard for both customer and seller to browse all reviews and figure out the overall customer satisfaction [2].
For more than ten years, many researchers and companies’ research departments are studying on this problem, where they defined it by a common term called Sentiment Analysis (SA). SA is the process that analyzes people’s opinions, attitudes or emotions towards such a product, movie, event etc. [3]. There exist different methods used in SA. Pang and Lee [4], Kumar and Vadlamani [1] published extensive surveys studying hundreds of papers by covering applications, major tasks and methods for sentiment analysis. Fuzzy logic or fuzzy inference system, is one of the methods used in SA. Andreevskaia and Bergler in [5] designed a fuzzy model of English words that carries sentiment information. They’ve assigned fuzzy sentiment tags to all words in WordNet dataset by using their model. Rahmath and Ahmad in [6] used fuzzy logic to compute fuzzy score of the product in their data set. They declared that fuzzy set theory is very useful to model the basic fuzziness between polarity classes. Authors of [7] showed that
fuzzy logic is applicable to represent Turkish emotion related words. They used 171 Turkish words translated from English and added 26 synonyms to get a dataset. Then they analyzed their membership functions to make a decision and to get a solution. Nadali and Murad in [8] proposed a method to determine the satisfaction range of customer reviews. They proposed a new classifier called Fuzzy Semantic Classifier (FSC) and classified eight data sets in different classes such as very strong, strong, moderate, weak and very weak, positive and negative to make review more clear and easy to understand. Authors of [9] compared performance of fuzzy set theory with other methods based on vector representation in the area of automatic sentiment analysis. They also stated that fuzzy logic is good in defining uncertainties in sentiments. Authors of [10] studied document clustering by applying Fuzzy C-Means Clustering method which is proposed by authors of [11]. They applied this method to a pre-classified dataset and clustered documents with a degree of membership to each topic of the documents.
In this study, we try to give a benchmark for dealing with a fuzzy model in computing the overall customer sentiment for a product. The dataset selected was pre-processed by Bing Liu [2]. More details about the dataset are given in Section-II. The methodology and the fuzzy models are represented in Section-III. Simulation results are represented and discussed in Section-IV. Section-V concludes the paper and suggests topics for future work.
II. DATASET
The dataset used in this paper is taken from the website of the author of [2], where the authors have taken reviews of two digital cameras, one DVD player, one Mp3 player, and one mobile phone from amazon.com and cnet.com. Firstly, the dataset is cleaned and all HTML tags are removed. Then, the authors used “Part Of Speech” (POS) tags in order to prepare them for feature selection. After feature selection, all features were graded that corresponds to how good/bad the product is. The grades representing the sentiments are integers in the range of [-3, +3], where (-3) represents that the customer found this feature very bad, and (+3) is the opposite of that. The aforementioned procedure was applied both manually and by their proposed algorithm, where they’ve shown that the
International Conference on Energy, Communication, Data Analytics and Soft Computing (ICECDS-2017)
algorithm has a high accuracy. Since the dataset is given along with its features and their grades, in our pre-processing part, we only discarded the reviews that have no features.
III. METHODOLOGY
The main purpose of this paper is to build a fuzzy system that analyzes product reviews. We know that the evaluation of reviews supplied by customers about a product is a subjective task. It is hard to give a certain satisfaction degree according to their experiences. For this reason, we propose three different fuzzy models in order to find the sentiment about a product and help prospective customers making the correct decision.
Firstly, we construct our dataset matrix, where its columns consist of the features given in the dataset, and its rows are set for the reviews, where for each review row, the grades are taken from the dataset and inserted into the matrix at its corresponding feature column. If a feature is mentioned more than once in a review, the corresponding grades are averaged and inserted into our dataset matrix. The format of our dataset matrix can be shown in Table I.
Moreover, in this paper, we don’t consider omitting features that have low frequency from our dataset; instead, we group our features into five equally spaced groups according to their frequency, then we assign weights and multiply the grade given in each feature with the weight that corresponds to the frequency of that feature, as shown in Table II. The idea behind this approach is that the features with low frequency won’t get much strength on the output, and the features with higher frequency have a higher strength on the output and can give a better product understanding. After multiplying the weights with their corresponding features in our dataset matrix, we average each review row and each feature column, and we take the average of each one of them to be inserted into our fuzzy system.
TABLE I.REPRESENTATION OF THE DATASET MATRIX
Rev\Feat feature-1 feature-2 ... feature-M
Review-1
Review-2
:
Review-N
TABLE II. WEIGHTS ASSIGNED FOR CLASSES OF FEATURE FREQUENCIES
Weight Frequency 1 Highest 0.8 High 0.6 Medium 0.4 Low 0.2 Lowest
TABLE III. PRODUCT QUALITY OUTPUT RANGES
Letter Word Range (%)
W Worst 0 - 20
B Bad 21 - 40
A Average 41 - 60
G Good 61 - 80
E Excellent 81 - 100
In the following sections, we show our proposed fuzzy models generated by fuzzy logic toolbox in MATLAB. In the first two models, the averaged values of reviews and features are used, where they vary within the range [-3, +3], whereas in the third model, no averaging is used. Instead, we use our original dataset matrix and extract the number of positive and negative features and insert them into our model. The output of the fuzzy system for all proposed models that represents the overall product quality is divided into five groups as follows {W, B, A, G, E}corresponding to Worst, Bad, Average, Good, and Excellent, respectively, with equally spaced ranges, as shown in Table III.
A. Model-I
Our fuzzy model’s membership function is presented in Fig. 1, where three ranges are considered: [Negative, Neutral, Positive] for both inputs of the fuzzy system, namely, average of the weighted reviews and the average of the weighted features. The rule table used by the fuzzy system for Model-1 is represented in Table IV.
Fig. 1 Membership function of Model-1.
TABLE IV. RULE TABLE FOR MODEL-I Average feature/ review N Z P
N W B A
Z B A G
P A G E
International Conference on Energy, Communication, Data Analytics and Soft Computing (ICECDS-2017)
Fig. 2 Membership function of Model-II
TABLE V. RULE TABLE FOR MODEL-II
Average feature/ Review NN N Z P PP
NN W W B B A NN W W B A G Z B B A G G P B A G E E P A G G E E B. Model-II
In this model, we enlarge our membership function at the input to include five different ranges denoted by [A lot Negative, Negative, Neutral, Positive, A lot Positive]; our membership function for this model is represented in Fig. 2. The rule table used in Model-II is represented in Table V. The rule table used in Model-II is represented in Table V.
C. Model-III
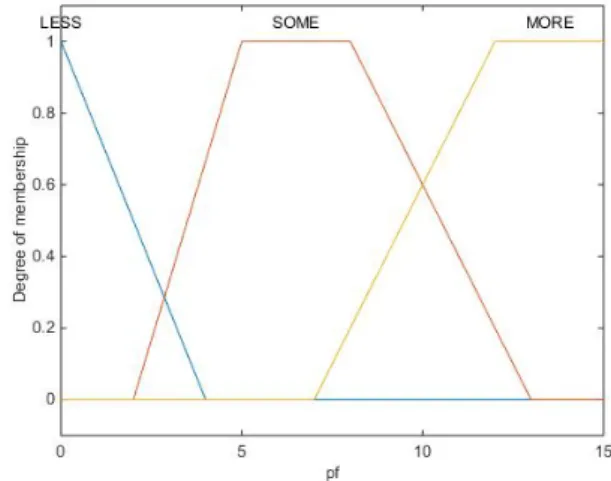
In this model, we ignore the grade of each feature, and we only deal with the polarity of the features regardless their frequency. In addition, the positive and negative number of features are scaled in order to fit into the range [0, 15]. The membership function of this fuzzy model is shown in Fig. 3, and it consists of the following ranges [LESS, SOME, MORE], where the rule table is shown in Table VI.
TABLE VI. RULE TABLE FOR MODEL-III
Negative\positive
feature L S M
L A B W
S G A B
M E G A
Fig. 3 Membership function of Model-III
IV. SIMULATION RESULTS
In this section, we display the outcomes of the three proposed models for fuzzy inference. Firstly, the dataset matrix has been set up in MATLAB, then MATLAB Fuzzy Logic Toolbox has been used in order to get the results. Table VII shows the output regarding each product together with the total number of reviews and features. For example, the row for Camera1 indicates that there are 43 features mentioned in 82 reviews. Our fuzzy inference system calculates the total customer sentiment of satisfaction to be 61%, 60% and 76% for the three models, respectively.
The enlargement of the membership function at the input of Model-II gives close results to the one in Model-I, where Model-III seems to be slightly generous in estimating the sentiment for the satisfaction level. Since the results of Model-I and Model-Model-IModel-I show the features after being weighted, we redo the simulation in such a way that, we give lower weights for features with lower frequency, and we keep the same weight for the highest frequency as shown in Table VIII. In this way, we try to strengthen the weight of features available in a large proportion of reviews and the rarely mentioned features are suppressed.
TABLE VII. RESULTS USING WEIGHT RANGE OF [0.2,0.4,0.6,0.8,1]. Model
Product Mod-1 (%) Mod-2 (%) Mod-3 (%) No. of feat of revNo. Camera1 61 60 76 43 82 Camera2 68 63 83 34 54
DVD player 56 57 60 98 88
Mob. phone 61 60 77 93 151
Mp3 player 60 60 80 38 90
International Conference on Energy, Communication, Data Analytics and Soft Computing (ICECDS-2017)
TABLE VIII. WEIGHTS ASSIGNED FOR CLASSES OF FEATURE FREQUENCIES Weight Frequency 1 Highest 0.4 High 0.3 medium 0.2 Low 0.1 Lowest
The results of the aforementioned weights for Model-I and Model-II are shown in Table IX, where we notice that features of low frequencies do not have an impact on the overall outcome for the decision. This is evident by the fact that the average sentiment values do not vary much among those two methods as can be seen in Tables VII and IX.
V. CONCLUSION
The growing demand on a robust model for sentiment analysis became significant. According to the models stated in this paper, adjustments of weights using fuzzy rules that depend on the frequency of the features can be studied together with the amount of features mentioned in the review. This approach can be used to generate a meaningful sentiment score for the satisfaction level. In addition, as a future work, applying a well-known Fuzzy C-Means (FCM) clustering method for each review can provide a reliable solution regarding the main decision of each review. Currently, we are working on different datasets of reviews to validate the approach of the paper. This approach can also be used to validate the ratings supplied by the customer for a specific product.
TABLE IX. RESULTS USING WEIGHT RANGE OF
[0.1,0.2,0.3,0.4,1].
Prod \ model Model-1 (%) Model-2 (%) Camera1 61 60 Camera2 67 62 DVD player 60 60 Mob. phone 60 60 Mp3 player 60 60
References
[1] K. Ravi and V. Ravi, "A survey on opinion mining and sentiment analysis: Tasks, approaches and applications,” Knowledge Based Systems, vol. 89, pp. 14-46, November 2015.
[2] M. Hu and B. Liu, "Mining and summarizing customer reviews," Proc. of the tenth ACM SIGKDD international conference on knowledge discovery and data mining (KDD '04), pp. 168-177, 2004.
[3] B. Liu, Sentiment Analysis and Opinion Mining, Morgan & Claypool Publishers, 2012.
[4] B. Pang and L. Lee, "Opinion mining and sentiment analysis," Foundation Trends Information Retrieval, vol. 2, pp.1-135, 2008. [5] A. Andreevskaia and S. Bergler, "Mining wordnet for fuzzy sentiment:
Sentiment tag extraction from wordnet glosses," Proc. of Fuzzy Systems Conference, FUZZ-IEEE, 2006.
[6] K. Indhuja and R. P. C. Reghu, "Fuzzy logic based sentiment analysis of product review documents," Proc. First International Conference on Computational Systems and Communications (ICCSC), pp. 18-22, 2014. [7] O. Cakmak, A. Kazemzadeh, and S. Yildirim, "Using Interval Type-2 Fuzzy Logic to Analyze Turkish Emotion Words," Proc. of APSIPA Annual Summit and Conference, 2012.
[8] S. Nadali and M.A. Azmi Murad, "Fuzzy Semantic Classifier to Determine the Strength Levels of Customer Product Reviews," Proc. of Int. Conf. on Advances in Computer Science and Application, 2012. [9] F. Dzogang, M. J. Lesot, M. Rifqi, and B. Bouchon-Meunier,
"Expressions of graduality for sentiments analysis — A survey," IEEE International Conference on Fuzzy Systems (FUZZ), pp. 1-7, 2010. [10] S. Goswami and M.Shishodia , “A Fuzzy Based Approach To Text
MÕnÕng And Document Clustering,” International Journal of Data Mining & Knowledge Management, vol. 5(3), pp. 43-52, May2013. [11] J.C. Bezdek, R. Ehrlich and W. Full, "FCM—the Fuzzy C-Means
clustering-algorithm," Computers & Geosciences, vol. 10(2-3), pp. 191-203, December 1984.
International Conference on Energy, Communication, Data Analytics and Soft Computing (ICECDS-2017)