Detection of Trojans in Integrated Circuits
Selçuk Baktır
Department of Computer Engineering Bahçeşehir University
Istanbul, Turkey [email protected]
Tansal Güçlüoğlu, Atilla Özmen,
Hüseyin Fuat Alsan and Mustafa Can Macit
Electronics Engineering Department Kadir Has University
Istanbul, Turkey
[email protected], [email protected]
Abstract— This paper presents several signal processing
approaches in Trojan detection problem in very large scale integrated circuits. Specifically, wavelet transforms, spectrograms and neural networks are used to analyze power side-channel signals. Trojans in integrated circuits can try to hide themselves and become almost invisible due to process and measurement noises. We demonstrate that our initial results with these techniques are promising in successful detection. Discrete wavelet transforms and spectrograms can provide clear visual assistance in detecting Trojans by catching the time-scale differences and time-frequency activities introduced by the Trojans. Furthermore, neural networks with sufficient training are also used and simulation results show that correct decisions are possible with a very high success rate.
Keywords- Trojan detection; wavelet transform; spectrogram; neural networks
I. INTRODUCTION
Integrated circuit (IC) manufacturers are increasingly outsourcing their manufacturing facilities to low-cost overseas countries due to economic reasons. This results in a lack of control in the manufacturing process and poses the significant risk of hidden Trojan circuitry inserted into the ICs, such as application specific integrated circuits (ASIC) or even general-purpose microprocessors, digital signal processing (DSP) chips or field programmable gate array (FPGA) bit-streams, that may be used in critical military or financial applications [1,2].
Trojan ICs can be classified according to their physical, activation or action characteristics. Physically, a Trojan IC can be inserted by the addition of extra gates or by just modifying the geometry of the physical components inside the IC to degrade its reliability leading to a potential failure of operation. A Trojan inserted into an IC can be concentrated on a specific region in the IC, or it can be spread around which makes it harder to detect. Trojan ICs can be activated either internally by a specific value of a register or data bus or externally by a specific bit pattern received through a data-bus/antenna or triggered by a sensor monitoring an environmental condition such as temperature, humidity, electromagnetic interference, etc. Finally, when activated, the hidden Trojan circuitry could shut down the original circuit disrupting its operation or leak confidential information such as the secret-key in a cryptographic circuit.
There are a number of possible approaches for detecting inserted Trojan ICs. The first one is failure analysis techniques [3] which use technologies such as scanning optical
microscopy, electron microscopy, etc., for detection of failures in ICs, mostly causing destruction of the IC. Unlike in IC failure analysis where destructively testing a small set of sample ICs may give an idea about the correct functionality of the larger set, it is not practical to destructively test each and every IC for detecting possible hidden Trojans. Hence, these techniques are not practical in the Trojan detection scenario. Another technique for failure detection in ICs is automatic test pattern generation [4] where a defect may be detected by applying a stimulus and inspecting the output of the digital circuit. Again, for Trojan IC detection, this approach would be ineffective since a Trojan IC would stay dormant inside the IC until activated by its trigger condition and would not respond to functional tests. The most effective techniques for Trojan IC detection have been those based on side-channel analysis which exploits side-channel signals such as power [5-11] and timing delay [11-13]. For a comprehensive survey on the classification of Trojan circuitry, as well as techniques to detect them, the reader is referred to [14].
Our circuit characterization and Trojan detection technique uses the following IC fingerprinting methodology originally introduced in [5]:
1. As reference ICs, pick a small number ICs at random from a family of ICs with the same mask and manufactured in the same fab.
2. Run sufficient I/O tests on the reference ICs so as to exercise all of their expected circuitry and collect their power side-channel signals during these tests.
3. Obtain a characterization of the IC family using these power side-channel signals, e.g. using certain signal processing techniques.
4. Destructively test the picked ICs to validate they are Trojan-free.
5. All other ICs from the same family can now be non-destructively validated by characterizing them using the same signal processing techniques and comparing to the characterization of the validated Trojan-free ICs.
In this paper, we present the efficacy of some signal processing techniques such as the discrete wavelet transform (time scale analysis) in Section II and spectrograms (time-frequency analysis) in Section III. Section IV presents the application and performance results of a neural network for the detection of Trojan circuitry hidden inside a genuine IC.
This work was supported by the grants EU FP7 Marie Curie IRG 256544 and TÜBİTAK 110E182.
II. TESTBED AND SIDE-CHANNEL SIGNALS
For testing the efficacy of our proposed technique, we consider an internally activated Trojan circuit that acts like a time-bomb and disrupts circuit behavior when a certain amount of time has elapsed. We use a 16-bit counter Trojan as our time-bomb in a cryptographic circuit implementing the RSA [15] algorithm.
This Trojan circuit, with 406 2-input NAND gates, occupies 1.4% of the original circuit with 27909 2-input NAND gates. We obtained the side-channel power signals through gate-level power simulations and introduced +/-2% random variations in the technology library for synthesis to emulate the process noise. For the syntheses of the ICs, we used Synopsys Core Synthesis Tools [16] with the 0.13µm, 1.0V technology library tcb0131vhptc of Taiwan Semiconductor Manufacturing Company (TSMC) and for gate-level simulation of their power consumption we used Synopsys Prime Power Stand Alone [17]. We synthesized 8 genuine ICs and 8 ICs with Trojans using 16 different technology libraries (with inserted +/-2% process noise) and obtained simulated power signals for these 16 ICs to use in our tests.
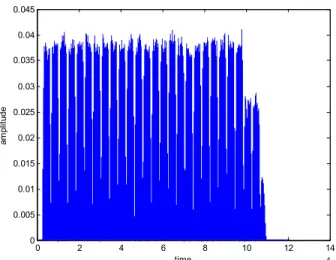
We used 16 side-channel signals, 8 of them belonging to the ICs without any Trojans labeled as IC1, IC2,…, IC8 and the rest belonging to the ICs with Trojans labeled as IC9-IC16. Fig. 1 shows the signal for IC1 which does not contain any Trojan activity. Fig. 2 shows the power side-channel signal for IC9 containing Trojan activity. In both figures, the x-axis shows the time index and y-axis shows the amplitude. The signals for IC1 and IC9 look highly similar, therefore it is impossible to distinguish the circuit with Trojan by just observing the time domain power signals. This is true especially when there is considerable noise due to measurement or manufacturing processes.
0 2 4 6 8 10 12 14 x 104 0 0.005 0.01 0.015 0.02 0.025 0.03 0.035 0.04 0.045 time am pl itud e 0 2 4 6 8 10 12 14 x 104 0 0.005 0.01 0.015 0.02 0.025 0.03 0.035 0.04 0.045 g j time am pl itud e
Figure 2. Side-channel signal for IC9 with Trojan.
Fig. 3 shows the magnitude of the Fourier transform of the first 4000 signal samples of the side-channel signal for IC1 which does not contain any Trojan circuitry. Since the Fourier transforms for the circuits with a Trojan look almost the same, we do not show them here.
Figure 3 Side-channel signal for IC1 (with no Trojan) in the frequency domain.
In both the time and frequency domain signals, it is possible to observe slight power differences between the signals obtained from the ICs with Trojans and without Trojans, as the operation of a Trojan will draw some extra power from the source. However if the main circuit is very large with millions of gates while the Trojan circuitry is very small, this extra power contribution due to Trojan activity will easily hide inside the measurement and manufacturing process noises and power analysis alone may not be successful in detecting the Trojan.
III. DISCRETE WAVELET TRANSFORM
The Discrete wavelet transform (DWT) is single-level one-dimensional wavelet decomposition with respect to a particular wavelet [18]. As our first technique for detecting circuits with Trojans, we propose using the DWT based on the Haar wavelet.
Figure 4. DWT with Haar for the side-channel signal for IC1 with no Trojan.
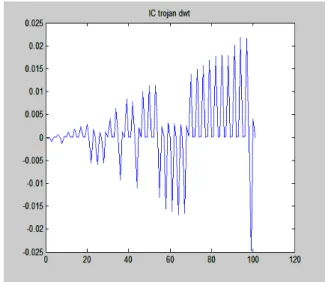
Figure 5. DWT with Haar for the side-channel signal for IC9 with Trojan.
Fig. 4 shows the DWT with the Haar wavelet for the signal sample for IC1 which does not contain any Trojan circuitry. Fig. 5 shows the DWT with the Haar wavelet for the signal sample for IC9 which contains a Trojan. Only the beginning parts of the wavelet transforms are depicted in order to clearly observe noticeable differences. The mean values of these 100 samples are obtained as -0.0014 and 0.0013, respectively, for the normal IC and the IC with a Trojan. Although not all of them are shown here, similar values are obtained for the other circuits under test.
0 200 400 600 800 1000 1200 -0.03 -0.02 -0.01 0 0.01 0.02
0.03 wavelet transform IC5
Figure 6. DWT with Haar wavelet for the signal sample for IC5 (no Trojan).
0 200 400 600 800 1000 1200 -0.03 -0.02 -0.01 0 0.01 0.02
0.03 wavelet transform IC12trojan
Figure 7. DWT with Haar wavelet for the signal sample for IC12 (Trojan).
Fig. 6 and Fig. 7 show the DWT with the Haar wavelet for the signal samples for IC5 (no Trojan) and IC12 (with Trojan), respectively, for the time intervals around 10000. The signal levels for both circuits range between -0.025 and 0.023, however there is a considerable visual difference which can help detection. The circuit containing a Trojan has more oscillations which can be useful in classification.
Simulations based on other wavelets such as Coiflet, Symlet, and Daubechies also show similar differences for circuits with or without Trojans. Moreover, considering different lengths of the wavelet decomposition of the signals provides different forms which can also be helpful in detecting Trojans. Future work can focus on more quantitative outputs based on the wavelet transforms using statistics and other properties.
IV. SPECTROGRAM
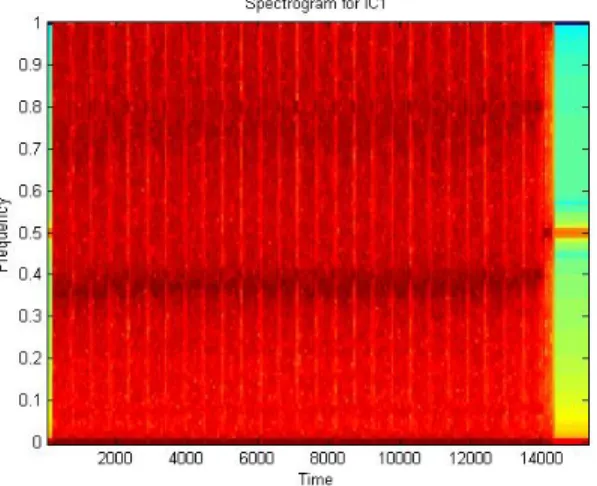
A spectrogram is the absolute square of the short time Fourier transform [19] which can be used to analyze the frequency content of a signal under consideration at predetermined time intervals. We used Matlab to obtain the figures for our spectrograms where the change of colors from red to blue shows the increase of energy. Fig. 8 shows the spectrogram of the signal sample for IC1 which does not contain any Trojan circuitry while Fig. 9 shows that of IC9 having Trojan activity. We observe that having a Trojan introduces extra power (as seen with blue or light colors compared to red or darker colors) spread out over almost all frequencies. We analyzed all our circuits using this approach and observed similar behavior. As the Trojan circuitry may not be active at all times, there are certain time periods where the spectrogram analysis cannot distinguish the Trojan. Therefore one has to observe multiple time intervals during a Trojan search process using spectrograms.
Figure 8. Spectrogram of IC1 signal (no Trojan).
Figure 9. Spectrogram of IC9 signal (with Trojan).
V. NEURAL NETWORKS
Neural networks (NNs) [20] were inspired by the power, flexibility and robustness of the biological brain. NNs consist of many simple mathematical elements that work together in parallel and in series. A NN model can be seen in Fig.12. Each neuron has many inputs and only one output, and this output is an input to other neurons. As shown in Fig.13 a neuron model consists of a summing junction and an activation function. Here, x1, x2, x3, ...xn are inputs; ω1,ω2,ω3,
...ωn are weight coefficients; b is the bias and y is the output. In this model, the output equation can be given as the following: ⎟⎟ ⎠ ⎞ ⎜ ⎜ ⎝ ⎛ + =
∑
= n i i ix b f y 1 ω (1) where f(x) is the activation function. A training process canbe viewed as a problem of determining the network architecture and weight coefficients so that the neural network can perform a special task. A NN can adapt itself to get the desired response. NNs are trained from sample data, instead of programming. Both the inputs and the responses are given to the system. For each input, the desired and obtained responses are compared, and the weight coefficients are changed accordingly to minimize the difference between the two. After an acceptable error is obtained, the learning process is stopped. In our system, a trained NN is used for the detection of ICs containing Trojans.
Figure 12. Neural Network Structure.
We use a NN with a single hidden layer having 10 neurons and activation functions selected as a logarithmic sigmoid. Our NN is trained with the Fourier transforms of the side-channel signals for IC1, IC2 (without Trojans) and IC9, IC10 (containing Trojans). Each of the 30 inputs contains 100 samples. The output of the NN is a 1x30 vector which corresponds to a logic state (1 or 0) that shows us whether the input signal belongs to an infected circuit. Test simulations are done with 64 combinations of all pairs containing one of the 8 normal ICs (IC1-8) and one of the 8 Trojan ICs (IC9-16). Approximately 90% of the decisions are correct for the studied signal pairs. We note that our initial simulation results are promising.
VI. CONCLUSIONS
We presented the Trojan detection problem briefly and demonstrated that signal processing techniques can be helpful in detecting Trojans which can try to hide themselves and become almost invisible by visual observation especially in very large scale integrated circuits. Particularly, we explored the discrete wavelet transform, spectrograms and neural network algorithms which are all found to be quite useful. The discrete wavelet transforms and spectrograms can provide visual assistance if sufficient time slots are searched. Furthermore, employing neural networks can be a highly desirable method to detect Trojans at a high success rate when enough training is used.
REFERENCES
[1] J. Lieberman, ‘‘National security aspects of the global migration of the U.S. semiconductor industry,’’ white paper, Airland Subcommittee, US Senate Armed Services Committee, June 2003.
[2] ‘‘Report of the defense science board task force on high performance microchip supply,’’ Defense Science Board, US Department of Defence, February 2005.
[3] J. Soden, R. Anderson and C. Henderson, “IC failure analysis tools and techniques – magic, mystery, and science,” In Proceedings of the 1996 International Test Conference (ITC'96).
[4] M. Banga and M. Hsiao, ‘‘A novel sustained vector technique for the detection of hardware Trojans,’’ Proceedings of the 22nd International
Conference on VLSI Design, 2009, pp. 327-332.
[5] D. Agrawal et al., ‘‘Trojan detection using IC fingerprinting,’’ Proceedings of the IEEE International Symposium on Security & Privacy (SP’07), 2007, pp. 296-310.
[6] X. Wang et al., ‘‘Hardware Trojan detection and isolation using current integration and localized current analysis,’’ Proceedings of the IEEE International Symposium on Defect and Fault Tolerance of VLSI Systems (DFT 08), 2008, pp. 87-95.
[7] R. Rad et al., ‘‘Power supply signal calibration techniques for improving detection resolution to hardware Trojans,’’ Proceedings of the IEEE/ACM International Conference on Computer-Aided Design (ICCAD 08), 2008, pp. 632-639.
[8] M. Banga and M. Hsiao, ‘‘A region based approach for the identification of hardware Trojans,’’ Proceedings of the IEEE International Workshop on Hardware-Oriented Security and Trust (HOST’08), 2008, pp. 40-47.
[9] M. Banga and M. Hsiao, ‘‘VITAMIN: voltage inversion technique to ascertain malicious insertion in ICs,’’ Proceedings of the 2nd IEEE
International Workshop on Hardware-Oriented Security and Trust (HOST’09), 2009, pp. 104-107.
[10] Y. Alkabani and F. Koushanfar, ‘‘Consistency-based characterization for IC Trojan detection,’’ Proceedings of the IEEE/ACM International Conference on Computer-Aided Design (ICCAD’09), 2009.
[11] M. Potkonjak et al., ‘‘Hardware Trojan horse detection using gate-level characterization,’’ Proceedings of the 46th ACM Design Automation
Conference (DAC’09), 2009, pp. 688-693.
[12] Y. Jin and Y. Makris, ‘‘Hardware Trojan detection using path delay fingerprint,’’ Proceedings of the IEEE International Workshop on Hardware-Oriented Security and Trust (HOST’08), 2008, pp. 51-57. [13] J. Li and J. Lach, ‘‘At-speed delay characterization for IC
authentication and Trojan-horse detection,’’ Proceedings of the IEEE International Workshop on Hardware-Oriented Security and Trust (HOST’08), 2008, pp. 8-14.
[14] M. Tehranipoor and F. Koushanfar, “A survey of harware Trojan taxonomy and detection,” IEEE Design & Test of Computers Magazine, pp. 10–25, January-February 2010.
[15] R. L. Rivest, A. Shamir, and L. Adleman. “A method for obtaining digital signatures and public-key cryptosystems,” Communications of the ACM, 21(2):120-126, February 1978.
[16] Synopsys Inc. Design Compiler User Guide, ver. 2002.05 edition. [17] Synopsys Inc. Prime Power Manual, ver. 2002.05 edition, Sep 2002. [18] M. Rao Raghauveer and S. Bopardikar Ajit, Wavelet Transforms.
Addison Wesley, 1998.
[19] A. Mertins, Signal Analysis. John Wiley and Sons, 1999.
[20] S. Haykin, Neural Networks, 2nd edition. Prentice-Hall, New Jersey 1999, pp. 6-23.