Assessment of the Platelet Parameters in Children With
Type 1 Diabetes Mellitus
Ozlem Korkmaz
Abstract
Background: The purpose of this study was to assess platelet
morpho-logical parameters in children and adolescents with type 1 diabetes mel-litus (T1DM) and to determine the factors affecting those parameters.
Methods: A total of 80 children with type 1 diabetes mellitus and 80
healthy control subjects were included in this study. All subjects’ plate-let parameters including plateplate-let count (PLT), mean plateplate-let volume (MPV), platelet distribution width (PDW) and plateletcrit (PCT) lev-els were measured. Age at diagnosis, duration of diabetes, and hemo-globin A1c (HbA1c) levels of patients with T1DM were also recorded.
Results: There was no significant difference in PLT, MPV, PDW and
PCT values between patients and controls (P > 0.05). PCT and PLT values were higher in patients with poor metabolic control compared to the other cases (P = 0.002, P = 0.005). Positive correlation was found between HbA1c and PCT (r = 0.28, P = 0.01). There was no correlation between HbA1c and MPV, PDW and PLT.
Conclusions: Indices of platelet morphology such as PCT, PLT, PDW
and MPV were similar in children with T1DM and in healthy con-trols. However, an increase in PCT values in poor glycemic control group and a significant positive correlation between PCT and HbA1c were observed, suggesting that PCT levels may be an early marker of vascular complication.
Keywords: Type 1 diabetes mellitus; Children; Plateletcrit; Platelet
Introduction
Type 1 diabetes mellitus (T1DM) is one of the most com-mon endocrinological disorders in children and adolescents. Its incidence below the age of 14 ranges from 0.1/100,000 to 36.8/100,000 annually, and varies between countries [1]. Micro-vascular (retinopathy, neuropathy, and nephropathy) and
macro-vascular (coronary artery disease, peripheral artery disease, and cerebrovascular disease) atherothrombotic complications may develop in children and adolescents, depending on duration of diabetes, degree of metabolic control, and other factors (such as genetic and smoking). Hyperglycemia, dyslipidemia, inflam-mation and stress are factors that increase the risk of vascular complications in patients with T1DM. The majority of ischemic events are known to develop due to intravascular thrombosis. Platelet activation plays a key role in the development of athero-sclerosis. Type 1 and type 2 diabetes have platelet hyperactivity, dysfunction and changed morphology which lead to thrombus formation, microvascular embolization and discharge of oxida-tive, constrictive and mitogenic substances, and play a key role in acute coronary events and other thromboembolic diseases [2]. Mean platelet volume (MPV) is a marker of platelet function and activation. MPV and platelet distribution width (PDW) can be used as markers in the early diagnosis of diabetic compli-cations in patients with type 2 diabetes mellitus (T2DM) [3]. Plateletcrit (PCT) levels are defined as an independent marker of vascular changes, particularly in the coronary arteries. The effect of platelet morphological parameters on metabolic control in patients with T1DM is still unclear. Very few studies have evaluated morphological changes in platelets, particularly in children and adolescents with T1DM. The purpose of this study was to assess platelet morphological parameters in children with T1DM and to determine the factors affecting those parameters.
Materials and Methods
Eighty patients diagnosed with T1DM, age between 3.9 - 17.6 years and followed up by the Pediatric Endocrinology Clinic were included in the study. Patients with a history of drug use, a history of accompanying chronic disease, with findings of cur-rent acute infection, or with severe hypoglycemia or diabetic ketoacidosis were excluded. A control group was established consisting of 80 subjects with no history of chronic disease pre-senting to the pediatric clinic for routine check-up. This study was approved by Baskent University Institutional Review Board. Clinical Investigations Ethical Committee approval was obtained for the study and with the 1964 Helsinki Declaration and its later amendments or comparable ethical standards. Data collection
All subjects’ anthropometric parameters (weight, weight
stand-Manuscript submitted October 30, 2018, accepted November 10, 2018 Department of Pediatric Endocrinology, Adana Training and Research Center, Baskent University Faculty of Medicine, Adana, Turkey.
Email: [email protected] doi: https://doi.org/10.14740/jem537
ard deviation score (SDs), height, height SDs, body mass index (BMI) and BMI SDs) and platelet count (PLT), MPV, PDW, PCT levels were recorded. Age at diagnosis, duration of dia-betes, and hemoglobin A1c (HbA1c) levels of patients with T1DM were also obtained. Anthropometric data were convert-ed to standard deviation scores using Turkish standard data [4]. BMI was calculated using the standard formula weight/height2
(kg/m2). Type 1 DM patients were also stratified according to
good (n = 14), moderate (n = 30) and poor metabolic control (n = 36) which were defined as: HbA1c < 7.5%, 7.5-9% and > 9% respectively. Target HbA1c levels of < 7.5%, based on ADA/ IDF/ISPAD recommendations [5].
Laboratory analyses
Blood samples were processed within 2 h after collection, according to the standard operating procedure of our institu-tion. Platelets morphology parameters, e.g. PLT, MPV, PDW and PCT were extracted from routinely performed complete blood count results. The blood counts were performed with flow cytometry peroxidase methodology-based analyses (Sie-mens Advia 2020i, Ireland). HbA1c was measured using the spectrophotometric methods. HbA1c measurements were performed with the Siemens Advia 1800 Chemistry System (Japan).
Statistical analysis
Statistical evaluation was performed by statistical package SPSS version 17(SPSS Inc, Chicago, IL). Data were expressed
as mean ± standard deviation. The parameters with normal distribution were compared within two groups using Student’s
t-test, whereas the parameters with non-normal distribution
were compared within the two groups using the Mann-Whit-ney U test. Pearson’s correlation analysis was used to assess the relationships between the parameters that showed normal distribution and Spearman’s rho correlation analysis was per-formed to analyse the relationships between the parameters that did not show normal distribution. Spearman’s rho correla-tion test was used for the comparisons of categorical variables and correlations among two variables. Kruskal-Wallis test which is a nonparametric test was used for the comparison of multiple groups. A P value < 0.05 was considered statistically significant.
Results
The mean age of enrolled subjects was 11.41 ± 3.79 years (range: 3.9 - 17.6 years) with mean duration of T1DM of 3.91 ± 2.76 years (range: 0.6 - 15 years). Age at diagnosis was 7.64 ± 3.49 years. The study and control groups did not differ in terms of sex and age. The basal characteristics of the study groups were shown in Table 1.
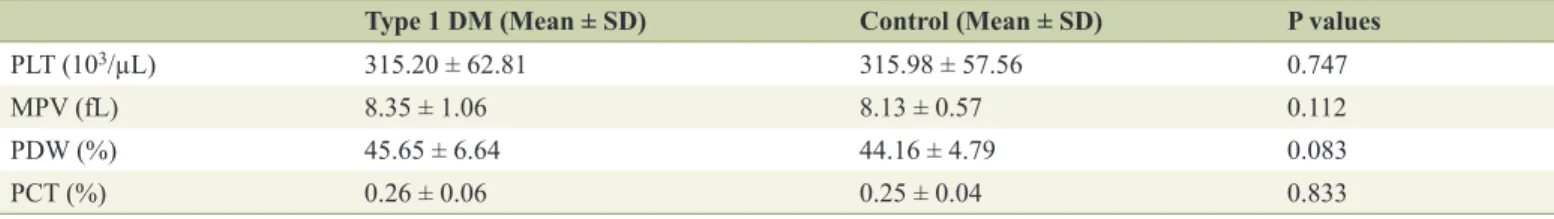
There was no significant difference in PCT, PLT, PDW and MPV values between patients and controls (P > 0.05) (Ta-ble 2).
Influence of metabolic control on platelet morphology in-dices
Patients were divided into three groups according to HbA1c levels (HbA1c < 7.5%, 7.5-9% and > 9%), PCT and PLT val-ues were higher in patients with poor metabolic control com-pared to the other cases (P = 0.002, P = 0.005). There was no statistically significant difference between the degree of meta-bolic control and MPV and PDW levels (P > 0.05).
Correlation of platelet indices with various disease-related factors
There was no correlation between duration of diabetes and MPV, PDW, PCT and PLT. Positive correlation was found between HbA1c and PCT (r = 0.28, P = 0.01). There was no correlation between HbA1c and MPV, PDW and PLT (Table 3).
Table 1. Clinical Characteristics of the Study and Control
Groups
Type 1 DM Control P values
Age 11.41 ± 3.79 10.61 ± 2.86 0.134 Gender ratio (boys/girls) 41/39 38/42 0.752 Weight SDs 0.01 ± 1.16 0.06 ± 1.47 0.738 Height SDs -0.13 ± 1.22 0.08 ± 1.46 0.297 BMI SDs 0.12 ± 1.03 0.17 ± 1.31 0.751 Diabetes duration 3.91 ± 2.76
HbA1c 9.11 ± 1.64
Type 1 DM: type 1 diabetes mellitus; SDs: standard deviation score; BMI: body mass index; HbA1c: hemoglobin A1c.
Table 2. Platelet Parameters of the Study and Control Group
Type 1 DM (Mean ± SD) Control (Mean ± SD) P values
PLT (103/µL) 315.20 ± 62.81 315.98 ± 57.56 0.747
MPV (fL) 8.35 ± 1.06 8.13 ± 0.57 0.112
PDW (%) 45.65 ± 6.64 44.16 ± 4.79 0.083
PCT (%) 0.26 ± 0.06 0.25 ± 0.04 0.833
Discussion
Diabetes has been proved to be a prothrombotic condition. Platelets are cell fragments that play an active role in the devel-opment of atherosclerosis and acute complications [6]. Large platelets are more active, contain more secretory granules, and produce more serotonin beta thromboglobulin and thrombox-ane A2, which support platelet aggregation. This is regarded as a mechanism that accounts for platelet hyperactivity and thus their effects on thrombosis [7, 8]. MPV is a direct marker of platelet activity and function [9]. Studies have determined higher MPV in individuals with both T1DM and T2DM, and these changes have been linked to metabolic control [10, 11]. Sharpe et al [11] determined a significant increase in MPV values in patients with T1DM compared to healthy controls. Venkatesh et al [12] determined a significant increase in MPV values in subjects with childhood T1DM compared to a con-trol group. Various different studies have thus suggested that platelets can be used as a marker for predicting an increase in the risk of the micro- and macrovascular complications of dia-betes [13-15]. However, Ersoy et al [16] reported similar MPV values in children diagnosed with T1DM to those in a control group (8.74 ± 0.96 and 8.49 ± 0.66, respectively), although correlation was determined between intima-media thickness and MPV values. Similarly, in our study, we determined no statistically significant difference in MPV values between chil-dren with T1DM and the control group. This may be explained in terms of the hypothesis that metabolic imbalance in diabetic cases does not yet lead to changes in MPV values in the early period due to the short duration of the disease in childhood.
Different results have been reported in studies assessing platelet counts in diabetic patients. Platelet activation and ag-gregation resulting from an overreaction to endogenous ago-nists in diabetic patients can lead to depletion of platelets in the circulation. Some studies support the idea that ineffec-tive thrombopoiesis in diabetic subjects leads to a low plate-let count [17, 18]. Hekimsoy et al [19] also observed a lower platelet count in diabetic cases. They suggested that this might also be related to differences in platelet production and turno-ver in cases of T2DM. Pirgon et al [20] determined no sig-nificant difference in platelet numbers between children with T1DM and controls (333.7 ± 71.3 × 10⁹/L, and 339.6 ± 101.9 ×
109/L, respectively). Another study of T2DM patients reported
a higher platelet count in the diabetic group than in the control group, although the difference was not statistically significant. A different study involving adult patients with T1DM deter-mined a higher platelet count in diabetics than in the control group, and observed positive correlation with poor metabolic control [21]. Reactive thrombocytosis associated with increas-ing blood glucose levels has been reported in diabetic patients with poor metabolic control. An increasing platelet count has been described as a possible response to stress, and to be capa-ble of increasing the risk of vascular complications by damag-ing the microcirculation. In the present study, we determined no difference in platelet counts between children with T1DM and the control group. However, we observed a higher platelet count in cases with poor metabolic control (HbA1c > 9%) than
in the other groups (P = 0.005). Table 3
. Correlation of Platelet Parameters With Duration of Diabetes and HbA1c
Among Type 1 DM MPV ( fL) PDW (%) PCT (%) PL T (10 3/µL) Corr elation coefficient (r value) P value Corr elation coefficient (r value) P value Corr elation coefficient (r value) P value Corr elation coefficient (r value) P value Duration of diabetes -0.018 0.875 -0.028 0.809 0.177 0.1 17 0.186 0.099 HbA1c 0.150 0.184 -0.100 0.376 0.284 0.01 1 0.198 0.078 MPV
: mean platelet volume; PDW
: platelet distribution width; PCT
: plateletcrit; PL
Vagdatli et al [22] in their study determined that PDW levels can be used as a specific marker of platelet activation. Malachowska et al [23] determined an increase in PDW val-ues in cases of T1DM compared to a control group. This large study of adults with T2DM reported that duration of diabetes was positively correlated with PDW and MPV. That study also reported positive correlation between PDW and HbA1c [3]. We observed no statistically significant difference in PDW tween our study groups. No correlation was also observed be-tween HbA1c levels and PDW (r = -0.10, P = 0.376). Previous studies have shown correlation between duration of diabetes and increasing MPV values [24], although others do not sup-port this [13]. No relation between duration of diabetes and MPV was observed in our study.
PCT is assumed to show the number of platelets in circu-lation in one unit volume, and expresses platelet variation and heterogeneity [25]. There have been few studies of PCT values in diabetic cases, although Venkatesh et al [12] found no sig-nificant difference in terms of PCT values between children diagnosed with T1DM and a control group. Another study of patients with T2DM determined higher PCT values than in a control group. That study also determined higher PCT values in the presence of chronic complications. This finding was at-tributed to an increase in platelet mass, and thus in PCT, since platelets in diabetic patients are larger and more reactive [26]. In our study, however, we determined no difference in PCT between the T1DM patient group and the control group.
Hyperglycemia results in non-enzymatic glycosylation of proteins on the platelet surface, and therefore results in a de-crease in membrane fluidity and an inde-crease in platelet reactiv-ity. A few studies have investigated relations between metabol-ic control and platelet morphologmetabol-ical parameters in children with T1DM. A retrospective study from 2015 involving 4,072 patients reported a positive relationship between HbA1c levels and MPV [27]. Malachowska et al [23] observed no signifi-cant relation between MPV and HbA1C. Zaccardi et al [28] observed a significant change in MPV-platelet count in cases with poor metabolic control (HbA1c > 9%) compared to other cases. Another large study of adults with T2DM reported sig-nificant positive correlation between HbA1c levels and MPV [29]. Although Pirgon et al [20] observed higher MPV in cases with T1DM compared to a control group; they determined no significant correlation between MPV and HbA1c, BMI or age. Demirtunc et al [30] reported significantly higher MPV in pa-tients with HbA1c values > 7% compared to those with HbA1c ≤ 7%. In our study, positive correlation was found between HbA1c and PCT. The PCT values were higher in cases with poor metabolic control. This finding supports the idea that PCT values can be used as a marker in determining the risk of future complications, particularly in individuals with poor metabolic control. PCT may be an early marker of vascular damage in these cases.
There are a number of limitations to our study. In partic-ular, metabolic control was determined only on the basis of HbA1c levels. However, greater glycemic variability is regard-ed as an independent risk factor in the development of vascu-lar complications of diabetes [31]. Use of continuous glucose measurement systems in these cases might therefore have in-creased the power of our study.
Conclusions
Indices of platelet morphology such as MPV, PDW, PCT and PLT were similar in children with T1DM and in healthy con-trols. This may be associated with young age and a short dura-tion of diabetes. However, an increase in PCT values in poor glycemic control group and a significant positive correlation between PCT and HbA1c were observed, suggesting that PCT levels may be an early marker of vascular complication. Since PCT analysis is simple and inexpensive, it can be employed as a simple prognostic method for determining the risk of diabet-ic compldiabet-ications. Further long-term prospective studies with larger patient series are now needed on this subject.
Conflict of Interest
The author declares that there is no conflict of interest.
Financial Support
None.
References
1. Karvonen M, Viik-Kajander M, Moltchanova E, Libman I, LaPorte R, Tuomilehto J. Incidence of childhood type 1 diabetes worldwide. Diabetes Mondiale (DiaMond) Pro-ject Group. Diabetes Care. 2000;23(10):1516-1526. 2. Kakouros N, Rade JJ, Kourliouros A, Resar JR.
Plate-let function in patients with diabetes mellitus: from a theoretical to a practical perspective. Int J Endocrinol. 2011;2011:742719.
3. Sharma M, Narang S, Nema SK. Study of altered platelet morphology with changes in glycaemic status. Int J Res Med Sci. 2016;4(3):757-761.
4. Bundak R, Furman A, Gunoz H, Darendeliler F, Bas F, Neyzi O. Body mass index references for Turkish chil-dren. Acta Paediatr. 2006;95(2):194-198.
5. Chiang JL, Kirkman MS, Laffel LM, Peters AL, Type 1 Diabetes Sourcebook A. Type 1 diabetes through the life span: a position statement of the American Diabetes As-sociation. Diabetes Care. 2014;37(7):2034-2054.
6. Arikanoglu A, Yucel Y, Acar A, Cevik MU, Akil E, Varol S. The relationship of the mean platelet volume and C-reactive protein levels with mortality in ischemic stroke patients. Eur Rev Med Pharmacol Sci. 2013;17(13):1774-1777.
7. Martin JF, Bath PM, Burr ML. Influence of platelet size on outcome after myocardial infarction. Lancet. 1991;338(8780):1409-1411.
8. D'Erasmo E, Aliberti G, Celi FS, Romagnoli E, Vecci E, Mazzuoli GF. Platelet count, mean platelet volume and their relation to prognosis in cerebral infarction. J Intern Med. 1990;227(1):11-14.
JW, Konkle B, Mohler ER, et al. Mean platelet volume as a predictor of cardiovascular risk: a systematic review and meta-analysis. J Thromb Haemost. 2010;8(1):148-156. 10. Glassman AB. Platelet abnormalities in diabetes mellitus.
Ann Clin Lab Sci. 1993;23(1):47-50.
11. Sharpe PC, Trinick T. Mean platelet volume in diabetes mellitus. Q J Med. 1993;86(11):739-742.
12. Venkatesh V, Kumar R, Varma DK, Bhatia P, Yadav J, Dayal D. Changes in platelet morphology indices in rela-tion to durarela-tion of disease and glycemic control in chil-dren with type 1 diabetes mellitus. J Diabetes Complica-tions. 2018;32(9):833-838.
13. Kodiatte TA, Manikyam UK, Rao SB, Jagadish TM, Reddy M, Lingaiah HK, Lakshmaiah V. Mean platelet volume in Type 2 diabetes mellitus. J Lab Physicians. 2012;4(1):5-9.
14. Zuberi BF, Akhtar N, Afsar S. Comparison of mean plate-let volume in patients with diabetes mellitus, impaired fasting glucose and nondiabetic subjects. Singapore Med J. 2008;49(2):114-116.
15. Ates O, Kiki I, Bilen H, et al. Association of mean platelet volume with the degree of retinopathy in patients with diabetes mellitus. Eur J Gen Med. 2009;6(2):99-102. 16. Ersoy M, Selcuk Duru HN, Elevli M, Ersoy O, Civilibal
M. Aortic intima-media thickness and mean platelet vol-ume in children with type 1 diabetes mellitus. Iran J Pedi-atr. 2015;25(2):e368.
17. Kim JH, Bae HY, Kim SY. Clinical marker of platelet hyperreactivity in diabetes mellitus. Diabetes Metab J. 2013;37(6):423-428.
18. Tschope D, Langer E, Schauseil S, Rosen P, Kaufmann L, Gries FA. Increased platelet volume - sign of impaired thrombopoiesis in diabetes mellitus. Klin Wochenschr. 1989;67(4):253-259.
19. Hekimsoy Z, Payzin B, Ornek T, Kandogan G. Mean platelet volume in Type 2 diabetic patients. J Diabetes Complications. 2004;18(3):173-176.
20. Pirgon O, Tanju IA, Erikci AA. Association of mean platelet volume between glucose regulation in children with type 1 diabetes. J Trop Pediatr. 2009;55(1):63-64. 21. Uko EK, Erhabor O, Isaac IZ, et al. Some
haematologi-cal parameters in patients with type-1 diabetes in Sokoto, North Western Nigeria. J Blood Lymph. 2013;3:1.
22. Vagdatli E, Gounari E, Lazaridou E, Katsibourlia E, Tsikopoulou F, Labrianou I. Platelet distribution width: a simple, practical and specific marker of activation of coagulation. Hippokratia. 2010;14(1):28-32.
23. Malachowska B, Tomasik B, Szadkowska A, Baranows-ka-Jazwiecka A, Wegner O, Mlynarski W, Fendler W. Altered platelets' morphological parameters in children with type 1 diabetes - a case-control study. BMC Endocr Disord. 2015;15:17.
24. Buch A, Kaur S, Nair R, Jain A. Platelet volume indices as predictive biomarkers for diabetic complications in Type 2 diabetic patients. J Lab Physicians. 2017;9(2):84-88.
25. Akpinar I, Sayin MR, Gursoy YC, Aktop Z, Karabag T, Kucuk E, Sen N, et al. Plateletcrit and red cell distribution width are independent predictors of the slow coronary flow phenomenon. J Cardiol. 2014;63(2):112-118. 26. Alhadas KR, Santos SN, Freitas MS, et al. Are platelet
in-dices useful in the evaluation of type 2 diabetic patients? Brazilian Journal of Pathology and Laboratory Medicine. 2016;52:2.
27. Lippi G, Salvagno GL, Nouvenne A, Meschi T, Borghi L, Targher G. The mean platelet volume is significantly associated with higher glycated hemoglobin in a large population of unselected outpatients. Prim Care Diabetes. 2015;9(3):226-230.
28. Zaccardi F, Rocca B, Rizzi A, Ciminello A, Teofili L, Ghirlanda G, De Stefano V, et al. Platelet indices and glucose control in type 1 and type 2 diabetes melli-tus: A case-control study. Nutr Metab Cardiovasc Dis. 2017;27(10):902-909.
29. Shah B, Sha D, Xie D, Mohler ER, 3rd, Berger JS. The relationship between diabetes, metabolic syndrome, and platelet activity as measured by mean platelet volume: the National Health And Nutrition Examination Survey, 1999-2004. Diabetes Care. 2012;35(5):1074-1078. 30. Demirtunc R, Duman D, Basar M, Bilgi M, Teomete M,
Garip T. The relationship between glycemic control and platelet activity in type 2 diabetes mellitus. J Diabetes Complications. 2009;23(2):89-94.
31. Brownlee M, Hirsch IB. Glycemic variability: a hemo-globin A1c-independent risk factor for diabetic complica-tions. JAMA. 2006;295(14):1707-1708.