Dergi web sayfası:
www.agri.ankara.edu.tr/dergi www.agri.ankara.edu.tr/journalJournal homepage:
TARIM BİLİMLERİ DERGİSİ
—
JOURNAL OF AGRICUL
TURAL SCIENCES
21 (2015) 420-430
Dissection of Barley Landraces Originated From Twelve Different
Countries by Using Simple Sequence Repeats Markers
Hülya SİPAHİa, Aysen YUMURTACIb
aSinop University, Faculty of Arts and Science, Department of Biology, Sinop, TURKEY
bMarmara University, Faculty of Science and Letters, Department of Biology, 34722, Istanbul, TURKEY
ARTICLE INFO
Research Article
Corresponding Author: Hülya SİPAHİ, E-mail: [email protected], Tel: +90 (368) 271 55 16 Received: 13 May 2014, Received in Revised Form: 11 September 2014, Accepted: 18 September 2014
ABSTRACT
Landraces, as an important source of genetic diversity, are important for improvement of crop species. Investigating of genetic diversity among landraces is necessary to conserve genetic resources and develop future strategies on barley breeding. In this study, genetic diversity in barley landraces originating from twelve countries was studied using simple sequence repeat (SSR) markers. Sixteen SSR markers belong to the seven barley linkage groups revealed high genetic diversity. A total of 92 polymorphic alleles were scored and the number of alleles ranged from 1 to 7 per locus, with an average of 5.75. Genetic diversity was the highest in landraces from Turkey (0.66 ± 0.13) and the lowest in those from Ukraine (0.38 ± 0.24). While the highest percentage of polymorphic loci was found for landraces from Germany, Netherland, Russia, Turkey and USA as 100%, the lowest one was in England with 75%. Clustering analysis of landraces divided them into four main groups. The results provided additional genetic information about the barley landraces from different countries for future breeding process.
Keywords: Barley; Landraces; SSRs; Diversity
Basit Sıra Tekrarı İşaretleyicilerini Kullanarak On İki Farklı Ülkeden
Köken Alan Arpa Yerel Çeşitlerinin İncelenmesi
ESER BİLGİSİ
Araştırma Makalesi
Sorumlu Yazar: Hülya SİPAHİ, E-posta: [email protected], Tel: +90 (368) 271 55 16 Geliş Tarihi: 13 Mayıs 2014, Düzeltmelerin Gelişi: 11 Eylül 2014, Kabul: 18 Eylül 2014
ÖZET
Genetik çeşitliliğin önemli bir kaynağı olan yerel çeşitler, tahıl türlerinin geliştirilmesi için önemlidirler. Yerel çeşitler arasındaki genetik çeşitliliğin araştırılması, genetik kaynakları koruma ve arpa ıslahında gelecek stratejileri geliştirme için önemlidir. Bu çalışmada, on iki ülkeden köken alan arpa yerel çeşitlerindeki genetik çeşitlilik, basit sıra tekrarları (BST) işaretleyicileri kullanılarak çalışılmıştır. Yedi arpa bağlantı grubuna ait onaltı BST işaretleyicisi yüksek genetik çeşitliği ortaya çıkarmıştır. Toplamda 92 polimorfik allel sayılmış ve allel sayısı 5.75 ortalama ile lokus başına 1 ila
1. Introduction
Barley (Hordeum vulgare L.) is placed at the fourth rank among the top 10 crops. It is important for contributing to the world food supply as a human food, malt production, and livestock feed. Due to the nutritional quality, high yield and high tolerance level against to biotic or abiotic stresses, barley is an extensively studied cereal. Barley is accepted as one of the earliest domesticated crop and has been cultivated since the beginning of civilization. Breeder selection for resistance, quality or yield-contributed traits creates greater genetic uniformity and this genetic uniformity causes to narrow the structure of genetic material in time. However, genetic diversity has a fundamental importance for genetic improvement of crop plants. Landraces have evolved directly from their wild progenitors which lead to retain high level of genetic diversity and these are very important sources for barley improvement. Zeven (1998) stated that landraces have the ability to tolerate abiotic and biotic stress effects and they are capable of high yield stability and an intermediate yield level under a low input agricultural system.
Large numbers of barley landraces from all over the world have been gathered and stored in seed gene banks to secure a gene pool for future breeding process. Assessment of genetic diversity in landraces maintained in genebank is an essential step to detect the relationship among the landraces accessions, to understand the genetic structure of the landraces, to select the parents and design crossing process for breeding and to set priorities for genetic conservation strategies. Investigations about
genetic relatedness between landraces or cultivated genotypes will contribute to understanding of the unknown part of crop evolution (Jones et al 2008). A number of molecular methods and bioinformatics tools are available for analysis of genetic diversity among and within germplasm populations and the characterization of germplasm collections. The availability of PCR-based markers, such as SSRs, offers an important opportunity for genetic characterization of germplasm collections. SSRs are one of the markers of choice for many plant breeding applications, due particularly to their co-dominant nature, transferability, reproducibility, amenability to high throughput and high level of poly morphism frequency. SSR markers are progressively used for the detection of genetic identities or fingerprints (Hokanson et al 1998; Becher et al 2000; Prasad et al 2000), the assessment of genetic diversity within a collection (Westman & Kresovich 1999; Macaulay et al 2001) and the determination of genetic relatedness between accessions (Lopes et al 1999; Li et al 2000). Potential of SSR markers is also displayed for several divergent plant species such as sweet potato (Veasay et al 2008), wheat (Ahmed 2002; Schuster et al 2009), buckwheat (Kishore et al 2012), barley, pea, oats and rye (Hagenblad et al 2012).
In the present research, 84 barley landrace accessions, collected from Turkey, Ukraine, Russia, Austria, Germany, Netherland, England, Polland, China, Ethiopia, Mexico and USA, were assessed with 16 SSRs to estimate regional genetic diversity, genetic relationship and population structure. In this way, geographical evolution will be studied according to the SSR marker profiles.
7 arasında olmuştur. Genetik çeşitlilik en yüksek Türkiye yerel çeşitlerinde (0.66 ± 0.13), en düşük Ukrayna yerel çeşitlerinde (0.38 ± 0.24) belirlenmiştir. Polimorfik lokus yüzdesi, Almanya, Holanda, Rusya, Türkiye ve Amerika’da en yüksek yani % 100 iken, % 75 ile en düşük İngiltere’de bulunmuştur. Yerel çeşitlerin kümeleme analizleri onları dört ana gruba ayırmıştır. Sonuçlar gelecekteki ıslah çalışmaları için farklı ülkelerden arpa yerel çeşitleri hakkında ilave genetik bilgiler sağlamıştır.
Anahtar Kelimeler: Arpa; Yerel çeşitler; BST; Çeşitlilik
2. Material and Methods
2.1. Plant materialEighty-four barley landrace accessions from twelve countries were included in this study (Table 1). Approximately 2 g of leaves from 5 plants of each accession were pooled for the extraction of genomic DNA. DNA samples were extracted by using GeneMark DNA isolation kit. DNA samples were then quantified using a Nanodrop ND-1000 UV-V spectrophotometer. Sixteen SSRs distributed throughout the seven linkage groups were assayed (Table 2).
2.2. Polymerase chain reaction and electrophoresis PCR analysis was done using 16 primers (Table 2) as described by Sipahi 2011. PCR products were analysed on 6% PAGE gel in ‘1XTBE’, stained by ethidium bromide (0.5 mg mL-1) and visualized
under UV light. 2.3. Data analysis
SSR markers are codominant, thus the banding patterns were scored as AA or BB (homozygote) and AB (heterozygote) genotypes. Estimates of genetic diversity index (H), the proportion of polymorphic locus (P), and the mean number of alleles per
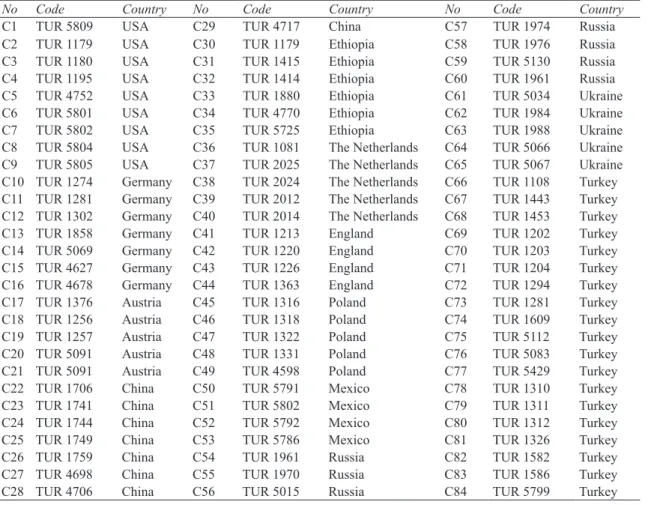
Table 1- List of barley landraces studied
Çizelge 1- Çalışılan arpa yerel çeşitlerin listesi
No Code Country No Code Country No Code Country
C1 TUR 5809 USA C29 TUR 4717 China C57 TUR 1974 Russia
C2 TUR 1179 USA C30 TUR 1179 Ethiopia C58 TUR 1976 Russia
C3 TUR 1180 USA C31 TUR 1415 Ethiopia C59 TUR 5130 Russia
C4 TUR 1195 USA C32 TUR 1414 Ethiopia C60 TUR 1961 Russia
C5 TUR 4752 USA C33 TUR 1880 Ethiopia C61 TUR 5034 Ukraine
C6 TUR 5801 USA C34 TUR 4770 Ethiopia C62 TUR 1984 Ukraine
C7 TUR 5802 USA C35 TUR 5725 Ethiopia C63 TUR 1988 Ukraine
C8 TUR 5804 USA C36 TUR 1081 The Netherlands C64 TUR 5066 Ukraine
C9 TUR 5805 USA C37 TUR 2025 The Netherlands C65 TUR 5067 Ukraine
C10 TUR 1274 Germany C38 TUR 2024 The Netherlands C66 TUR 1108 Turkey
C11 TUR 1281 Germany C39 TUR 2012 The Netherlands C67 TUR 1443 Turkey
C12 TUR 1302 Germany C40 TUR 2014 The Netherlands C68 TUR 1453 Turkey
C13 TUR 1858 Germany C41 TUR 1213 England C69 TUR 1202 Turkey
C14 TUR 5069 Germany C42 TUR 1220 England C70 TUR 1203 Turkey
C15 TUR 4627 Germany C43 TUR 1226 England C71 TUR 1204 Turkey
C16 TUR 4678 Germany C44 TUR 1363 England C72 TUR 1294 Turkey
C17 TUR 1376 Austria C45 TUR 1316 Poland C73 TUR 1281 Turkey
C18 TUR 1256 Austria C46 TUR 1318 Poland C74 TUR 1609 Turkey
C19 TUR 1257 Austria C47 TUR 1322 Poland C75 TUR 5112 Turkey
C20 TUR 5091 Austria C48 TUR 1331 Poland C76 TUR 5083 Turkey
C21 TUR 5091 Austria C49 TUR 4598 Poland C77 TUR 5429 Turkey
C22 TUR 1706 China C50 TUR 5791 Mexico C78 TUR 1310 Turkey
C23 TUR 1741 China C51 TUR 5802 Mexico C79 TUR 1311 Turkey
C24 TUR 1744 China C52 TUR 5792 Mexico C80 TUR 1312 Turkey
C25 TUR 1749 China C53 TUR 5786 Mexico C81 TUR 1326 Turkey
C26 TUR 1759 China C54 TUR 1961 Russia C82 TUR 1582 Turkey
C27 TUR 4698 China C55 TUR 1970 Russia C83 TUR 1586 Turkey
locus (A) were calculated for each SSR locus and population using the software POPGENE version 1.32 (Yeh et al 1999). Polymorphic information content (PIC) values were calculated for each primer according to the formula: PIC= l - ∑(Pij)2, where;
Pij is the frequency of the ith pattern revealed by the
jth primer summed across all patterns revealed by the
primers (Weber 1990). The genetic similarities (GS) were calculated according to Nei and Li (1979). Similarity coefficients were used to construct a
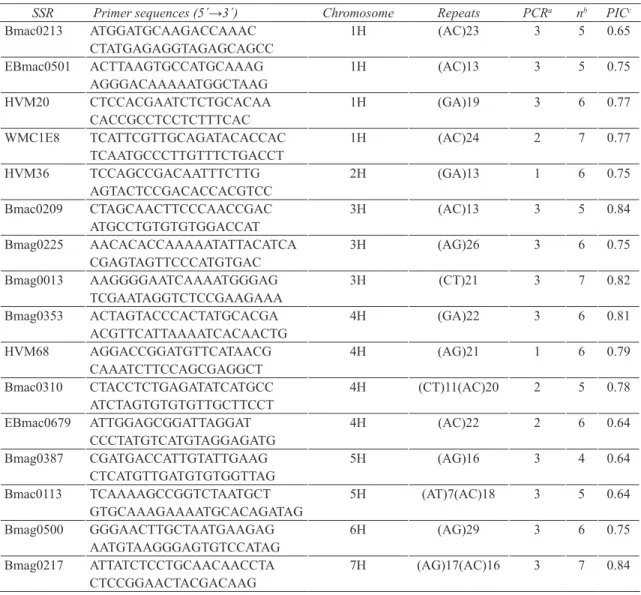
Table 2- Primer sequences, chromosomal locations, repeats and PCR conditions of 16 SSR markers used for barley germplasm screening
Çizelge 2- Arpa genetik kaynakların taranmasında kullanılan 16 BST işaretleyicilerinin primer dizinleri, kromozomal lokasyonları, tekrarları ve PCR koşulları
SSR Primer sequences (5´→3´) Chromosome Repeats PCRa nb PICc
Bmac0213 ATGGATGCAAGACCAAAC CTATGAGAGGTAGAGCAGCC 1H (AC)23 3 5 0.65 EBmac0501 ACTTAAGTGCCATGCAAAG AGGGACAAAAATGGCTAAG 1H (AC)13 3 5 0.75 HVM20 CTCCACGAATCTCTGCACAA CACCGCCTCCTCTTTCAC 1H (GA)19 3 6 0.77 WMC1E8 TCATTCGTTGCAGATACACCAC TCAATGCCCTTGTTTCTGACCT 1H (AC)24 2 7 0.77 HVM36 TCCAGCCGACAATTTCTTG AGTACTCCGACACCACGTCC 2H (GA)13 1 6 0.75 Bmac0209 CTAGCAACTTCCCAACCGAC ATGCCTGTGTGTGGACCAT 3H (AC)13 3 5 0.84 Bmag0225 AACACACCAAAAATATTACATCA CGAGTAGTTCCCATGTGAC 3H (AG)26 3 6 0.75 Bmag0013 AAGGGGAATCAAAATGGGAG TCGAATAGGTCTCCGAAGAAA 3H (CT)21 3 7 0.82 Bmag0353 ACTAGTACCCACTATGCACGA ACGTTCATTAAAATCACAACTG 4H (GA)22 3 6 0.81 HVM68 AGGACCGGATGTTCATAACG CAAATCTTCCAGCGAGGCT 4H (AG)21 1 6 0.79 Bmac0310 CTACCTCTGAGATATCATGCC ATCTAGTGTGTGTTGCTTCCT 4H (CT)11(AC)20 2 5 0.78 EBmac0679 ATTGGAGCGGATTAGGAT CCCTATGTCATGTAGGAGATG 4H (AC)22 2 6 0.64 Bmag0387 CGATGACCATTGTATTGAAG CTCATGTTGATGTGTGGTTAG 5H (AG)16 3 4 0.64 Bmac0113 TCAAAAGCCGGTCTAATGCT GTGCAAAGAAAATGCACAGATAG 5H (AT)7(AC)18 3 5 0.64 Bmag0500 GGGAACTTGCTAATGAAGAG AATGTAAGGGAGTGTCCATAG 6H (AG)29 3 6 0.75 Bmag0217 ATTATCTCCTGCAACAACCTA CTCCGGAACTACGACAAG 7H (AG)17(AC)16 3 7 0.84
a, the numbers represent one of the three PCR conditions described in the materials and methods section; b, number of alleles; c, PIC,
dendogram using UPGMA (unweighted pairgroup method using arithmetic averages; Sneath and Sokal 1973) by using the software NTSYS-pc version1.80 (Rohlf 1993).
3. Results and Discussion
In order to investigate genetic diversity of barley landraces from the twelve different country origin, sixteen SSR primer pairs covered the whole seven chromosomes were used (Table 1). Considering all 84 accessions, 16 SSR primer pairs generated a total of 92 alleles with an average of 5.75 polymorphic alleles per locus. The mean number of alleles is mostly dependent on diversity of populations analyzed. Some investigators have detected higher average numbers of alleles per locus in barley, ranging from 8 (Malysheva-Otto et al 2007; Varshney et al 2007) to 16.3 (Matus & Hayes 200). As given in Table 1, considering 12 countries, landraces originated from Russia, China, Germany, Turkey and USA amplified more than three alleles per locus, while remaining genotypes gave approximately 2 alleles as compared for the same criteria. Additionally, landraces from Russia and USA had the same mean number of alleles and also genetic diversity value despite the different number of landraces analysed for these countries. With a few exceptions, the mean number of alleles per locus was usually affected by the number of landraces used for each country. Total number of alleles displayed a range of 34 and 70 for Ukraine and Turkey respectively. It is also found that landraces from England and Mexico ensured the same allele numbers of 37. However, there was a 0.8 difference between the genetic diversity values of these two countries (Table 3). Saghai-Maroof et al (1994) reported the highest number of alleles per locus as 37 on 104 accessions of subsp. vulgare and 103 accessions of subsp. spontaneum. Matus and Hayes (2002) detected 10.3 average numbers of alleles per locus and the highest number of unique alleles in 147 barley progenitors (subsp. spontaneum). These authors explained this situation as a sign of large genetic diversity which exist in crop progenitors and as a potential reservoir of novel alleles for crop improvement. Considering
19 landraces from Turkey, among all SSR primers, Bmag217 caused an amplification of 6 alleles, while Bmac0213 had the least polymorphic results (Table 3). The number of allele observed at locus Bmag225 was higher than the value recorded in the study of Dizkirici et al (2008) who reported the number of allele as 4 at that locus for 80 Turkish barley cultivars.
Five private alleles were found, one with primers Bmag0225, Bmag 0013, Bmag0353, HVM68, and EBmac0679. The countries with one of private allele were Ethiopia, China, Russia, The Netherlands, and Austria. Private alleles could be used as diagnositic markers for identification of specific regions or genotypes (Senior et al 1998). In addition, Liu et al (1996) suggested that unique alleles might be the possible results of high mutation rate at the SSR region. Private alleles can also be used to identify accessions with high genetic variability, whose selection can increase the allele richness of genebanks (Saavedra et al 2013).
The range limits for polymorphic information contents of markers were observed. The highest value was 0.84 for Bmag209 and Bmag217 markers and the lowest calculation was 0.64 for Bmac0113, Bmag0387, EBmac0679 markers (Table 2). The mean value of PIC content was 0.749, which was higher than as previously reported for EST-based SSR loci (Varshney et al 2007). As shown in Table 3, Turkish landraces had the highest level of genetic diversity (0.66), while the lowest levels of genetic diversity (0.38 and 0.39) were detected in landraces of Ukraine and England. The highest degree of polymorphism of SSR markers (0.75) detected in this study allowed a rapid and efficient identification of barley landraces originated from different countries. Similarly, Struss & Plieske (1998) reported high value of gene diversity (0.73) for barley accessions. These authors stated that the high diversity value of barley microsatellite markers makes them ideal markers for differentiating between barley genotypes.
The number of alleles detected in a locus is generally correlated with the gene diversity value of that locus. However, in this study, the number
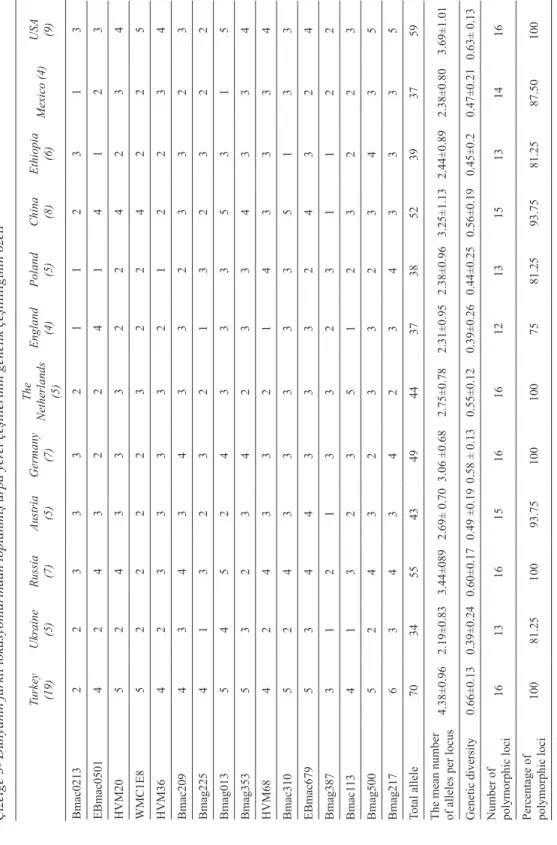
Table 3- Summary of genetic diversity of barley landraces collected fr
om differ
ent locations of the world
Çizelge 3- Dünyanın farklı lokasyonlarından toplanmış arpa yer
el çeşitlerinin genetik çeşitliliğinin özeti
Turkey (19) Ukraine (5) Russia (7) Austria (5) Germany (7) The Netherlands (5) England (4) Poland (5) China (8) Ethiopia (6) Mexico (4) USA (9) Bmac0213 2 2 3 3 3 2 1 1 2 3 1 3 EBmac0501 4 2 4 3 2 2 4 1 4 1 2 3 HVM20 5 2 4 3 3 3 2 2 4 2 3 4 WMC1E8 5 2 2 2 2 3 2 2 4 2 2 5 HVM36 4 2 3 3 3 3 2 1 2 2 3 4 Bmac209 4 3 4 3 4 3 3 2 3 3 2 3 Bmag225 4 1 3 2 3 2 1 3 2 3 2 2 Bmag013 5 4 5 2 4 3 3 3 5 3 1 5 Bmag353 5 3 2 3 4 2 3 3 4 3 3 4 HVM68 4 2 4 3 3 2 1 4 3 3 3 4 Bmac310 5 2 4 3 3 3 3 3 5 1 3 3 EBmac679 5 3 4 4 3 3 3 2 4 3 2 4 Bmag387 3 1 2 1 3 3 2 3 1 1 2 2 Bmac1 13 4 1 3 2 3 5 1 2 3 2 2 3 Bmag500 5 2 4 3 2 3 3 2 3 4 3 5 Bmag217 6 3 4 3 4 2 3 4 3 3 3 5 Total allele 70 34 55 43 49 44 37 38 52 39 37 59
The mean number of alleles per locus
4.38±0.96 2.19±0.83 3.44±089 2.69± 0.70 3.06 ±0.68 2.75±0.78 2.31±0.95 2.38±0.96 3.25±1.13 2.44±0.89 2.38±0.80 3.69±1.01 Genetic diversity 0.66±0.13 0.39±0.24 0.60±0.17 0.49 ±0.19 0.58 ± 0.13 0.55±0.12 0.39±0.26 0.44±0.25 0.56±0.19 0.45±0.2 0.47±0.21 0.63± 0.13
Number of polymorphic loci
16 13 16 15 16 16 12 13 15 13 14 16
Percentage of polymorphic loci
100 81.25 100 93.75 100 100 75 81.25 93.75 81.25 87.50 100
of alleles detected by SSR markers was not found correlated with the gene diversity. For example, the marker Bmag0013 showed an average gene diversity of 0.82, detecting seven alleles within 84 landraces, whereas Bmac0209 detected five alleles and showed a gene diversity value of 0.84.
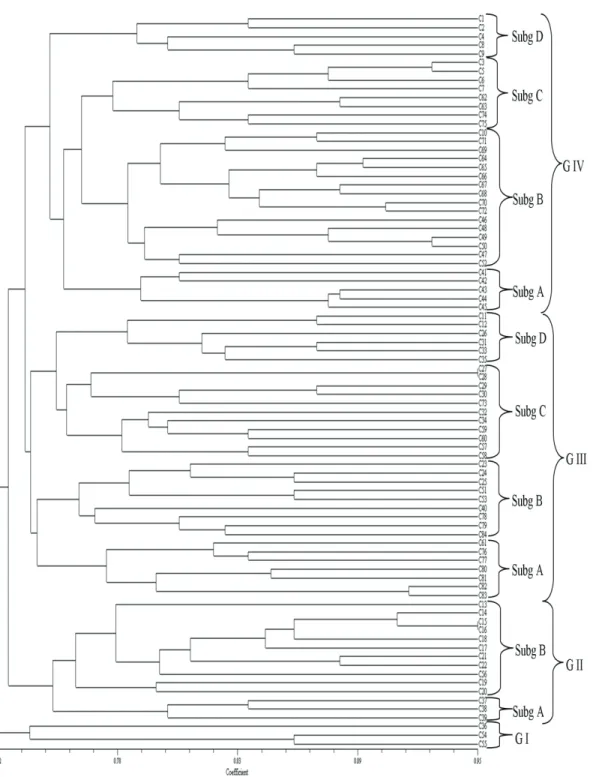
Cluster analysis divided the 84 landraces into several main groups, not always in accordance with their regional origins (Figure 1). These landraces are hugely different since we count four main different groups which contain two or three subgroups. 84 barley genotypes, except TUR 4698/TUR 4706 and TUR 1974/Tur 5790, could be distinguished. The landraces from Turkey were divided into two clusters. Subgroup A and B of cluster III and subgroup B and C of cluster IV, all had large numbers of landraces from Turkey. Landraces from USA were in cluster IV subgroup D, except one in cluster III subgroup D. The Russian landraces were spread across three clusters (I, II, III), with more lines in clusters III subgroup C than in the remainders. Most Chinese landraces were in cluster III, with only one exception in cluster II. Landraces from England were in cluster IV subgroup A. Mexican landraces were divided into cluster IV subgroup B and cluster II subgroup B. German landraces were in cluster II, III, and IV. Most of the Ukrainian and Polish landraces were in cluster IV, whereas most from Ethiopia were in cluster III, and most of Austria and the Netherland landraces were in cluster II. The results of our study support the ideas of Struss & Plieske (1998) who stated that cluster analysis could identify the genetic relationship of barley genotypes and demonstrates the potential and the ability of microsatellite markers for genetic discrimination in barley. It is also inferred that individuals with small exceptions representing different countries grouped together in the same root of dendrogram tree which were sequestered in the mixed clusters (Figure 1). Indeed, these findings can be easily figured out from the clustering positions of the countries of which were fully placed in the subgroupA of groupIV and subgroupB of groupII for England (C41-C44) and Austria (C17-C21), respectively (Figure 1). However, an opposite mixed clustering
pattern occurred for landraces originated from the Netherlands (C36-C40) and these corresponding samples were separated into three different groups (Group I, II, III). Also, a misclassification was observed as a mixed clustering of Russian based seven barley (C54-60) (Figure 1). This might be due to the extended genetic profile of these seven Russian landraces. So, more detailed research might be provided by using large collections. Thus, results obtained from further imperative phylogenetic work will be effective while we are trying to construct the breeding material in line with our prospects. Additionally, our results showed that geographic distance alone may not explain genetic diversity between countries.
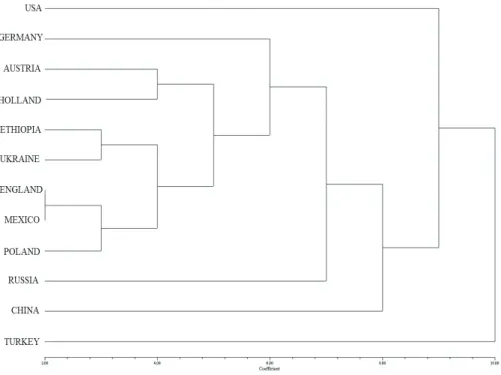
Genetic relationships among countries were further studied by cluster analysis (Figure 2). A cluster chart was drawn according to the similarity values which were calculated by using the amplification results of corresponded barley landraces. The coefficient of similarity ranged from 0.16 to 0.94. Countries are divided into seven clusters as shown in the dendrogram tree (Figure 2). While ten countries (Turkey, USA, China, Russia, Germany, Austria, Netherland, Ethopia, Ukraine and Poland) are placed in the distinct groups of dendrogram tree, England and Mexico are found in the same group,. This result strengthens previous reports on the correlation between eco-geographical distribution and SSR markers. As a supporting example, Fu & Horbach (2012) reported that continental distances between eastern and western countries caused a regional classification. Eco-geographical diversity analysis is typically applied to identify “centers of diversity”. The monophyletic nature of barley domestication is demonstrated based on allelic frequencies at AFLP loci in wild and cultivated barley (Badr et al 2000). Israel-Jordan were considered as the region in which barley was brought into culture and Himalayas is a region of domesticated barley domestication. However, Morell and Clegg (2006) inferred at least two domestication of barley; one within Fertile Crescent and second 1,500-3,000 km farther east. In the other studies, origin of center for cultivated
Figure 1- Dendrogram tree of 84 barley landraces; Subg, subgroups; G, groups
barley was stated as Tibet (Yang et al 2008; Sun et al 2011). So, genetic diversity of barley has been mostly studied in Asian derived varieties. It was continued with the Africa, Europe, America and Australia (Jilal 2011). However, these origin centers can change over time, as breeding and germplasm exchange continues (Peeters 1988). This might be formed within the population due to the genetic shift in time (Malysheva-Otto et al 2007).
In this study, the highest genetic diversity was found in landraces from Turkey. This may be explained by a much longer evolutionary history of barley landraces in Turkey. In most of the phylogenetic studies, it was primarily designed to trace both genetic diversity and geographic origin of a plant. It is one of the best practical ways to clarify the germplasm sources during domestication. There are several reports regarding to determine the country of origin and relatedness of crops for
several kinds of cereals such as wheat (Zhang et al 2006), broomcorn millet (Hu et al 2009). At different time intervals, there are number of reports released about barley evaluation. In a research by Leišová et al (2007), the authors screened a core collection of 176 barley accessions originated from European, eastern (America) and western (Asia and Australia) part of the world by using 26 microsatellite loci and indicated that Czech varieties and varieties from America, Australia and Asia are clustered in the different roots of dendrogram. These authors concluded that it was one of the evidence about the distinction of European based genotypes from the remaining group of samples originated from eastern and western countries and this type of large extension between varieties might be associated with age, botanical characters and especially country of origin for barley.
Figure 2- Country profiles of barley landraces
4. Conclusions
The result of our present study revealed that the barley landraces preserved in CRIFC seed genebank has great genetic diversity. Especially accessions from Turkey possess higher genetic diversity than foreign accessions. Assessment of genetic diversity in landraces preserved in genebank by SSR markers is important for barley improvement effort. Namely, genotyping data for landraces provide a general guide not only for designing crossing in breeding programme, but also for detecting duplications of accessions in collection.
References
Ahmed M (2002). Assessment of genomic diversity among wheat genotypes as determined by simple sequence repeats. Genome 45(4): 646-651
Badr A, Muller K, Schafer-Pregl R, El Rabey H, Effgen S, Ibrahim H H, Pozzi C, Rohde W & Salamini F (2000). On the origin and domestication history of barley (Hordeum vulgare). Molecular Biology Evolution
17(4): 499-510
Becher S A, Steinmetz K, Weising K, Boury S, Peltier D, Renou J P, Kahl G & Wolff K (2000). Microsatellites for cultivar identification in Pelargonium. Theoretical
and Applied Genetics 101(4): 643-651
Dizkirici A, Guren H E, Onde S, Temel F, Akar T, Budak H & Kaya Z (2008). Microsatellite (SSR) variation in barley germplasm and its potential use for marker assisted selection in scald resistance breeding.
International Journal of Integrative Biology 4(1):
9-15
Fu Y & Horbach B (2012). Genetic diversity in a core subset of wild barley germplasm. Diversity 4(2): 239-257
Hagenblad J, Zie J & Leino M W (2012). Exploring the population genetics of genebank and historical landrace varieties. Genetics Resources and Crop
Evolution 59(6): 1185-1199
Hokanson S C, Szewc-McFadden A K, Lamboy W F & McFerson J R (1998). Microsatellite (SSR) markers reveal genetic identities, genetic diversity and relationships in a Malus × domestica borkh. core subset collection. Theoretical and Applied Genetics
97(5): 671-683
Hu X, Wang J, Lu P & Zhang H (2009). Assessment of genetic diversity in broomcorn millet (Panicum
miliaceum L.) using SSR markers. Journal of Genetics and Genomics 36(8): 491-500
Jilal A (2011). Assessment of genetically diverse international barley germplasm for development of food product applications. Dissertation, Southern Cross University
Jones H, Lister D L, Bower M A, Leigh F J, Smith L M J & Jones M K (2008). Approaches and constraints of using existing landraces and extant plant material to understand agricultural spread in prehistory. Plant
Genetic Resources 6(2): 98-112
Kishore G, Gupta S & Pandey A (2012). Assessment of population genetic diversity of Fagopyrum tataricum using SSR molecular marker. Biochemical Systematic
and. Ecology 43: 32-41
Leišová L, Kučera L & DotLačiL L (2007). Genetic resources of barley and oat characterized by microsatellites. Czech Journal of Genetics and Plant
Breeding 43(3): 97-104
Li C D, Rossnagel B G & Scoles G J (2000). The development of oat microsatellite markers and their use in identifying relationships among Avena species and oat cultivars. Theoretical and Applied Genetics
101(8): 1259-1268
Liu Z W, Biyashev R M & Saghai-Maroof M A (1996). Development of simple sequence repeat DNA markers and their integration into a barley linkage map. Theoretical and Applied Genetics 93: 869-876 Lopes M S, Sefc K M, Eiras D, Steinkellner E, Laimer
da Câmara Machado H M & da Câmara Machad A (1999). The use of microsatellites for germplasm management in a Portuguese grapevine collection.
Theoretical and Applied Genetics 99(3-4): 733-739
Macaulay M, Ramsay L, Powell W & Waugh R (2001). A representative, highly informative ‘genotyping set’ of barley SSRs. Theoretical and Applied Genetics
102(6-7): 801-809
Malysheva-Otto, L, Ganal M W, Law J R, Reeves J C & Röder M S (2007). Temporal trends of genetic diversity in European barley cultivars (Hordeum
vulgare L.). Molecular Breeding 20(4): 309-322
Matus I A & Hayes P M (2002). Genetic diversity in three groups of barley germplasm assessed by simple sequence repeats. Genome 45(6): 1095-1106
Morrell P L & Clegg M T (2006). Genetic evidence for a second domestication of barley (Hordeum vulgare)
east of the Fertile Crescent. Proceedings of National
Academy of Sciences of the United States of America 104(9): 3289-3294
Nei M & Li W H (1979). Mathematical model for studying genetic variation in terms of restriction endonucleases. Proceedings of National Academy of
Sciences 76(10): 5269-5273
Peeters J P (1988). The emergence of new centres of diversity: evidence from barley. Theoretical and
Applied Genetics 76(1): 17-24
Prasad M, Varshney R K, Roy J K, Balyan H S & Gupta P K (2000). The use of microsatellites for detecting DNA polymorphism, genotype identification and genetic diversity in wheat. Theoretical and Applied
Genetics 100(3-4): 584-592
Rohlf F J (1993). NTSYS-pc version 1.80. Distribution by Exeter Software, Setauket, NewYork
Saavedra J, Silva T A, Mora F & Scapim C A (2013). Bayesian analysis of the genetic structure of a Brazilian popcorn germplasm using data from simple sequence repeats (SSR). Chilean Journal of
Agricultural Research 73: 2
Saghai-Maroof M A, Biyashev R M, Yang G P, Zhang Q & Allard R W (1994). Extraordinarily polymorphic microsatellite DNA in barley: Species diversity, chromosomal location, and population dynamics.
Proceedings of National Academy of Sciences 91(12):
5466-5470
Schuster I, Elisa V S N, Silva G J, Franco F A & Marchioro V S (2009). Genetic variability in Brazilian wheat cultivars assessed by microsatellite markers. Genetics
and Molecular Biology 32(3): 557-563
Senior M L, Murphy J P, Goodman M M & Stuber C W (1998). Utility of SSRs for determining genetic similarities and relationships in maize using an agarose gel system. Crop Science 38: 1088-1098 Sipahi H (2011). Genetic screening of Turkish barley
genotypes using simple sequence repeat markers.
Journal of Cell and Molecular Biology 9(2): 19-26
Sneath P H A & Sokal R R (1973). Numerical Taxonomy. Freeman, San Francisco
Struss D & Plieske J (1998). The use of microsatellite markers for detection of genetic diversity in barley populations. Theoretical and Applied Genetics 37(1-2): 2308-2315
Sun D, Ren W, Sun G & Peng J (2011). Molecular diversity and association mapping of quantitative traits in Tibetan wild and worldwide originated barley (Hordeum vulgare L.) germplasm. Euphytica 178(1): 31-43
Varshney R K, Chabane K, Hendre P, Aggarwal R K & Graner A (2007). Comparative assessment of EST-SSR, EST-SNP and AFLP markers for evaluation of genetic diversity and conservation of genetic resources using wild, cultivated and elite barleys.
Plant Science 173(6): 638-649
Veasey E A, Borges A, Rosa M S, Queiroz-Silva J R, Bressan E A & Peroni N (2008). Genetic diversity in Brazilian sweet potato (Ipomoea batatas (L.) Lam., Solanales, Convolvulaceae) landraces assessed with microsatellite markers. Genetics and Molecular
Biology 31(3): 725-733
Weber J L (1990). Informativeness of human (dC-dA) n (dG-dT)n polymorphisms. Genomics 7(4): 524-530 Westman A L & Kresovich S (1999). Simple sequence
repeat (SSR)-based marker variation in Brassica
nigra genebank accessions and weed populations. Euphytica 109(2): 85-92
Yang S, Wei Y, Qi P & Zheng Y (2008). Sequence polymorphisms and phylogenetic relationships of hina gene in wild barley from Tibet, China. Agricultural
Sciences in China. 7(7): 796-803
Yeh, F, Yang C & Boyle T (1999). POPGENE Version1.32: Microsoft Window-based Freeware for Population Genetic Analysis. University of Alberta, Edmonton Zhang P, Dreisigacker S, Buerkert A, Alkhanjari S,
Melchinger A E, Warburton M L (2006). Genetic diversity and relationships of wheat landraces from Oman investigated with SSR markers. Genetic
Resources and Crop Evolution 53(7): 1351-1360
Zeven A C (1998). Landraces: A review of definitions and classifications. Euphytica 104(2): 127-139