Computational Biology and Chemistry 92 (2021) 107491
Available online 22 April 2021
1476-9271/© 2021 Elsevier Ltd. All rights reserved.
Research Article
Structure-based virtual screening for novel potential selective inhibitors of
class IIa histone deacetylases for cancer treatment
Ammar D. Elmezayen, Yelekçi Kemal
*
Department of Bioinformatics and Genetics, Faculty of Engineering and Natural Sciences, Kadir Has University, 34083, Cibali, Istanbul, Turkey
A R T I C L E I N F O Keywords:
Structure-based virtual screening Selective HDAC inhibitors ADMET
MD simulation MM-PBSA
A B S T R A C T
The fundamental cause of human cancer is strongly influenced by down- or up-regulations of epigenetic factors. Upregulated histone deacetylases (HDAC) have been shown to be effectively neutralized by the action of HDACs inhibitors (HDACi). However, cytotoxicity has been reported in normal cells because of non-specificity of several available HDACis that are in clinical use or at different phases of clinical trials. Because of the high amino acid sequence and structural similarity among HDAC enzymes, it is believed to be a challenging task to obtain isoform-selectivity. The essential aim of the present research work was to identify isoform-selective inhibitors against class IIa HDACs via structure-based drug design. Based on the highest binding affinity and isoform- selectivity, the top-ranked inhibitors were in silico tested for their absorption, distribution, metabolism, elimi-nation, and toxicity (ADMET) properties, which were classified as drug-like compounds. Later, molecular dy-namics simulation (MD) was carried out for all compound-protein complexes to evaluate the structural stability and the biding mode of the inhibitors, which showed high stability throughout the 100 ns simulation. Free binding energy predictions by MM-PBSA method showed the high binding affinity of the identified compounds toward their respective targets. Hence, these inhibitors could be used as drug candidates or as lead compounds for more in silico or in vitro optimization to design safe isoform-selective HDACs inhibitors.
1. Introduction
Histone acetylation and deacetylation mechanisms are essential parts of gene regulation. Histone acetylation is linked to transcription-ally active chromatin while deacetylation is involved in the formation of the transcriptionally inactive heterochromatin (Kim and Workman, 2010). Histone deacetylation is regulated by histone deacetylases (HDACs) that remove the acetyl group from lysine residues on histone tails. This will help in the formation of the heterochromatin and inac-tivate the gene transcription (Kurdistani and Grunstein, 2003). In human, 18 different HDACs have been found and categorized into four classes according to their cellular localization and sequence identity. These enzymes are either zinc-dependent enzymes namely HDAC, or nicotinamide adenine dinucleotide (NADH) dependent enzymes called sirtuin proteins (Dokmanovic et al., 2007). Zinc-dependent HDACs are 11 enzymes and further grouped into several subclasses according to their homology to yeast proteins: class I (HDACs 1, 2, 3 and 8), class II (HDACs 4, 5, 6, 7, 9, 10), and class IV (HDAC 11) (Yang and Seto, 2008). Class III members are NADH-dependent proteins and consist of seven
sirtuin enzymes (Sirt1–Sirt7) (Frye, 2000). Class II HDACs are large in size and further subdivided into two classes based on the number of the catalytic domains; class IIa HDACs (HDAC4, HDAC5, HDAC7 and HDAC9) have a single catalytic domain, while class IIb enzymes (HADC6 and HDAC10) have two catalytic domains (Haggarty et al., 2003; Asfaha et al., 2019).
Over recent decades, HDAC enzymes have proved to be promising targets of caner fighting drug design. Several studies have shown the impact of class IIa HDACs in disease development in different organs and tissues, such as cancer, diabetes, muscle degenerative disorders, neurological and immunological disorders (Zhong et al., 2018; Wilson et al., 2008; Von Blume et al., 2007; Patrick Walters et al., 1998; Mor-iguchi et al., 1992; Moresi et al., 2010; Gil et al., 2016; Wang et al., 2021).
Based on the chemical structure of HDACs inhibitors, they are generally classified into carboxylates, hydroxamic acids, benzamides, and cyclic peptides and depsipeptide inhibitors. So far, only four HDAC inhibitors have been approved for treatment of cancer by the Food and Drug Administration (FDA) including the pan-inhibitor suberoylanilide
* Corresponding author.
E-mail address: [email protected] (Y. Kemal).
Contents lists available at ScienceDirect
Computational Biology and Chemistry
journal homepage: www.elsevier.com/locate/cbac
https://doi.org/10.1016/j.compbiolchem.2021.107491
hydroxamic acid (SAHA/Vorinostat) (Mann et al., 2007), Belinostat (PXD101) and Romidepsin (FK228) (Lee et al., 2015; Bertino and Otterson, 2011), and Panobinostat (LBH589) (Laubach et al., 2015). There are several HDAC inhibitors that are proposed for the treatment of different non-solid and solid cancers (Ho et al., 2020). Tasquinimod was proposed to be a potential HDACi that is used for treatment of patients with castration-resistant prostate cancer (CRPC) (Olsson et al., 2010;
Dalrymple et al., 2012). A structural hybridization between the hydroxamic acids and the benzamides of class I HDAC inhibitors resul-ted in a new class IIa selective inhibitor, namely LMK235. The hydro-phobic dimethyl of the cap group in LMK235 fits better in the active site of class IIa than class I and led to increase in the selectivity toward HDAC4 and HDAC5 (Marek et al., 2013). TMP269 and TMP195 are two class IIa HDAC inhibitors in which the classical hydroxamic acid group was replaced by a trifluoromethyloxadiazolyl group (TFMO) that mimics the trifluoromethylketone (TFMK) (Lobera et al., 2013). BRD4354 is another class IIa HDACs inhibitor and is one of the most potent compounds that contain hydroxyquinoline as the zinc-triggered electrophile. BRD4354 lacks the zinc binding group and showed po-tential inhibition activity against HDAC5 and HDAC9 with IC50 of 0.85
and 1.88 μM, respectively (Boskovic et al., 2016). CHDI-390,576 is a
new class IIa selective HDAC inhibitor, that was designed by a structural modification in the cap region of the benzhydryl hydroxamic acids. CHDI-390,576 was found to inhibit class IIa with a half-maximal inhibitory concentration of 0.031~0.051 μM (Luckhurst et al., 2019).
2-trifluoroacetylthiophenes is a class II HDAC inhibitor that was devel-oped from ethyl 5-(trifluoroacetyl)thiophene-2-carboxylate with increased specificity toward class IIa and HDAC6 with a half-maximal inhibitory concentration of ~0.22 μM. (Jones et al., 2008). BML-210
is a weak benzamide derivative inhibitor, that can bind to the hydro-phobic moiety of MEF2 by its aminophenyl group (Jayathilaka et al., 2012). However, previous mentioned HDACs inhibitors have shown a variety of undesired effects that comes with their inhibition influence against numerous HDACs through numerous classes. Hence, current study has aimed is to identify novel isoform selective HDAC compound to avoid side effects and keep the cancer-fighting action of broad-spectrum HDACs inhibitors.
Latest advances in the computer technologies and new
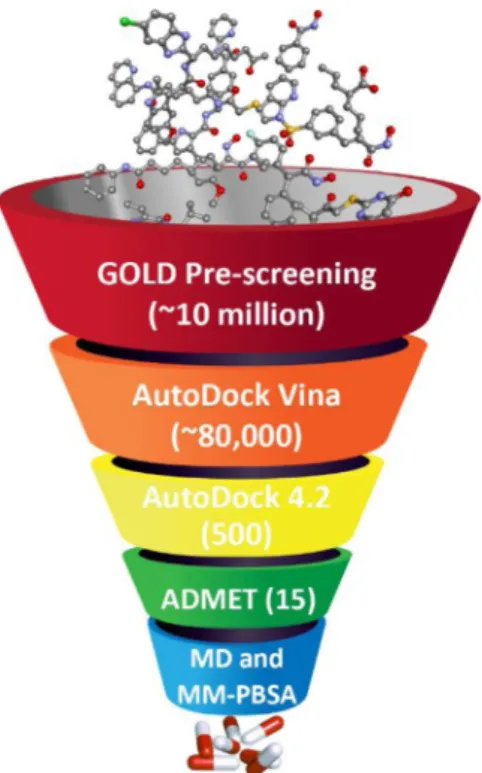
computational modeling tools provided a robust boost to the area of computer-aided drug design (CADD) (Macalino et al., 2015; Al-Obaidi et al., 2020; Erensoy et al., 2020). There are several successful appli-cations of virtual screening in class IIa HDAC drug design. In 2017, Hsu and colleagues demonstrated six novel non-hydroxamate inhibitors that preferentially target class IIa HDACs (Hsu et al., 2017). Sinha et al. in 2017 found a hydroxamic based class IIa inhibitor for the treatment of ataxia Type-2 using 3D-QSAR and pharmacophore modeling approach (Sinha et al., 2017). Various filtering approaches can be utilized to exclude small molecules with undesired chemical properties. One of the important approaches is to eliminate compounds that contain toxic, reactive, or any other unwanted properties. Drug-likeness is one of the crucial steps in virtual screening that evaluates the safety of oral drugs, such as the well-known Lipinski’s rule of five applications (Lipinski et al., 1997). The current study aimed to identify novel selective class IIa HDAC inhibitors by the application of several computational drug dis-covery approaches including virtual screening, molecular docking, ADMET analysis, molecular dynamics simulations and ligand-protein free binding energy calculation (Fig. 1).
2. Materials and methods
2.1. Class IIa HDAC proteins preparation
The 3D structures of HDAC5 and HDAC9 were generated by ho-mology modeling approach as reported in our previous work ( Elme-zayen and Yelekçi, 2020) and, thus were used in the current study. In addition, the next X-ray crystallography structures of human HDAC were downloaded from the Protein Data Bank (PDB) website (http://www.rcsb.org/) (Berman et al., 2002): (i) HDAC4 (2VQM) “the structure of human HDAC4 catalytic domain bound to a hydroxamic acid inhibitor, resolution: 1.80 Å” (Bottomley et al., 2008); (ii) HDAC7 (3C10) “the crystal structure of catalytic domain of human HDAC7 in complex with Trichostatin A (TSA), resolution: 2.00 Å” (Schuetz et al., 2008). Native ligands (the co-X-ray crystallography resolved ligands), water molecules, and salt ions were next removed from each structure using BIOVIA Discovery Studio 4.5 (DS) (Dassault Syst`emes, 2016). Using the “Prepare Protein” protocol in BIOVIA DS 4.5, hydrogen atoms were added to proteins at physiological pH 7.4, and missing loops were added if necessary.
2.2. Dataset preparation
A total of 10,154,992 compounds were downloaded from several databases including ZINC15 database (https://zinc15.docking.org/) (Sterling and Irwin, 2015), ChEMBL (https://www.ebi.ac.uk/chembl/) (Gaulton et al., 2017), and the National Cancer Institute (NCI) (https:// cactus.nci.nih.gov/index.html) (Milne et al., 1994). The dataset con-tains 3D tranches drug-like compounds which have a variety of molec-ular weights ranging from 200 to 500 MW, and octanol-water partition coefficient (LogP) ranging from -1 to 5. The small molecules were pro-tonated, all hydrogen atoms are included, and their 3D structures were optimized using BIOVIA DS 4.5. The dataset was retrieved in SDF file format.
2.3. Structure-based virtual screening
Structure-based virtual screening (SBVS) is a computational method that has proved its liability and efficiency in searching for novel lead, lead-like, and drug-like compounds and is most widely employed by in silico labs (Patrick Walters et al., 1998). In the current study, the SBVS method has been divided into three stages, where each stage used different molecular docking software in order to reduce the large number of the dataset and to filter out compounds with the least binding affinity, by taking advantage of each software’s capabilities. The first SBVS stage used GOLD docking software, the second SBVS used
QuickVina 2.0, and the third SBVS used AutoDock 4.2. Validation for the molecular docking study, which employed in our research work, was performed by re-docking the co-crystallized ligands, hydroxamic acid and Trichostatin A (TSA), into the active sites of HDAC4 (2VQM) and HDAC7 (3C10), respectively, using GOLD, QuickVina 2 and AutoDock 4.2. The validation reproduced poses of the co-crystallized ligands very well as they displayed reasonably similar poses of the native ones as shown in the Supplementary Material Fig. S1. The RMSD for the su-perposition of the co-crystallized hydroxamic acid revealed that, GOLD determined with 0.57 Å, QuickVina 2 with 1.59 Å, and AutoDock with 1.2 Å. The re-docking results of RMSD for TSA showed that, GOLD determined with 0.76 Å, QuickVina 2 with 1.85 Å, while AutoDock with 1.59 Å. Therefore, these docking approaches were found to be reliable for reproducing poses similar to the co-crystallized ones and accordingly can be employed for the virtual screening in our study.
2.3.1. Phase I of SBVS
GOLD docking software was used for its high speed and efficiency in high-throughput screening (HTS) of large compounds dataset. GOLD was first introduced in our study because of its capability in handling large libraries with thousands or hundreds of thousands of small mole-cules, and to reduce our large dataset to the best fitting compounds based on their pose prediction scores to exclude those with least scores. GOLD software provides four different scoring functions: ChemPLP, ChemScore, GoldScore, and ASP (the Astex Statistical Potential), where ChemPLP is an empirical fitness function, which is optimized for pose prediction and generally has shown better results compared to other GOLD’s scoring functions (Li et al., 2014; CCDC, 2017; Jasper et al., 2018). Docking experiments were performed using the ChemPLP scoring function, and the 10,154,992 compounds were screened against HDACs 4, 5, 7, and 9. The binding site for each protein was centered close to the catalytic zinc atom and the box size was set to 10 Å, where the XYZ coordinates were set as follows: HDAC7 = 7.8, 49.864, -18.724; HDACs 4, 5 and 9 = 19.199, -10.083, -1.089. GOLD performed 10 genetic al-gorithms runs for each ligand. Moreover, HDACs class IIa known in-hibitors were retrieved from the ChEMBL website and were docked against their respective HDAC. Preliminary investigations of the docking results showed that the highest fit values were as follows: HDAC4 = 88, HDAC5 = 70, HDAC7 = 95, and HDAC9 = 80. The criteria of selection after the GOLD docking study were made according to the previous fit values. Thus, the large dataset was reduced to a total of 89,632 mole-cules (HDAC4 = 26,709; HDAsC5 = 24,173; HDAC7 = 18,702, and HDAC9 = 20,048).
2.3.2. Phase II of SBVS
Phase II was conducted to further reduce the number of the outcome from Phase I according to the binding energy calculations - rather than pose prediction only - to assure higher affinity toward class IIa HDACs and to decisively filter out compounds with least binding affinity. In the second phase of the virtual screening, QuickVina 2.0 was used due to its relative fast screening compared to AutoDock 4.2 which was used in Phase III. QuickVina 2.0 is an AutoDock Vina-based tool that was designed for faster and more accurate results, where it automatically determines the grid maps and ranks the outputs for simple interpretation (Alhossary et al., 2015). The scoring function of QuickVina 2.0 relies on the same scoring function of classical AutoDock Vina where the method combines between the knowledge-based and empirical approach. Due to the highly conserved amino acid sequence and the great resemblance among class IIa HDAC enzymes (Bottomley et al., 2008; Schuetz et al., 2008), the 89,632 ligands that displayed highest affinity toward their corresponding targets at the first SBVS phase, were additionally docked into each protein of the class (e.g., cross-docking). All individual members of class IIa HDACs were prepared and correctly protonated and saved as PDBQT using AutoDockTools (Morris et al., 2009). The configuration files for each protein were prepared and the exhaustive-ness was set to 8, the energy grid box size was set as (HDA7 = 20, 20, 20;
HDACs 4, 5, and 9 = 22.5, 22.5, 22.5) and the XYZ coordinates were specified as follows: HDAC7 = 7.8, 49.864, -18.724; HDACs 4, 5, and 9 = 19.199, -10.083, 1.089. Upon results analyses, the ligands were filtered according to their binding affinity, and, in order to end up with the highest binding affinity for the third stage of SBVS, all compounds with a binding energy (ΔG) of -8 kcal/mol or less were selected for the third SBVS stage, thus a total of 6325 compounds fulfilled this condition.
2.3.3. Phase III of SBVS
The final virtual screening stage was performed using AutoDock 4.2 (Morris et al., 2009) in order to identify the highest binding affinity among the tested dataset and to assess the selectivity among them to-ward each class IIa isoform. Therefore, based on the binding affinity, the top 500 compounds retrieved from previous stage were cross-docked against each individual member of class IIa HDACs using grid box size and XYZ coordinates given in Table 1. Searching for the ligand confor-mation in AutoDock 4.2 was calculated by the Lamarckian genetic al-gorithm, and twenty independent runs were allowed for each ligand using 25,000,000 energy evaluation.
2.4. Selection criteria of the isoform-selective compounds
In current study, the selection criteria of the isoform-selective com-pounds were directed by Bieliauskas and Pflum (Bieliauskas & Pflum, 2008). Authors demonstrated a thorough insight into the HDAC in-hibitors selectivity based on the inhibitory constant (Ki) of those
in-hibitors. Accordingly, the following formula was employed herein to evaluate the top-ranked compounds selectivity (Eq.1):
Selectivity for HDACx=
Kiof other HDACs isoform
Kiof HDACx (1)
Based on the calculated binding energy and the predicted Ki value
that was obtained from the AutoDock 4.2, a total of 15 compounds showed a wide range of selectivity for their respective proteins (HDAC4: 5, HDAC5: 3, HDAC7: 6, HDAC9: 1). In addition, to further test and evaluate the potency and selectivity of the 15 top-ranked compounds, the compounds were examined using AutoDock 4.2 as previously described in Phase III of SBVS, against other human HDACs proteins including class I HDAC1 (PDB: 4BKX) (Millard et al., 2013), HDAC2 (PDB: 7KBG) (Liu et al., 2020), HDAC3 (PDB: 4A69) (Watson et al., 2012) and HDAC8 (PDB: 1T64) (Somoza et al., 2004); class IIb HDAC6 (PDB: 5EDU) (Hai and Christianson, 2016) and the homology model of human HDAC10 that was previously reported by our research group in 2018, due to the lack of experimentally determined structure of human HDAC10 enzyme (Ibrahim Uba and Yelekçi, 2019).
2.5. ADMET profile description
ADMET descriptors including absorption, distribution, metabolism, elimination, and toxicity properties are significant in the computational drug discovery and design. There are several computational tools that combine in vivo and in vitro prediction of ADMET profile. In addition, ADMET profile has been successfully predicted in silico over the last
Table 1
Coordinate parameters and grid box size used for AutoDock 4.2.
HDAC4 HDAC5 HDAC7 HDAC9
Center X 19.199 19.199 7.8 19.199 Y − 10.083 − 10.083 49.864 −10.083 Z 1.089 1.089 −18.724 1.089 Dimension (Å) X 55 55 50 55 Y 55 55 50 55 Z 55 55 50 55
decade (Cheng et al., 2013). Herein, all 15 compounds were saved and uploaded as SMILES files, where the ADMET properties and drug-likeness were predicted using admetSAR 2.0 web server (http:// lmmd.ecust.edu.cn/admetsar2) (Yang et al., 2019) and SwissADME website (http://www.swissadme.ch/) (Daina et al., 2017). These prop-erties include Lipinski’s rule of 5 that calculates the molecular weight (MW), octanol-water partition coefficients (LogP), total number of hydrogen bond acceptors, and hydrogen bond donors (Lipinski et al., 2001); topological polar surface area (TPSA); Caco-2 cell permeability; and the water solubility.
2.6. Pan-assay interference compounds (PAINS) filter
In addition, pan-assay interference compounds (PAINS) filter was applied for all the 15 compounds using the PAINS Remover website (htt ps://www.cbligand.org/PAINS/) (Baell and Holloway, 2010). PAINS are identified as special structural properties that can lead to false pos-itive effects at certain cases during the virtual screening and can nonspecifically interact to random targets rather than a particular target (Baell and Holloway, 2010). Consequently, it is important to eliminate compounds with PAINS features to avoid false positive outcomes.
2.7. Molecular dynamics simulation
Molecular dynamics (MD) simulation has proved its importance in examining the structural stability of the proteins and in extracting important details about the conformational modifications in the protein- ligand binding. MD simulation is a computational simulation approach that allows the investigation of the physical movement and orientation of all atoms in the system, and thus, explores the dynamics and structures in detail. In the present study, seven isoform-selective complexes were sub-jected to MD simulation using NAMD package (Phillips et al., 2020), including HDAC4− CHEMBL2177655, HDAC4− CHEMBL3126309, HDAC5ZINC000033260361, HDAC5− CHEMBL2426361, HDAC7− CHEMBL1968496, HDAC7ZINC000009640741, and HDAC9− -CHEMBL1761559. The web server of CHARMM-GUI (http://www.ch armm-gui.org/) (Lee et al., 2016) was used to generate all the necessary input files for the MD simulation study. The web server of the CHARMM General Force Field (CGenFF) server (https://cgenff.umaryland.edu/) was utilized for the parameterization of all the seven ligands, in which the charges assignment and atoms typing were carried out (Vanommeslaeghe et al., 2010). The seven systems were water solvated applying the trans-ferable intermolecular potential with 3 points model (TIP3) and NaCl slat ions were added to neutralize the systems at 0.15 M concentrations. The first step of the MD simulation consisted of energy minimization for 20,000 steps by means of steepest descent method. The second step included restrained equilibration run for 10 ns at 310 K in constant number of atoms, volume, and temperature ensemble (NVT). Finally, all seven sys-tems were subjected to unrestrained 100 ns run in constant number of atoms, pressure, and temperature ensemble (NPT) with 2 fs of collection period, while the system’s coordinates were recorded into the trajectory files every 5000 steps. The MD simulation trajectory files were analyzed using VMD software (Humphrey et al., 1996) and the analyses included the root mean square deviation (RMSD), root mean square fluctuation (RMSF), radius of gyration (Rg), and potential energy. In addition, VMD software was also used for the analysis of the hydrogen bond number that formed by each compound with its respective HDAC isoform by calculating each frame in the trajectory file that was generated during the MD simulation. The protein–ligand complex stability and affinity of the ligand toward the receptor can be assessed the hydrogen bond analysis of each frame generated during the MD simulation. The hydrogen bonds formed by each ligand with TMPRSS2 in each frame were calculated and it is given in Fi
2.8. Binding free energy calculations
The Molecular Mechanics-Poisson-Boltzmann Surface Area (MM-
PBSA) (Massova and Kollman, 2000) is widely used approach for the prediction of the binding free energy, which provides more accurate calculations than the majority of molecular docking scoring functions and requires less computational processing than classic alchemical free energy approaches (Wang et al., 2019). Herein, this method was used to calculate the binding free energy for all the seven systems after MD simulations. The binding free energy of any given complex (protein-li-gand) can be expressed as follows (Eq. 2):
ΔGbind=ΔH − TΔS = 〈ΔEgas+ΔGpolarsol+ΔGnonpolarsol− TΔS〉 (2)
Herein, CaFE tools (Liu and Hou, 2016) was used to calculate the binding free energy for all studied complexes. The last 10 ns was extracted from all trajectory files after performing the MD simulations, and all necessary files including DCD, PSF and toppar files were pre-pared to be used by CaFE tools. The configuration file was created and the reciprocal size of the grid spacing was defined as 1.0 Å, while the internal and external dielectric constants were defined as 4.0 and 80.0, respectively.
3. Results and discussion
3.1. SBVS analysis
Perceptive variations within the active sites and the catalytic chan-nels of HDAC protein members can be beneficial in obtaining isoform-
Table 2
Calculated binding energy by AutoDock 4.2 of the hit compounds against each member of class IIa HDACs.
# Compound ID HDAC4 HDAC5 HDAC7 HDAC9 ΔG (kcal/
mol) ΔG (kcal/ mol) ΔG (kcal/ mol) ΔG (kcal/ mol) 1 CHEMBL2177655 −15.14 −10.16 − 12.36 − 10.51 2 CHEMBL3126309 −15.04 −12.74 − 12.64 − 11.94 3 CHEMBL236510 −13.18 −11.93 − 8.52 − 11.7 4 ZINC000095945790 −11.44 −10.49 − 10.06 − 10.31 5 ZINC000001058982 −9.81 −8.98 − 8.82 − 8.93 6 ZINC000033260361 −10.61 −11.81 − 10.37 − 9.83 7 CHEMBL2426361 −10.01 −11.27 − 9.63 − 10.16 8 CHEMBL529211 −8.6 −9.6 − 7.85 − 8.68 9 CHEMBL1968496 −11.25 −9.59 − 14.25 − 9.91 10 ZINC000009640741 −11.97 −11.07 − 14.67 − 11.17 11 NSC 23,217 −8.69 −7.42 − 11.16 − 8.22 12 ZINC000019704978 −11.37 −10.76 − 13.35 − 10.91 13 ZINC000514563218 −9.52 −9.75 − 11.8 − 9.81 14 ZINC000674197814 −9.08 −9.61 − 11.49 − 9.78 15 CHEMBL1761559 −7.16 −7.49 − 5.93 − 8.09 Table 3
Selectivity index of class IIa HDACs. Ki of specific HDAC is compared to the
nearest Ki of others for the same compound.
HDAC4 HDAC5 HDAC7 HDAC9
Selectivity Compounds K4 i(nM) K5i(nM) K7i(nM) K9i(nM) CHEMBL2177655 0.0080 35.73 0.8640 19.88 HDAC4 CHEMBL3126309 0.0094 0.458 0.5460 1.780 HDAC4 CHEMBL236510 0.2190 1.790 568.00 2.680 HDAC4 ZINC000095945790 4.0900 20.00 42.050 27.00 HDAC4 ZINC000001058982 64.650 261.0 342.00 282.0 HDAC4 ZINC000033260361 16.590 2.200 25.020 62.48 HDAC5 CHEMBL2426361 45.920 5.460 86.690 35.60 HDAC5 CHEMBL529211 492.00 91.00 1750.0 433.0 HDAC5 CHEMBL1968496 5.6200 94.20 0.0360 54.68 HDAC7 ZINC000009640741 1.6700 7.680 0.0175 6.540 HDAC7 NSC 23,217 426.00 3610 6.6300 938.0 HDAC7 ZINC000019704978 4.6500 12.99 0.1650 9.990 HDAC7 ZINC000514563218 104.80 71.18 2.2400 64.11 HDAC7 ZINC000674197814 219.53 89.90 3.7700 67.91 HDAC7 CHEMBL1761559 5670.0 3230 44,950 1160 HDAC9
selectivity (Bieliauskas & Pflum, 2008). In attempt to take advantage of that fact, here in the current study, we employed a comprehensive structure-based drug design testing more than 10 million drug-like compounds against class IIa HDAC enzymes. A total of fifteen com-pounds displayed potential selectivity toward their corresponding tar-gets according to their calculated binding energy and predicted inhibitory constant (Ki) (Table 2). Five compounds were selective for
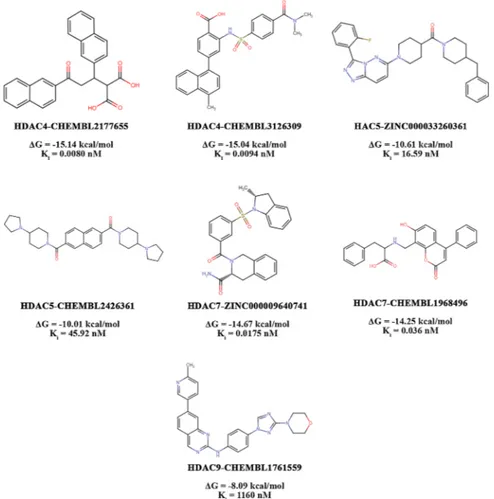
HDAC4 over the rest of class IIa HDACs; Three compounds were found to be selective for HDAC5; Six compounds selective for HDAC7; and one selective compound for HDAC9 (Table 3) (Fig. 2). The 2D structures of the rest of the 15 top-ranked compounds are provided in the Supple-mentary Material Fig. S2. To obtain the selectivity of a certain com-pound for specific HDAC member of the class IIa, the Ki of the same
compound for the four members of the HDAC is sorted from the lowest to the largest, and the second-lowest Ki is divided by the first lowest one.
Furthermore, to assure the selectivity of the top-ranked compounds to the members of class IIa HDACs compared to other HDAC enzymes, cross-docking study was performed using AutoDock 4.2 to estimate the compounds binding energy and predict their inhibitory constant against class I and IIb HDACs (Supplementary Material Tables S1 and S2). Interestingly, these compounds displayed higher binding affinity toward class IIa HDACs compared to other HDACs according to the calculated binding energy and the predicted inhibitory constant. Consequently, these in silico calculations suggest and support the isoform-selectivity of the top-ranked compounds toward class IIa HDACs. Noteworthy, ChEMBL compounds that were identified in our study have been pre-viously reported in several studies and displayed various activities to-ward different targets other than HDACs enzymes including activation and inhibition assays. A brief overview of other activities of these ChEMBL compounds are given in Supplementary Material Table S3.
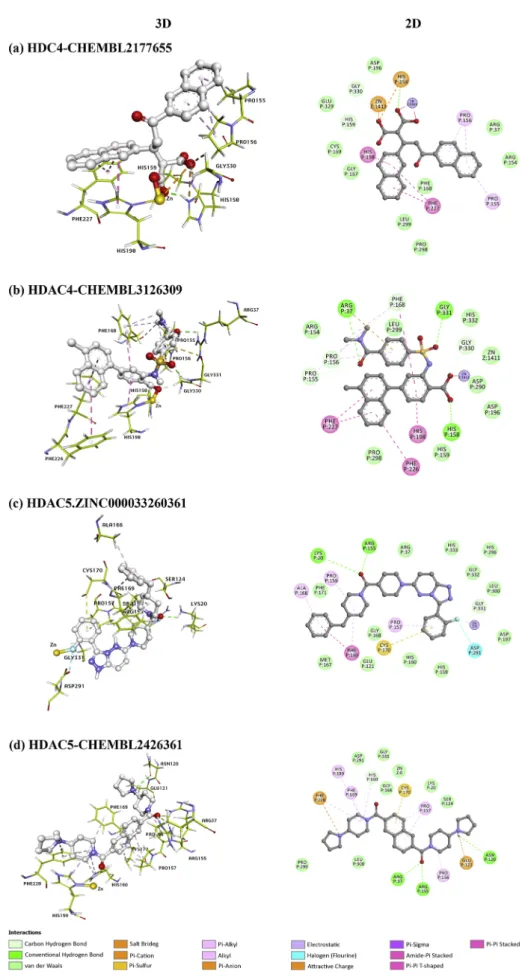
The top two ranked compounds that showed potential selectivity for HDAC4 over other HDACs are CHEMBL2177655 and CHEMBL3126309. Compound CHEMBL2177655 was found to have the highest binding affinity among all studied compounds, with an estimated binding energy of -15.14 kcal/mol and a predicted inhibitory constant of 8.0 pM (0.0080 nM). Compound CHEMBL2177655 revealed a potential selec-tivity for HDAC4 ranging from ~ 107 to 4400-fold compared to HDACs 5, 7 and 9. The second top-ranked compound, CHEMBL3126309 showed the second-highest affinity and selectivity for HDAC4, with an estimated binding energy of -15.04 kcal/mol and a predicted inhibitory constant of 9.4 pM (0.0094 nM). Compound CHEMBL3126309 displayed a prom-ising selectivity for HDAC4 ranging from ~48 to 189-fold compared to HDACs 5, 7 and 9. CHEMBL2177655 and CHEMBL3126309 compounds spanned the HDAC4 active site in very similar ways. They both inter-acted with the key amino acid residues in the catalytic site including His158, His159, Gly167, Phe168, Asp196, His198, Asp290, Gly330, and many other residues with the following interactions: hydrogen bonds, van der Waals interactions, attractive charge, π-π stacked, π-π T-shaped, π-alkyl, alkyl, π-cation (Fig. 3 (a) and (b)). Deep in the catalytic channel,
the catalytic Zn2+metal atom was found to be bonded to the carboxylate
groups of CHEMBL2177655 compound via an electrostatic and an attractive charge interaction; and an electrostatic interaction with the carboxylate group of CHEMBL3126309 compound. This collectively may result in blocking the catalytic site and thus lead to the inhibition of the enzymatic activity.
Thorough molecular docking study identified three moderate HDAC5 isoform selective compounds, and the top two-ranked com-pounds are ZINC000033260361 and CHEMBL2426361. Compound ZINC000033260361 bonded to HDAC5 with an estimated binding en-ergy of -10.61 kcal/mol and a predicted inhibitory constant (Ki) of
Fig. 2. Top-ranked selective compounds for class IIa HDACs obtained from Phase III of SBVS using AutoDock 4.2. ΔG: calculated binding energy. Ki: predicted
Fig. 3. 2D and 3D presentations of the chemical interactions between the top-ranked compounds and their respective HDAC isoform. (a) HDAC4− CHEMBL2177655;
16.59 nM. In comparison to all class IIa HDACs, the ZINC000033260361 compound revealed a moderate selectivity for HDAC5 ranging between ~ 8 to 28-fold. On the other hand, compound CHEMBL2426361 was the second HDAC5 isoform selective compound which showed a binding energy of -10.01 kcal/mol and a predicted inhibitory constant (Ki) of
45.92 nM. Compound CHEMBL2426361 exhibited a moderate isoform selectivity for HDAC5 ranging from 7 to 16-fold over the rest of class IIa HDACs family. In HDAC5, ZINC000033260361 and CHEMBL2426361 compounds fitted very well into the binding pocket of the enzyme with great binding affinity compared to the remaining of class IIa HDACs. These two compounds were found to have a variety of chemical in-teractions with the active amino acid residues lining the binding pocket of the enzyme involving His159, His160, Gly168, Phe169, Asp197, His199, Asp291, Gly331 and other several residues through different
chemical interactions including salt bridge interaction, van der Waals interactions, hydrogen bonds, π-cation, π-sulfur interaction, alkyl, π-alkyl, amide-π stacked interactions (Fig. 3 (c) (d)). The catalytic Zn2+
metal atom was found to be interacted with the fluorobenzene group of the ZINC000033260361 compound with an electrostatic interaction; and interacted with CHEMBL2426361 via a van der Waals interaction. Wilcken et al. computed electrostatic potentials of halobenzenes using MP2/TZVPP method. From these results they obtained strong evidence that fluorobenzene does not follow the same trend as the other hal-obenzenes (Cl, Br, I). Fluorine on benzene ring has a considerable electronegativity and there is no positively charged area, therefore behaving as nucleophile toward electrophile (Wilcken et al., 2013). These findings were also supported with the weak interaction of fluoride atom on the trifluoromethyloxadiazoles with the cofactor Zn2+
Fig. 4. 2D and 3D presentations of the chemical interactions between the top-ranked compounds and their respective HDAC isoform. (a) HDAC7-
described as HDAC IIa non-coordinating inhibitors (Lobera et al., 2013). These two above-mentioned compounds showed potential isoform-selectivity for HDAC5 over other class IIa enzymes.
SBVS identified six promising HDAC7 enzyme selective drug-like compounds that showed a diversity in the binding affinity level. Ac-cording to the binding affinity, the top two compounds are ZINC000009640741 and CHEMBL1968496. The first top-ranked mole-cule, ZINC000009640741, demonstrated the highest binding affinity toward HDAC7 with the lowest binding energy (-14.67 kcal/mol) and has a predicted inhibitory constant of 0.0175 nM (17.5 pM). The second compound, CHEMBL1968496, showed a binding energy with a score of -14.25 kcal/mol and a Ki of 0.036 nM (36 pM). Compound
ZINC000009640741 favorably bonded to HDAC7 with a selectivity index ranging between ~ 95 to 438-fold compared to the rest of the class IIa HDACs. Whereas compound CHEMBL1968496 preferentially expressed higher selectivity toward HDAC7 compared to HDACs 4, 5, and 9 (about 156 to 2616-fold). Both compounds, ZINC000009640741 and CHEMBL1968496, spanned the deep catalytic tunnel of the active site of HDAC7, where they interacted with most of the key amino acid residues in the active site including His166, His167, Gly175, Phe176, Asp204, His206, Asp235 (Fig. 4 (a) and (b)). ZINC000009640741 compound was found to be interacted with Zn2+ion through its
hy-droxyl group by an electrostatic interaction, while compound CHEMBL1968496 bonded to the Zn2+ion through its carboxyl group by
an electrostatic interaction. The common prevalent interactions of these two compounds included hydrogen bonds, van der Waals interactions,
π-π stacked, π-π T-shaped, π-alkyl, alkyl, and amide-π stacked
in-teractions. π-donor hydrogen bond was seen specifically in
ZINC000009640741 compound with Gly339, and a π-anion interaction
was formed between the benzene ring of CHEMBL1968496 and the Asp298 residue.
VS application identified compound CHEMBL1761559, which dis-played a binding energy of -8.09 kcal/mol and a predicted inhibitory constant (Ki) of 1160 nM against HDAC9. CHEMBL1761559 covered the
binding pocket of HDAC9 and interacted with several active residues within the catalytic pocket such as two hydrogen bonds with His199 and Phe169, and a π-π T-shaped interaction with Phe19. A π-cation
inter-action was seen between the Zn2+ ion and the benzene ring of the
compound. Additionally, other significant interactions were observed with several amino acid residues in the active site including hydrogen bonds, van der Waals interactions, π-alkyl, and alkyl interactions (Fig. 4
(c)). Although compound CHEMBL1761559 relatively showed the least binding affinity for HDAC9 in comparison to all other 15 tested
compounds, the compound displayed modest isoform-selectivity for HDAC9 compared to all other class IIa HDACs. With about 3 to 38-fold selectivity, CHEMBL1761559 compound revealed a higher binding af-finity toward HDAC9 compared to the rest of the enzymes.
All the selected compounds seemed to interact with the key amino acids lying within the active site; thus this would interfere with the charge-relay system of HDACs (Somoza et al., 2004), and consequently would interrupt this system which may block the enzymatic activity. The diversity in the structures of the previous tested compounds, considering their pharmacophoric features, along with the subtle variations in the amino acid residues within the active sites of each HDAC member, might have facilitated in their isoform-selectivity.
3.2. ADMET profile and PAINS filtration
The predicted ADMET profile of the 15 top-ranked compounds from the virtual screening is given in Table 4 along with their drug-likeness properties. These properties were predicted using the admetSAR and SwissADME web servers. According to Lipinski’s rule of 5, oral drugs must obey at least three of four properties: the molecular wight should not exceed 500 Da; the total number of hydrogen bond acceptors (including oxygen and nitrogen) must not exceed 10; the total number of hydrogen bond donors (including − OH and -NH) should not exceed 5; and the octanol-water partition coefficient (LogP) must not be more than 5 (or 4.15 as in Moriguchi model MLogP) (Moriguchi et al., 1992; Lip-inski et al., 2001). In addition, other important ADMET properties including water/aqueous solubility (LogS) should be > -5; TPSA must be less or equal to 140 Å2; and human colorectal adenocarcinoma cells
(Caco-2) Caco-2 permeability (cm/s) must be faster than 22 nm/s. All the 15 compounds obeyed the Lipinski’s rule of five except for two compounds ZINC000033260361 and NSC 23,217 where they had a MLogP more than 4.15. Even though, it is tolerated to have one violation of the rule of five for oral drugs according to Lipinski’s rule (Lipinski et al., 2001). Although compounds ZINC000514563218 and ZINC000674197814 exhibited a slightly increase in the TPSA with a value of 145.2 Å2, rational intestinal permeability can still be seen in drugs with a TPSA ranging between 140 and 150 Å2 (Lipinski, 2003).
The prediction of the Caco-2 permeability and the water solubility for all the 15 compounds were found to be within the normal range. Further-more, the 15 top-ranked compounds have been proved to be PAINS-free compound.
Table 4
Physicochemical properties of the 15 hits, including ADMET profiles and Lipinski’s rule of five parameters.
Compound MWa HAb HDc MLogP TPSAd HIAe Caco-2 WSf
CHEMBL2177655 412.43 5 2 3.61 91.67 0.9943 0.857 −3.008 CHEMBL3126309 488.55 5 2 2.47 112.16 0.8998 0.7953 −3.63 CHEMBL236510 485.62 4 2 3.27 76.64 0.9259 0.7631 −3.08 ZINC000095945790 489.48 5 2 2.73 117.16 0.9196 0.821 −3.271 ZINC000001058982 492.45 7 1 4.05 86.22 0.9268 0.6646 −3.616 ZINC000033260361 498.59 5 0 5.4 66.63 0.9845 0.7621 −3.379 CHEMBL2426361 488.66 4 0 3.39 47.1 0.993 0.798 −3.107 CHEMBL529211 452.59 2 3 3.35 54.53 0.9846 0.6446 −2.884 ZINC000009640741 475.56 4 1 2.48 109.16 0.9701 0.7725 −3.5 CHEMBL1968496 415.44 6 3 0.56 99.77 0.8145 0.9147 −2.998 NSC 23,217 404.53 0 2 5.37 56.15 0.964 0.5672 −4.616 ZINC000019704978 448.52 4 2 3.52 86.8 0.9904 0.8016 −2.739 ZINC000514563218 484.47 8 1 2.6 145.2 0.9771 0.8338 −3.376 ZINC000674197814 470.44 8 1 1.84 145.2 0.9771 0.8404 −3.277 CHEMBL1761559 464.52 6 1 2.6 93.88 0.9956 0.8111 −2.754
aMolecular weight, Da.
b Total number of H-bond acceptors, O and N. cTotal number of H-bond donors, OH and NH. dTopological polar surface area, Å2. eHuman intestinal absorption. fWater solubility, LogS.
3.3. Molecular dynamics simulation 3.3.1. RMSD analysis
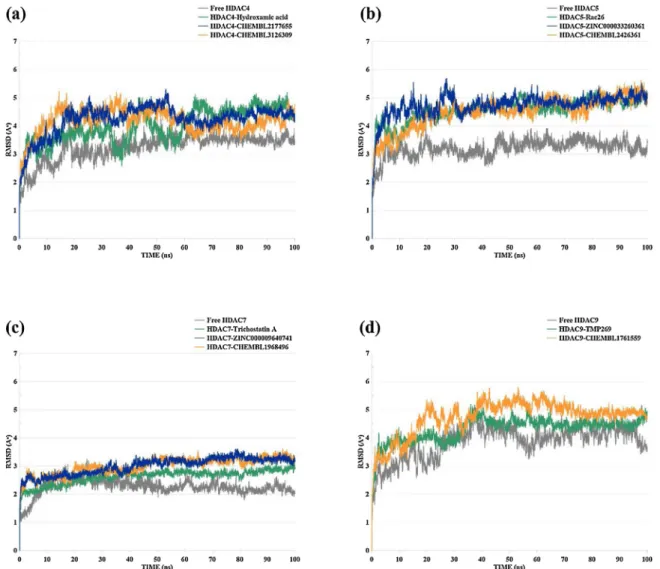
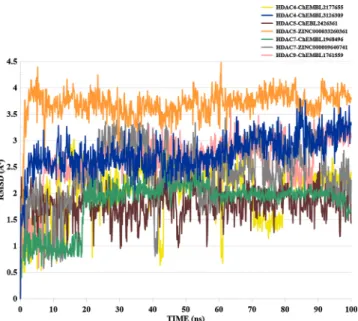
The root mean square deviation (RMSD) of the HDAC4 apo-protein (inhibitor-free), HDAC4-hydroxamic acid inhibitor (known inhibitor), HDAC4− CHEMBL2177655, and HDAC4− CHEMBL3126309 profiles have been evaluated throughout the 100 ns MD simulations (Fig. 5 (a)). HDAC4 apo-protein showed an initial increase till 20 ns around 4 Å, then remained stable between 3 and 3.5 Å till the end of the MD simulation. HDAC4-hydroxamic acid complex exhibited a higher fluctuation compared to the apo-protein, where the RMSD fluctuated between 2 and 5 Å till the 64 ns and thereafter displayed stable trend around 5 Å. The RMSD of the HDAC4− CHEMBL2177655 complex at first rose to 4.7 Å around 17 ns then gradually fell down to 4 Å around 55 ns and thereafter remained stable around 4.1 Å until the end of the MD simulation. Similarly, the RMSD of the HDAC4− CHEMBL3126309 ascended to 4.8 Å till 13 ns and then fell down to 3.7 Å near 62 ns and remained fluctuating between 3.5 and 4.2 Å until the end of the 100 ns run.
RMSD profiles were calculated during the 100 ns MD simulations for the HDAC5 apo-protein (ligand-free), HDAC5-Rac62 (known inhibitor), HDAC5-ZINC000033260361, and HDAC5− CHEMBL2426361 (Fig. 5
(b)). HDAC5 apo-protein RMSD was observed to slowly rose up to 3.4 Å around 12 ns and afterward it showed steady stable nature with an average RMSD of 3.2 Å to 100 ns. The average RMSD of HDAC5− -CHEMBL3110016 (Rac-26 known inhibitor) was found to be 4.5 Å be-tween the 22 ns and until the end of the MD run. The RMSD of HDAC5-
ZINC000033260361 and HDAC5− CHEMBL2426361 complexes were well converged and exhibited relatively comparable stability after the 32 ns with an average of 4.6 Å and 4.4 Å, respectively.
The RMSD of the HDAC7 apo-protein, HDAC7-Trichostatin A, HDAC7-ZINC000009640741, and HDAC7− CHEMBL1968496 were analyzed after the MD run and presented in (Fig. 5 (c)). Remarkably, all HDAC7 complexes retained their steady-stable equilibrium below 3.5 Å throughout the MD simulation. The RMSD of the free HDAC7 protein initially increased to 3.2 Å around 25 ns and later kept slowly decreasing through time to reach 2.1 Å around 100 ns. Both HDAC7- ZINC000009640741 and HDAC7− CHEMBL1968496 systems were shown to display similar minor fluctuation and stability state after the 47 ns with an average RMSD of 3.3 Å and 3.1 Å, respectively.
Lastly, the RMSD analysis was performed for the free HDAC9 protein, HDAC9-TMP269 (known inhibitor), and HDAC9− CHEMBL1761559 during the 100 ns MD run (Fig. 5 (d)). The free HDAC9 RMSD was seen to rise up to 5.2 Å around 37 ns and then fluctuated between 3.4 Å and 4.6 Å during the 53 and 57 ns and thereafter remained in equilibrium state until the end of the MD run. HDAC9-TMP269 RMSD profile was observed to gradually elevated up to 5.2 Å around 34 ns and then decreased to 4.6 Å over 43 ns and remained in its equilibrium state until the end. The RMSD of HDAC9− CHEMBL1761559 preliminary increased to 5.5 Å until 43 ns and then stabilized until the end of the 100 ns with an average RMSD of 5.2 Å. Ligands RMSD analyses are shown in Fig. 6. ZINC000033260361 compound showed higher RMSD compared to other compounds, which fluctuated in the range of 3.5 and 4 Å.
CHEMBL1968496 and CHEMBL2426361 compounds maintained their stability with a slight deviation in a range of 1.5–2 Å over the simulation time. CHEMBL3126309 and CHEMBL1761559 compounds revealed relatively similar stability where their RMSD fluctuated in range of 2.5 and 3 Å. CHEMBL2177655 compound moderately showed higher RMSD
fluctuation during the simulation and then maintained its stability after the 80 ns with deviation in a range of 2.3 Å. These calculations can suggest the stability of these compounds and their binding with the key residues of their respective targets and additionally confirm the mo-lecular docking results.
3.3.2. RMSF analysis
In order to fully assess the dynamics of the protein’s backbone, the root mean square fluctuation (RMSF) profile was analyzed for all amino acids throughout the MD simulation. RMSF helps in describing local variations during the MD run along the protein sequence. During MD simulations, higher RMSF profiles are presented by higher flexible re-gions within the protein such as loops. High stable rere-gions of the pro-teins are indicated by the low RMSF values and highly flexible atoms are located within loops regions. RMSF analysis of HDAC4 apo-protein, HDAC4hydroxamic acid, CHEMBL2177655, and HDAC4− -CHEMBL3126309 are shown in (Fig. 7 (a)). The RMSF of the HDAC5 apo-protein (ligand-free), HDAC5-Rac62 (known inhibitor), HDAC5- ZINC000033260361, and HDAC5− CHEMBL2426361 are illustrated in (Fig. 7 (b)). The RMSF of the HDAC7 apo-protein (free protein), HDAC7- Trichostatin A, HDAC7ZINC000009640741, and HDAC7− -CHEMBL1968496 are shown in (Fig. 7 (c)). The RMSF profile of the free HDAC9 protein, HDAC9TMP269 (known inhibitor), and HDAC9− -CHEMBL1761559 during the 100 ns MD runs are presented in (Fig. 7
(d)). The highest peaks in the RMSF plots represent the loop regions that are known for their high flexibility. These regions include the following amino acid residues: HDAC4 (Leu17-Gly36, Thr81, Asn82, Gln87- Leu94, and Phe102-Ile117); HDAC5 (Lue19-Gly36, Thr81-Pro83, Lys88-Leu94, and Lys101-Val118); HDAC7 (Leu48-Ala64 and Thr110-
Fig. 6. Ligands RMSD calculations that produced during the 100 ns MD
simulations.
Ser131); HDAC9 (Lue19-Gly36, Thr81, Asn82, Lys88-Leu94, and Lys101-Ile118).
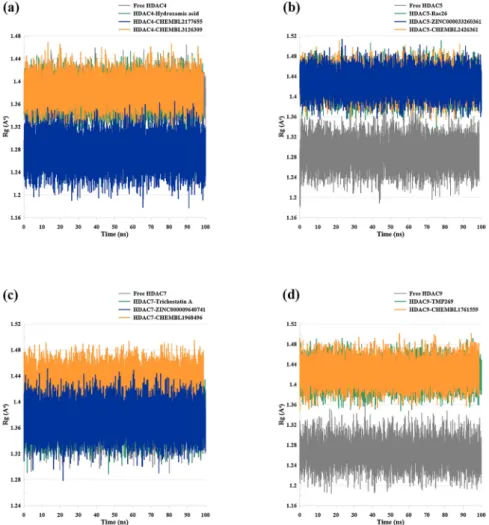
3.3.3. Rg analysis
Analysis of the compactness level of a protein is useful to fully un-derstand the protein folding level. This analysis is denoted by the radius of gyration (Rg). Higher degree of Rg describes higher flexibility of the protein, while lower level of Rg implies less flexibility. Furthermore, steady level of Rg indicates firmly folded protein, whereas changes in Rg values refer to alteration in protein folding. The Rg of HDAC4 systems seemed to be stable throughout the MD run with average values of 1.37 Å for both the apo-protein and HDAC4-hydroxamic acid complex, 1.27 Å for HDAC4− CHEMBL2177655, and 1.38 Å for HDAC4− -CHEMBL3126309 (Fig. 8 (a)). The Rg profile of all HDAC5 systems were also remained stable during the 100 ns MD simulations with average Rg of 1.28 Å for the apo-protein, 1.42 Å for the HDAC5-Rac26, HDAC5- ZINC000033260361, and HDAC5− CHEMBL2426361 (Fig. 8 (b)). All systems of HDAC7 were found to be stable throughout the MD simula-tions over the 100 ns run time with an average Rg value of 1.37 Å for the apo-protein, HDAC7-Trichostatin A, and HDAC7-ZINC000009640741, whereas the Rg of HDAC7− CHEMBL1968496 complex was found to be 1.43 Å (Fig. 8 (c)). Lastly, the average Rg value of the apo-protein of HDAC9 was found to be 1.26 Å, while the average Rg value for HDAC9- TMP269 and HDAC9− CHEMBL1761559 was 1.42 Å (Fig. 8 (d)). All HDAC9 systems remained stable over time.
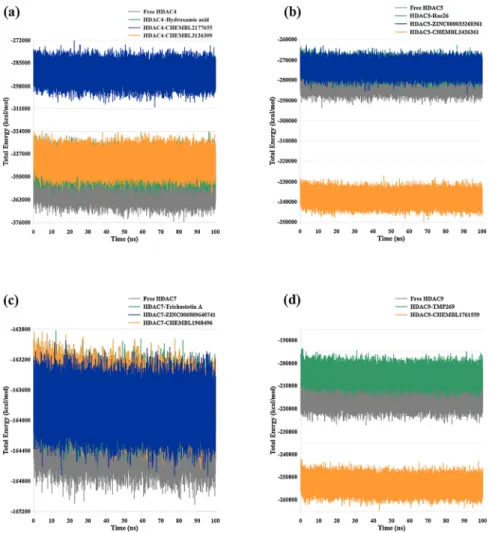
3.3.4. Potential energy profile
The potential energy measurement is beneficial in validating the energy consistency and stability during the MD simulations. Herein, the
total energy is plotted as potential energy versus run time, and all studied systems proved to be energetically stable throughout the MD run (Fig. 9).
3.3.5. Number of hydrogen bonds
In all living systems, the molecular interactions are highly influenced by the presence of hydrogen bonds. Hydrogen bonds are crucial in regulating the changes in the secondary structures that in turn influence the protein-ligand interactions. During MD simulation, proteins can be found in different conformations mimicking real biological environ-ments. Each of these conformations may provide a different protein- ligand interaction. Thus, the number of hydrogen bonds formed throughout the MD simulation was calculated for the selected isoform selective compounds (Fig. 10). In HDAC4− CHEMBL2177655 complex, the maximum number of H-bonds formed was found to be 5 during the MD simulation. In the first 19 ns, many conformations showed 3 H- bonds, and less showed 4 H-bonds. The majority of the conformations showed two hydrogen bonds (Fig. 10 (a)). On the other hand, HDAC4− CHEMBL3126309 showed at most 3 H-bonds during the simulation (Fig. 10 (a)). Most of the conformations showed 1 H-bonds and about 60 % showed 2 H-bonds. HDAC5-ZINC000033260361 com-plex showed at most 4 H-bonds in few conformations and more two H- bonds after the first 6 ns of the simulation. It also had at least 1 H-bond in most of the conformations (Fig. 10 (b)). The greatest number of con-formations in HDAC5− CHEMBL2426361 complex showed 1 H-bonds, and one conformation with 3 H-bonds (Fig. 10 (b)). The largest number of H-bonds seen in HDAC7-ZINC000009640741 complex was 3 in one conformation and the average number of H-bonds formed was found to be 2 (Fig. 10 (c)). HDAC7− CHEMBL1968496 complex showed one
Fig. 9. The potential energy plots of (a) HDAC4 systems; (b) HDAC5 systems; (c) HDAC7 systems; and (d) HDAC9 systems.
conformation with 4 H-bonds, and many with 3 H-bonds in the first 53 ns. In addition, most of the conformations formed 2 H-bonds during the first 57 ns of the simulation, and thereafter, the complex retained in average 1 H-bond till the end of the simulation (Fig. 10 (c)). Lastly, HDAC9− CHEMBL1761559 complex formed up to 3 H-bonds in several conformations during the simulation and consisted of at least 1 H-bond over time (Fig. 10 (d)).
Throughout the MD simulations, all the examined inhibitors were found to be stable and stayed interacted to their respective proteins at physiological condition. MD simulation approach has been effectively performed to assess the stability of different HDACs inhibitors. Several inhibitors were tested for their selectivity against all HDACs classes by performing short MD simulation for 5 ns (Thangapandian et al., 2012). In another study, novel HDAC inhibitors were investigated along with Vorinostat and tested against class II HDACs, in which their structural stability was subjected to short 5 ns MD run (Tambunan et al., 2013). In the present study, all the seven selected compounds-HDAC complex systems, the apo-proteins, and the known-inhibitor-HDACs complexes were subjected to a long 100 ns MD simulation. Analysis of the MD trajectories were found to be satisfied and all other parameters were consistent throughout the simulation including the RMSD, RMSF, Rg, and potential energy.
3.4. Binding free energy (MM-PBSA) calculations
CaFE tools were used in the present study to calculate average free binding energy of the studied isoform selective compounds (Table 5). The tools calculate the free binding energy average using the MM-PBSA method in addition to the standard deviation/error for each protein- ligand complex. The binding energy represents the interaction be-tween the protein and the ligand (e.g., the released energy throughout the formation of the bonds). Higher binding affinity between the ligand and protein complex is identified by lesser binding energy. The total binding energy is a summation of electrostatic, van der Waals, SASA and polar solvation energy. Even though the free binding energy calculation using MM-PBSA method is not entirely related to the experiments, this method would still deliver a rational binding affinity for protein-ligand complex (Ngo and Li, 2012; Chakraborty and Das, 2017; Koukoulitsa et al., 2016). Herein, based on the MM-PBSA calculations, CHEMBL2177655 compound displayed more negative energy than CHEMBL3126309 compound when bonded to HDAC4, and thus more binding affinity. The two selective compounds of HDAC5 were re-ranked according to the free binding energy predictions, where CHEMBL2426361 revealed more negative energy than ZINC000033260361. The same observation was seen with the two HDAC7 inhibitors, CHEMBL1968496 showed more negative energy than ZINC000009640741, which was ranked first after the molecular docking study. The MM-PBSA calculations revealed more negative binding energies compared to the molecular docking study suggesting again that the selected compounds could possibly be promising hits in the discovery of class IIa HDACs selective inhibitors.
4. Conclusions
To overcome challenges in drug discovery, structure-based drug design was applied in the present study through in silico screening of ~10,000,000 drug-like compounds retrieved from ZINC15, ChEMBL, and NCI databases against class IIa HDAC enzymes. Combined HTS and molecular docking approaches were performed to guarantee the highest binding affinity and specificity of the studied compounds. A total of 15 compounds obtained from the virtual screening (5 compounds for HDAC4; 3 compounds for HDAC5; 6 compounds for HDAC7; and 1 compound for HDAC9) have displayed specificity for their correspond-ing isoform by applycorrespond-ing similar selectivity criteria employed by other reported studies on selective inhibitors for HDACs. In addition, reported compounds have revealed drug-like properties and their physicochem-ical properties (ADMET) were found to be in an acceptable range. Moreover, molecular dynamics simulation was carried out to evaluate the structural dynamics and the stability of apo-proteins of the isoforms, the selective inhibitor-protein complexes, and their known inhibitor- protein complexes. While systems are solvated in the presence of water molecules, all the studied compounds persisted bound to their respective isoform throughout the 100 ns MD simulation. Comparative examinations of the trajectories after the MD simulations (including RMSD, RMSD, Rg, and potential energy parameters) in addition to the H- bond number suggested the stability of the complexes over time. The free binding energy predictions using MM-PBSA approach showed high affinity of the selected compounds toward their corresponding HDAC isoforms. These findings suggest that the reported inhibitors could be used for further optimization and undergo in vitro examination for designing of selective inhibitors for class IIa HDACs.
Declaration of Competing Interest
The authors report no declarations of interest.
CRediT authorship contribution statement
Ammar D. Elmezayen and Kemal Yelekçi perceived the
experi-ment(s). Ammar D. Elmezayen performed the experiexperi-ment(s). Ammar
D. Elmezayen and Kemal Yelekçi investigated the results. Ammar D. Elmezayen drafted the manuscript. Kemal Yelekçi reviewed and
proofread the manuscript.
Funding
This research did not receive any specific grant from funding agencies in the public, commercial, or not-for-profit sectors.
Acknowledgements
ADE and KY would like to thank the Research and Development Resources of Kadir Has University.
Appendix A. Supplementary data
Supplementary material related to this article can be found, in the online version, at doi:https://doi.org/10.1016/j.compbiolchem.20 21.107491.
References
Alhossary, A., Handoko, S.D., Mu, Y., Kwoh, C.K., 2015. Fast, accurate, and reliable molecular docking with QuickVina 2. Bioinformatics. 31, 2214–2216. https://doi. org/10.1093/bioinformatics/btv082.
Al-Obaidi, A., Elmezayen, A.D., Yelekçi, K., 2020. Homology modeling of human GABA- AT and devise some novel and potent inhibitors via computer-aided drug design techniques. J. Biomol. Struct. Dyn. 1–11. https://doi.org/10.1080/
07391102.2020.1774417.
Table 5
Calculated binding free energy (MM-PBSA) of the selected isoform HDACs se-lective complexes.
Complex Binding Energy (kJ/mol)
HDAC4-CHEMBL2177655 −31.3569 ± 20.17 HDAC4-CHEMBL3126309 −21.4164 ± 6.996 HDAC5-ZINC000033260361 −21.0986 ± 5.264 HDAC5-CHEMBL2426361 −55.2850 ± 8.694 HDAC7-ZINC000009640741 −17.4562 ± 13.00 HDAC7-CHEMBL1968496 −56.7090 ± 6.336 HDAC9-CHEMBL1761559 −27.2031 ± 3.478
Asfaha, Y., Schrenk, C., Alves Avelar, L.A., Hamacher, A., Pflieger, M., Kassack, M.U., Kurz, T., 2019. Recent advances in class IIa histone deacetylases research. Bioorg. Med. Chem. Lett. 27, 115087 https://doi.org/10.1016/j.bmc.2019.115087. Baell, J.B., Holloway, G.A., 2010. New substructure filters for removal of pan assay
interference compounds (PAINS) from screening libraries and for their exclusion in bioassays. J. Med. Chem. 53, 2719–2740. https://doi.org/10.1021/jm901137j. Berman, H.M., Battistuz, T., Bhat, T.N., Bluhm, W.F., Bourne, P.E., Burkhardt, K.,
Feng, Z., Gilliland, G.L., Iype, L., Jain, S., Fagan, P., Marvin, J., Padilla, D., Ravichandran, V., Schneider, B., Thanki, N., Weissig, H., Westbrook, J.D., Zardecki, C., 2002. The protein data bank. Acta Crystallogr. Sect. D Biol. Crystallogr. 58, 899–907. https://doi.org/10.1107/S0907444902003451.
Bertino, E.M., Otterson, G.A., 2011. Romidepsin: A novel histone deacetylase inhibitor for cancer. Expert Opin. Investig. Drugs 20, 1151–1158. https://doi.org/10.1517/ 13543784.2011.594437.
Boskovic, Z.V., Kemp, M.M., Freedy, A.M., Viswanathan, V.S., Pop, M.S., Fuller, J.H., Martinez, N.M., Figueroa Lazú, S.O., Hong, J.A., Lewis, T.A., Calarese, D., Love, J.D., Vetere, A., Almo, S.C., Schreiber, S.L., Koehler, A.N., 2016. Inhibition of zinc- dependent histone deacetylases with a chemically triggered electrophile. ACS Chem. Biol. 11, 1844–1851. https://doi.org/10.1021/acschembio.6b00012.
Bottomley, M.J., Lo Lo Surdo, P., Di Di Giovine, P., Cirillo, A., Scarpelli, R., Ferrigno, F., Jones, P., Neddermann, P., De Francesco, R., Steinkühler, C., Gallinari, P., Carfí, A., 2008. Structural and functional analysis of the human HDAC4 catalytic domain reveals a regulatory structural zinc-binding domain. J. Biol. Chem. 283, 26694–26704. https://doi.org/10.1074/jbc.M803514200.
CCDC, 2017. GOLD Scoring Function Performance Against the DUD Decoy / Active Set Aims, pp. 1–8. https://www.ccdc.cam.ac.uk/support-and-resources/ccdcresources/ VS_workcase.pdf.
Chakraborty, S., Das, P., 2017. Emergence of alternative structures in amyloid Beta 1-42 monomeric landscape by N-terminal hexapeptide amyloid inhibitors. Sci. Rep. 7, 9941. https://doi.org/10.1038/s41598-017-10212-5.
Cheng, F., Li, W., Liu, G., Tang, Y., 2013. In silico ADMET prediction: recent advances, current challenges and future trends. Curr. Top. Med. Chem. 13, 1273–1289. https:// doi.org/10.2174/15680266113139990033.
Daina, A., Michielin, O., Zoete, V., 2017. SwissADME: A free web tool to evaluate pharmacokinetics, drug-likeness and medicinal chemistry friendliness of small molecules. Sci. Rep. 7, 1–13. https://doi.org/10.1038/srep42717.
Dalrymple, S.L., Becker, R.E., Zhou, H., Deweese, T.L., Isaacs, J.T., 2012. Tasquinimod prevents the angiogenic rebound induced by fractionated radiation resulting in an enhanced therapeutic response of prostate cancer xenografts. Prostate. 72, 638–648.
https://doi.org/10.1002/pros.21467.
Dassault Syst`emes, 2016. BIOVIA Discovery Studio Visualizer. V16.1.0.15350. Dokmanovic, M., Clarke, C., Marks, P.A., 2007. Histone deacetylase inhibitors: overview
and perspectives. Mol. Cancer Res. 5, 981–989. https://doi.org/10.1158/1541- 7786.MCR-07-0324.
Elmezayen, A.D., Yelekçi, K., 2020. Homology modeling and in silico design of novel and potential dual-acting inhibitors of human histone deacetylases HDAC5 and HDAC9 isozymes. J. Biomol. Struct. Dyn. 1–19. https://doi.org/10.1080/
07391102.2020.1798812.
Erensoy, G., Ding, K., Zhan, C.G., Elmezayen, A., Yelekçi, K., Duracik, M., Bing¨ol ¨
Ozakpinar, ¨O., Küçükgüzel, ˙I., 2020. Synthesis, in silico studies and cytotoxicity evaluation of novel 1,3,4-oxadiazole derivatives designed as potential mPGES-1 inhibitors. J. Res. Pharm. 24, 436–451. https://doi.org/10.35333/jrp.2020.187. Frye, R.A., 2000. Phylogenetic classification of prokaryotic and eukaryotic Sir2-like
proteins. Biochem. Biophys. Res. Commun. 273, 793–798. https://doi.org/10.1006/ bbrc.2000.3000.
Gaulton, A., Hersey, A., Nowotka, M.L., Patricia Bento, A., Chambers, J., Mendez, D., Mutowo, P., Atkinson, F., Bellis, L.J., Cibrian-Uhalte, E., Davies, M., Dedman, N., Karlsson, A., Magarinos, M.P., Overington, J.P., Papadatos, G., Smit, I., Leach, A.R., 2017. The ChEMBL database in 2017. Nucleic Acids Res. 45, D945–D954. https:// doi.org/10.1093/nar/gkw1074.
Gil, V.S., Bhagat, G., Howell, L., Zhang, J., Kim, C.H., Stengel, S., Vega, F., Zelent, A., Petrie, K., 2016. Deregulated expression of HDAC9 in B cells promotes development of lymphoproliferative disease and lymphoma in mice, DMM Dis. Model. Mech. 9, 1483–1495. https://doi.org/10.1242/dmm.023366.
Haggarty, S.J., Koeller, K.M., Wong, J.C., Grozinger, C.M., Schreiber, S.L., 2003. Domain- selective small-molecule inhibitor of histone deacetylase 6 (HDAC6)-mediated tubulin deacetylation. Proc. Natl. Acad. Sci. U. S. A. 100, 4389–4394. https://doi. org/10.1073/pnas.0430973100.
Hai, Y., Christianson, D.W., 2016. Histone deacetylase 6 structure and molecular basis of catalysis and inhibition. Nat. Chem. Biol. 12, 741–747. https://doi.org/10.1038/ nchembio.2134.
Ho, T.C.S., Chan, A.H.Y., Ganesan, A., 2020. Thirty Years of HDAC Inhibitors: 2020 Insight and Hindsight. J. Med. Chem. 63, 12460–12484. https://doi.org/10.1021/ acs.jmedchem.0c00830.
Hsu, K.C., Liu, C.Y., Lin, T.E., Hsieh, J.H., Sung, T.Y., Tseng, H.J., Yang, J.M., Huang, W. J., 2017. Novel class IIa-Selective histone deacetylase inhibitors discovered using an in silico virtual screening approach. Sci. Rep. 7, 3228. https://doi.org/10.1038/ s41598-017-03417-1.
Humphrey, W., Dalke, A., Schulten, K., 1996. VMD: Visual molecular dynamics. J. Mol. Graph. 14, 33–38. https://doi.org/10.1016/0263-7855(96)00018-5.
Ibrahim Uba, A., Yelekçi, K., 2019. Homology modeling of human histone deacetylase 10 and design of potential selective inhibitors. J. Biomol. Struct. Dyn. 37, 3627–3636.
https://doi.org/10.1080/07391102.2018.1521747.
Jasper, J.B., Humbeck, L., Brinkjost, T., Koch, O., 2018. A novel interaction fingerprint derived from per atom score contributions: exhaustive evaluation of interaction
fingerprint performance in docking based virtual screening. J. Cheminform. 10, 15.
https://doi.org/10.1186/s13321-018-0264-0.
Jayathilaka, N., Han, A., Gaffney, K.J., Dey, R., Jarusiewicz, J.A., Noridomi, K., Philips, M.A., Lei, X., He, J., Ye, J., Gao, T., Petasis, N.A., Chen, L., 2012. Inhibition of the function of class IIa HDACs by blocking their interaction with MEF2. Nucleic Acids Res. 40, 5378–5388. https://doi.org/10.1093/nar/gks189.
Jones, P., Bottomley, M.J., Carfí, A., Cecchetti, O., Ferrigno, F., Lo Surdo, P., Ontoria, J. M., Rowley, M., Scarpelli, R., Schultz-Fademrecht, C., Steinkühler, C., 2008. 2- Trifluoroacetylthiophenes, a novel series of potent and selective class II histone deacetylase inhibitors. Bioorganic Med. Chem. Lett. 18, 3456–3461. https://doi.org/ 10.1016/j.bmcl.2008.02.026.
Kim, J.H., Workman, J.L., 2010. Histone acetylation in heterochromatin assembly. Genes Dev. 24, 738–740. https://doi.org/10.1101/gad.1922110.
Koukoulitsa, C., Villalonga-Barber, C., Csonka, R., Alexi, X., Leonis, G., Dellis, D., Hamelink, E., Belda, O., Steele, B.R., Micha-Screttas, M., Alexis, M.N., Papadopoulos, M.G., Mavromoustakos, T., 2016. Biological and computational evaluation of resveratrol inhibitors against Alzheimers disease. J. Enzyme Inhib. Med. Chem. 31, 67–77. https://doi.org/10.3109/14756366.2014.1003928. Kurdistani, S.K., Grunstein, M., 2003. Histone acetylation and deacetylation in yeast.
Nat. Rev. Mol. Cell Biol. 4, 276–284. https://doi.org/10.1038/nrm1075. Laubach, J.P., Moreau, P., San-Miguel, J.F., Richardson, P.G., 2015. Panobinostat for the
treatment of multiple myeloma. Clin. Cancer Res. 21, 4767–4773. https://doi.org/ 10.1158/1078-0432.CCR-15-0530.
Lee, H.Z., Kwitkowski, V.E., Del Valle, P.L., Ricci, M.S., Saber, H., Habtemariam, B.A., Bullock, J., Bloomquist, E., Shen, Y.L., Chen, X.H., Brown, J., Mehrotra, N., Dorff, S., Charlab, R., Kane, R.C., Kaminskas, E., Justice, R., Farrell, A.T., Pazdur, R., 2015. FDA approval: belinostat for the treatment of patients with relapsed or refractory peripheral T-cell lymphoma. Clin. Cancer Res. 21, 2666–2670. https://doi.org/ 10.1158/1078-0432.CCR-14-3119.
Lee, J., Cheng, X., Swails, J.M., Yeom, M.S., Eastman, P.K., Lemkul, J.A., Wei, S., Buckner, J., Jeong, J.C., Qi, Y., Jo, S., Pande, V.S., Case, D.A., Brooks, C.L., MacKerell, A.D., Klauda, J.B., Im, W., 2016. CHARMM-GUI input generator for NAMD, GROMACS, AMBER, OpenMM, and CHARMM/OpenMM simulations using the CHARMM36 additive force field. J. Chem. Theory Comput. 12, 405–413. https:// doi.org/10.1021/acs.jctc.5b00935.
Li, Y., Han, L., Liu, Z., Wang, R., 2014. Comparative Assessment of Scoring Functions on an Updated Benchmark: 2. Evaluation Methods and General Results. J. Chem. Inf. Model. 54, 1717–1736. https://doi.org/10.1021/ci500081m.
Lipinski, C.A., 2003. Compound properties and drug quality. In: C.G.B.T.-T.P. of M.C. (Second E. Wermuth (Ed.), Pract. Med. Chem., second ed. Academic Press, London, pp. 341–349. https://doi.org/10.1016/B978-012744481-9/50025-8.
Lipinski, C.A., Lombardo, F., Dominy, B.W., Feeney, P.J., 1997. Experimental and computational approaches to estimate solubility and permeability in drug discovery and development settings. Adv. Drug Deliv. Rev. 23, 3–25. https://doi.org/10.1016/ S0169-409X(96)00423-1.
Lipinski, C.A., Lombardo, F., Dominy, B.W., Feeney, P.J., 2001. Experimental and computational approaches to estimate solubility and permeability in drug discovery and development settings. Adv. Drug Deliv. Rev. 46, 3–26. https://doi.org/10.1016/ S0169-409X(00)00129-0.
Liu, H., Hou, T., 2016. CaFE: A tool for binding affinity prediction using end-point free energy methods. Bioinformatics. 32, 2216–2218. https://doi.org/10.1093/ bioinformatics/btw215.
Liu, J., Yu, Y., Kelly, J., Sha, D., Alhassan, A.B., Yu, W., Maletic, M.M., Duffy, J.L., Klein, D.J., Holloway, M.K., Carroll, S., Howell, B.J., Barnard, R.J.O., Wolkenberg, S., Kozlowski, J.A., 2020. Discovery of highly selective and potent HDAC3 inhibitors based on a 2-Substituted benzamide zinc binding group. ACS Med. Chem. Lett. 11, 2476–2483. https://doi.org/10.1021/acsmedchemlett.0c00462. Lobera, M., Madauss, K.P., Pohlhaus, D.T., Wright, Q.G., Trocha, M., Schmidt, D.R., Baloglu, E., Trump, R.P., Head, M.S., Hofmann, G.A., Murray-Thompson, M., Schwartz, B., Chakravorty, S., Wu, Z., Mander, P.K., Kruidenier, L., Reid, R.A., Burkhart, W., Turunen, B.J., Rong, J.X., Wagner, C., Moyer, M.B., Wells, C., Hong, X., Moore, J.T., Williams, J.D., Soler, D., Ghosh, S., Nolan, M.A., 2013. Selective class IIa histone deacetylase inhibition via a nonchelating zinc-binding group. Nat. Chem. Biol. 9, 319–325. https://doi.org/10.1038/nchembio.1223. Luckhurst, C.A., Aziz, O., Beaumont, V., Bürli, R.W., Breccia, P., Maillard, M.C.,
Haughan, A.F., Lamers, M., Leonard, P., Matthews, K.L., Raphy, G., Stott, A.J., Munoz-Sanjuan, I., Thomas, B., Wall, M., Wishart, G., Yates, D., Dominguez, C., 2019. Development and characterization of a CNS-penetrant benzhydryl hydroxamic acid class IIa histone deacetylase inhibitor. Bioorganic Med. Chem. Lett. 29, 83–88.
https://doi.org/10.1016/j.bmcl.2018.11.009.
Macalino, S.J.Y., Gosu, V., Hong, S., Choi, S., 2015. Role of computer-aided drug design in modern drug discovery. Arch. Pharm. Res. 38, 1686–1701. https://doi.org/ 10.1007/s12272-015-0640-5.
Mann, B.S., Johnson, J.R., Cohen, M.H., Justice, R., Pazdur, R., 2007. FDA approval summary: vorinostat for treatment of advanced primary cutaneous T-Cell lymphoma. Oncologist. 12, 1247–1252. https://doi.org/10.1634/theoncologist.12- 10-1247.
Marek, L., Hamacher, A., Hansen, F.K., Kuna, K., Gohlke, H., Kassack, M.U., Kurz, T., 2013. Histone deacetylase (HDAC) inhibitors with a novel connecting unit linker region reveal a selectivity profile for HDAC4 and HDAC5 with improved activity against chemoresistant cancer cells. J. Med. Chem. 56, 427–436. https://doi.org/ 10.1021/jm301254q.
Massova, I., Kollman, P.A., 2000. Combined molecular mechanical and continuum solvent approach (MM- PBSA/GBSA) to predict ligand binding. Perspect. Drug Discov. Des. 18, 113–135. https://doi.org/10.1023/A:1008763014207.