Modeling Photoelectron Spectra of Conjugated Oligomers with Time-Dependent Density
Functional Theory
Ulrike Salzner*
Department of Chemistry, Bilkent UniVersity, 06800 Bilkent, Ankara, Turkey ReceiVed: June 17, 2010; ReVised Manuscript ReceiVed: September 8, 2010
With the aim of producing accurate band structures of conjugated systems by employing the states of cations, TDDFT calculations on conjugated oligomer radical cations of thiophene, furan, and pyrrole with one to eight rings were carried out. Benchmarking of density functional theory and ab initio methods on the thiophene monomer shows that the ∆SCF ionization potential (IP) is most accurate at the B3LYP/6-311G* level. Improvement of the basis set beyond 6-311G* leads to no further changes. The IP is closer to experiment at B3LYP/6-311G* than at CCSD(T)/CCPVQZ. For longer oligomers the ∆SCF IPs decrease too fast with increasing chain length with all density functionals. CCSD/6-311G* performs well if the geometries are optimized at the CCSD level. With MP2 geometries IPs decrease too fast. Peak positions in photoelectron spectra were determined by adding appropriate TDDFT excitation energies of radical cations to the ∆SCF IPs. The agreement with experiment and with Green function calculations shows that TDDFT excited states of radical cations at the B3LYP/6-311G* level are very accurate and that absorption energies can be employed to predict photoelectron spectra.
Introduction
Ultraviolet photoelectron spectroscopy (UPS) is an important tool for investigating the electronic structure of conducting organic polymers in neutral and doped states.1UPS measures
the kinetic energy of the photoelectrons and, by applying the law of energy conservation, provides the energies of various states of cations (n - 1 electron systems) that are produced when electrons with different binding energies are ionized. States of n - 1 electron systems correspond to energy levels of the
n-electron systems if the “one-electron approximation” is
ful-filled, that is, if the changes during the ionization process are dominated by removal of a single electron, influencing the remaining electrons only to a small extent.1Although the
one-electron approximation can never be exact, it holds ap-proximately in many cases, especially for valence energy levels. It is not full-filled for multiconfigurational ionic states and shakeup satellites.2Provided that the one-electron approximation
holds, UPS of alkali metal doped conducting organic oligomers or polymers (n + 1 electron systems) affords information about the energy levels of the anions and, in the presence of electron hole symmetry,3,4of the cations as well. Therefore, UPS is used
to investigate the band structures of doped forms of conducting organic oligomers and polymers.5-9
Theoretically UPS can be simulated via the one-electron approximation by employing band structure calculations and investigating the density of states (DOS). For obtaining energies of cations from band structure calculations, Koopmans’s theorem10
must hold, which is strictly speaking only true for Hartree-Fock (HF) and semiempirical wave functions as correlated wave functions do not provide one-electron energy levels and the meaning of orbital energies apart from that of the highest occupied molecular orbital (HOMO), is controversial in density functional theory (DFT).11-13Band structure calculations are
frequently done either with the valence electron Hamiltonian
(VEH)14technique or with DFT, usually in the local spin density
approximation (LSDA) despite the unclear theoretical justifica-tion of the latter. If theoretical and experimental first peaks are aligned, that means, if the theoretical data are shifted to reproduce the first measured IP, agreement between theory and experiment for the remaining peaks is usually quite acceptable.8,15
The goal of this study is exploring the possibility of improving theoretical UPS predictions and reproducing experimental gas phase data without adjustment.
The relationship between electron levels of the n-electron system and states of n - 1 electron systems suggests that there should be a correspondence between ultraviolet absorption (UV) spectra of radical cations and UP spectra of the neutral forms (ignoring the selection rules). Such a correspondence was demonstrated experimentally16 and theoretically.13 Therefore,
direct calculation of excited states of cations should allow for more accurate prediction of UP spectra than band structure calculations because excited state calculations include relaxation and correlation effects and can predict satellite states. The possibility of calculating states of cations directly is hardly explored. Excited states of the n - 1 systems can be computed with time-dependent density functional theory (TDDFT).17-19
Configuration interactions singles (CIS)20and time-dependent
Hartree-Fock (TDHF)21,22cannot be used because wave
func-tions of long conjugated radicals are highly spin contaminated. Higher level ab initio methods are not considered here, since the size of the systems in conducting polymer research prevents their use.
There are many issues with applying DFT to conjugated systems23 and with applying TDDFT to radical cations.24
Therefore the results have to be checked against experimental and other theoretical data. An important issue is the chain length dependence of the IPs. Then higher energy states of short and long chains are investigated. It will be shown that apart from a too fast decrease of the ∆SCF ionization potential (IP) with increasing chain lengths B3LYP results are very accurate. * Telephone: +90 312 290 2122. Fax: +90 312 266 4068. E-mail
address: [email protected].
10.1021/jp105588n 2010 American Chemical Society Published on Web 09/28/2010
Methods
Because thiophene25,26and furan27oligomers appear to be the
only systems for which experimental gas phase IPs are available, the investigation starts with benchmarking various levels of theory for obtaining the first ionization potential of thiophene oligomers with the ∆SCF method. The basis set dependence was tested employing (1) Stevens, Basch, Krauss pseudopo-tentials with polarized split valence basis sets (SBK),28 (2)
6-31G*,29 6-31+G*, and 6-311G*30,31 basis sets, and (3)
Dunning’s correlation consistent triple and quadruple-ζ32basis
sets (CCPVTZ, CCPVQZ). The theoretical methods tested are the Hartree-Fock (HF) method, Møller-Plesset perturbation theory second through fourth order (MP2-MP4), coupled-cluster singles doubles (CCSD), CCSD with approximate triples (CCSD(T)), density functional theory within the local spin density approximation (LSDA), a gradient corrected functional (BLYP), three-parameter hybrid functionals with different correlation functionals (B3LYP, B3P86), and B3P86 with increased amount of HF exchange (B3P86-30%). All calcula-tions were carried out with the Gaussian 0333and Gaussian 0934
program packages. For details about all methods and imple-mentation please refer to the Gaussian User’s Manual35 and
references therein.
The first IPs are obtained with the ∆SCF method as total energy difference between cation and neutral form. Structures of neutral species are fully optimized and allowed to be nonplanar. Equilibrium structures of thiophene and pyrrole oligomers are nonplanar,36while furan oligomers are planar.37
The geometries of the cations were not reoptimized, to model vertical IPs as measured with UPS. Zero point energy corrections were calculated at the B3LYP/6-311G* level. There is a small reduction of the fist IP of thiophene, -0.059 eV, furan, -0.025 eV, and pyrrole, -0.033 eV. Zero point energy corrections for longer oligomers were found to be smaller than 0.01 eV. Therefore no correction is necessary.
Higher IPs were obtained by carrying out TDDFT calculations on the cations and adding the appropriate excitation energies of the cations to ∆SCF IP. Appropriate excitations are the ones that transfer β-electrons to the semioccupied molecular orbital
(SOMO) of the cation, thereby creating holes in lower lying valence orbitals (Scheme 1).
UP spectra are assembled as follows: the first peak is the ∆SCF IP. The second IP is obtained by adding to the ∆SCF IP the excitation energy of transferring an electron from the HOMO to the SOMO. The third IP is the ∆SCF IP plus the excitation energy from HOMO-1 to SOMO and so on. The method will be abbreviated in the following as IP∆SCF/TD. Oscillator strengths
of the TD calculations predict the transition probabilities bet-ween cationic states and are related to intensities in absorption spectroscopy. They are meaningless for predicting the intensity of peaks in UPS and are therefore ignored.
The electronic excitations shown in Scheme 1 are single electron transitions. Some excited states, however, are composed of a number of different electronic transitions. States that are reached when the major electronic transition has a CI coefficient of 0.95-1.0 are considered to be single-electron states. When the CI coefficient is between 0.80 and 0.95, some electron relaxation is taking place and contributions from other electronic transitions are present. If coefficients of the main transition are below 0.80, the electronic states are multiconfigurational and the main electronic transition contributes also to a number of other peaks. When stick spectra are plotted, the squared CI-coefficients are used as Y-axes to indicate which peaks are single-electron transitions and which are not. The so obtained peak heights correlate roughly with pole strength of Green function theory as can be seen in the spectra calculated with algebraic diagrammatic construction (ADC),2which are used
for comparison. Results
First IP of the Thiophene Monomer. Ionization energies were measured for thiophene oligomers up to pentamer in the gas phase with an accuracy of (0.05 eV.25The gas phase IP of
the monomer has been determined many times. See for instance refs 2 and 38. The small size of the thiophene monomer allows benchmarking at high levels of theory. Differences between experimental IPs and theoretical ∆SCF IPs including ZPE
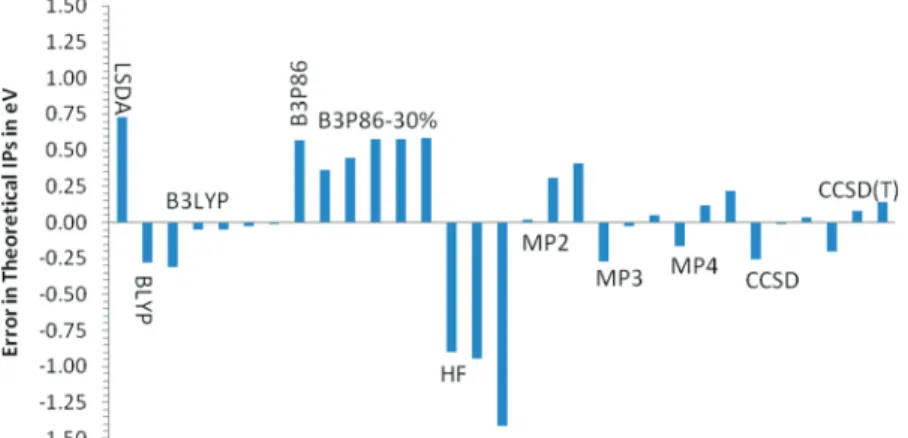
correction (-0.059 eV at B3LYP/6-311G*) are plotted in Figure 1. All data are given in Table S1 in the Supporting Information. The best agreement between theory and experiment is achieved with the B3LYP hybrid density functional. With the exception of the SBK pseudopotential basis set which in general leads to underestimation of the first IP, B3LYP results are almost independent of the basis set. Second closest to the experimental results are the CCSD values. The results depend more strongly on the basis set than with B3LYP and the trend goes toward increasing IP with increasing basis set. Triple corrections at the CCSD(T) level increase the IP leading to an overestimation with the largest basis sets. HF underestimates the IP, MP2 overshoots, and MPx shows slightly oscillating behavior. LSDA produces a very high IP, gradient correction at the BLYP level leads to underestimation. The B3P86 functional overestimates IPs more or less independently of the amount of HF exchange (20 or 30%).
It is interesting to note that there is a 0.3 eV decrease in the IP at the CCSD and CCSD(T) levels when the geometry is optimized at CCSD compared to when the MP2 geometry is used. The main difference between MP2 and CCSD geometries is that MP2 predicts longer double and shorter single bonds. For example the C-C bond lengths in thiophene are 1.4205 and 1.3801 Å at MP2/6-311G* and 1.4364 and 1.3686 Å at CCSD/6-311G*. The difference between single and double bonds is therefore 0.040 Å at MP2/6-311G* and 0.068 Å at CCSD/6-311G*. Although this might appear to be a substantial difference, the energy of the neutral species is hardly influenced by using different geometries. The energy difference between theCCSD(T)/CCPVQZ//CCSD/6-311G*andCCSD(T)/CCPVQZ// MP2/6-311G* calculations is only 0.04 kcal/mol. Thus the potential energy surface of neutral thiophene is very soft with respect to bond length changes and the neutral form can change its structure very easily. The large response of the vertical IP to geometry change shows that the potential energy of the cation is more rigid. This offers a rationalization of the wide peaks observed in gas phase UPS of thiophene2and limits the accuracy
with which the IP can be determined experimentally and theoretically.
Chain Length Dependence of the First IP of Thiophene Oligomers. First attempts to reproduce the gas phase data of oligomers with increasing chain length25,26showed that
theoreti-cal IPs tend to decrease faster with chain length than
experi-mental ones. Therefore dependence on the theoretical method was investigated with the 6-311G* basis set. Figure 2 shows that at the coupled cluster level, triple corrections have very little influence on IPs and on the slope. Calculating CCSD and CCSD(T) IPs on CCSD and MP2 geometries shows that the slope of IP versus inverse number of rings is smaller with CCSD structures. Like for the monomer, the energy of the neutral forms hardly changes but the energies of the cations depend on the geometries. Since the potential energy surfaces of the neutral species are flat, there will always be an uncertainty in the vertical ionization energies and especially in the trend with increasing chain length even at high levels of theory.
Figures 3 and 4 compare experimental and DFT IPs with different functionals. In all cases the slope is steeper than the experimental one. Analysis of interring dihedral angles revealed that DFT methods predict less twisting (about 31° with hybrid functionals) than MP2 or CCSD which agree about the inter-ring dihedral of around 40° for bi- and terthiophene. The experimental value for bithiophene is 34°.39 A calculation of
the IP of terthiophene with B3LYP/6-311G* at the MP2/6-311G* geometry showed, however, that the IP increases by only 0.03 eV. Thus reasonable increase in the interring angle does not influence the IP much. Calculating B3LYP IPs at CCSD geometries likewise did not decrease the slope by much, and the results remain close to the B3LYP IPs. The difference between the LYP and P86 correlation functionals is a parallel shift of the curves. The small difference between B3P86 and Figure 1. Differences between theory and experiment for the first IP of thiophene at various theoretical levels. All values include the ZPE correction of -0.059 eV evaluated at B3LYP/6-311G*. The order of the values is LSDA/6-311G*, BLYP/6-311G*, B3LYP/SBK, B3LYP/6-311G*, B3LYP/6-31+G*, B3LYP/CCPVTZ, B3LYP/CCPVQZ, B3P86/6-311G*, 30%/SBK, 30%/6-31G*, 30%/6-311G*, 30%/CCPVTZ, B3P86-30%/CCPVQZ, HF/6-311G*//MP2/6-311G*, HF/CCPVTZ//MP2/CCPVTZ, HF/CCPVQZ//MP2/CCPVQZ, MP2/6-311G*, MP2/CCPVTZ, MP2/CCPVQZ, MP3/6-311G*//MP2/6-311G*, MP3/CCPVTZ//MP2/CCPVTZ, MP3/CCPVQZ//MP2/CCPVQZ, MP4/6-311G*//MP2/6-311G*, MP4/CCPVTZ//MP2/ CCPVTZ, MP4/CCPVQZ//MP2/CCPVQZ, CCSD/6-311G*, CCSD/CCPVTZ, CCSD/CCPVQZ, CCSD(T)/6-311G*//CCSD/6-311G*, CCSD(T)/CCPVTZ// CCSD/CCPVTZ, and CCSD(T)/CCPVQZ//CCSD/CCPVQZ.
Figure 2. Theoretical and experimental gas phase IPs of thiophene through pentathiophene.
B3P83-30% shows that increasing the amount of HF exchange decreases the slope slightly. Similar plots with LSDA and BLYP (Figure 4) show that gradient correction shifts the curve down and HF exchange pushes it up, decreasing the slope slightly. Extrapolation to infinite chain length with second degree polynomial fits predicts the following IPs for gas phase poly-thiophene: experiment, 6.5 eV; CCSD, 6.3 eV; B3P86-30%, 6.2 eV; LSDA, 5.6 eV; B3LYP/CCSD, 5.7 eV; B3LYP, 5.3 eV; BLYP, 4.7 eV. The adiabatic IP (with optimized structures of the cations) at the B3LYP level extrapolates likewise to 5.3 eV. Thus CCSD is in good agreement with experiment, the B3P86-30% functional gets close to experiment thanks to error cancellation between too high IPs of short systems and exaggerated slope. B3LYP which is very accurate for short systems but suffers from large slopes and predicts polymer IPs that are about 1-1.2 eV too low.
Higher IPs of Thiophene, Furan, and Pyrrole Monomers. The entire valence photoelectron spectra of furan and pyrrole were measured by Palmer et al.38,40and for furan, pyrrole, and
thiophene by Holland et al.2The spectra are similar showing
binding energies in five major regions. ADC Green functions,2
Green functions,41 and CI38 calculations were used to assign
the bands to separate peaks. The agreement between ADC IPs and the spectra was found to be good.2In each spectrum six
peaks are dominated by single electron removal; the remaining features have reduced pole strengths and are accompanied by satellite peaks.
Scheme 1 in the method section illustrates how higher IPs are computed with the IP∆SCF/TDmethod by adding the
appropri-ate excitation energies (electronic transitions into the semioc-cupied orbital) of the cation to the ∆SCF IP. The character of the peaks, single or multiconfigurational, shows up in the CI
coefficients of the excited states. States that are formed with only one electron configuration and a CI coefficient close to 1.0 correspond to the single electron peaks of the ADC calculation. States with CI coefficients of the main transition between 0.95 and 0.80 have additional contributions from other electronic configurations and the main electron configuration contributes to other states. Such states have multiconfigurational character according to ADC although they appear to be more like one-electron excitations with TDDFT. Peaks with CI coefficients below 0.8 are multiconfigurational with both methods. After squaring the weight of the corresponding electronic configuration is only about 63% or less. B3LYP results for furan, pyrrole, and thiophene are summarized together with ADC and experimental data in Table 1-3. To cover the entire valence region, 400 excited states were calculated. For multiconfigurational states only the peak with the largest CI coefficients/highest pole strengths are shown. If no dominant peak can be identified, the energy range of the peaks is given. Theory and experiment are compared in Figures 5-7. Experi-Figure 3. Theoretical and experimental gas phase IPs of thiophene
through pentathiophene.
Figure 4. Theoretical and experimental gas phase IPs of thiophene through pentathiophene.
TABLE 1: IP∆SCF/TDIPs of Furan at the TDB3LYP/6-311G* Level and ADC Results Compared to Experiment in
Electronvoltsa
experiment2
TDB3LYP ADC2 peak range experiment42
1a2 8.84 8.85 (0.89) 9.0 8.4-9.6 8.9 2b1 10.46 (0.98) 10.31 (0.88) 10.4 10.0-11.0 10.3 9a1 12.85 (0.98) 13.38 (0.84) 12.7 12.3-13.3 12.7-13.1 8a1 13.50 (0.98) 14.00 (0.84) 13.8 13.3-14.6 6b2 13.91 (0.98) 14.35 (0.89) 13.8 1b1 14.75 (0.98) 15.64 (0.69) 14.6-16.0 5b2 15.38 (0.46) 15.32 (0.88) 15.4 7a1 17.31 (0.92) 18.07 (0.70) 17.0-18.4 17.38 6a1 17.92 (0.74) 18.70 (0.54) 17.8 4b2 19.09 (0.71) 19.58 (0.35) 18.9 18.4-20.9 3b2 23.34 (0.37) 23.52/23.80 (0.10) 23.2 20.9-26.1 5a1 25.04 (0.27) 24.82-27.00 (e0.07) 24.8 4a1 33.16 (0.71) 34.88-36.05 (e0.04) 33.7 31.6-36.4
aAll DFT values include the B3LYP/6-311G* ZPE correction of
-0.025 eV. Values in parentheses are the squares of the CI coef-ficients of the electronic transition from the orbital under consi-deration to 1a2 for TD calculations and pole strengths for ADC calculations. Only states with CI coefficients>0.5 and pole strengths >0.1 are included.
TABLE 2: IP∆SCF/TDIPs of Pyrrole at the TDB3LYP/ 6-311G* Level and ADC Results Compared to Experiment in Electronvoltsa
experiment2
TDB3LYP ADC2 peak range experiment40
1a2 7.84 8.05 (0.89) 8.4 7.8-8.8 8.21 2b1 8.87 (1.00) 8.95 (0.88) 9.4 8.8-9.8 9.20 9a1 12.38 (1.00) 13.11 (0.89) 12.9-13.5 12.6 6b2 12.75 (0.98) 13.52 (0.89) 12.8 13.0 1b1 12.75 (0.66) 14.26 (0.43) 13.7 14.86 (0.23) 5b2 13.70 (0.98) 14.53 (0.88) 14.5 13.5-15.8 14.35 8a1 13.87 (1.00) 14.82 (0.89) 14.8 7a1 16.82 (0.79) 17.63 (0.41) 16.7-19.8 17.3 4b2 17.47 (0.66) 18.56 (0.37) 18.0 6a1 18.17 (0.36) 19.48 (0.49) 18.3 18.8 3b2 21.37 (0.27) 23.81 (0.16) 22.4 20.8-25 5a1 23.09 (0.34) 24.28 (0.13) 24.0 4a1 28.94 (0.55) 30.56-32.56 (e0.05) 29.6 27.9-30.4
aAll DFT values include the B3LYP/6-311G* ZPE correction of
-0.033 eV. Values in parentheses are the squares of the CI coef-ficients of the electronic transition from the orbital under consi-deration to 1a2 for TD calculations and pole strengths for ADC calculations. Only states with CI coefficients>0.5 and pole strengths >0.1 are included.
mental data were read out of the original spectra in ref 2 and pyrrole and thiophene data are taken also from refs 38, 40, and 42.
In general there is a very good agreement between experiment, ADC, and IP∆SCF/TD. For furan and pyrrole the first two peaks are
well separated by 1.4 and 1.0 eV. For thiophene the experimental spectrum shows only one feature. ADC and IP∆SCF/TDreproduce
the furan and pyrrole peak spacing very accurately. For thiophene ADC predicts a smaller difference (0.2 eV) than IP∆SCF/TD(0.5 eV).
The peaks are assigned to the 1a2and 2(3)b1 π-orbitals (the
value in parentheses refers to thiophene). The next band is wide and has three peaks for furan and two for pyrrole and thiophene. Under these peaks are the cationic states arising from electron removal from five orbitals 9(11)a1, 8(10)a1, 6(7)b2, 1(2)b1,
5(6)b2. With increasing ionization energies ADC tends to predict
slightly higher values than IP∆SCF/TD. ADC predicts
multicon-figurational character for the state(s) arising from the lowest
π-orbital, 1(2)b1. TDB3LYP indicates the same trend but the
CI coefficients remain larger than 0.81. The next feature in the spectrum is a wide band with two peaks for furan and thiophene but only one for pyrrole. This band is due to the 7(9)a1, 6(8)a1,
and 4(5)b2orbitals. For all of these orbitals, the CI coefficients
of the main transition are reduced and each peak has satellite structures. The behavior is even more pronounced with ADC. The associated bands in the range between 16 and 21 eV show therefore multiple peaks that spread over several electronvolts. The next band starts at similar energies for all three systems ∼20.5 eV but spreads out further the more electronegative the heteroatom: 23.5 for thiophene, 25.0 eV for pyrrole, and 26.1 eV for furan. The band shows one peak for thiophene but two for furan and pyrrole. All of the states have reduced CI coefficients but a main peak can be identified with TDB3LYP. This is no longer possible with ADC. The last level is also partially multiconfigurational and its position depends strongly on the electronegativity of the heteroatom. The values are around 33 eV for furan, 29 eV for pyrrole, and 27 eV for thiophene. In general the spacing between the ADC peaks is slightly larger than that between the IP∆SCF/TDpeaks. This is most obvious for
the inner valence part. Comparison with experiment of the innermost peak positions shows that the ADC spectra tend to be out of the range of the highest IP band while IP∆SCF/TDagrees
with experiment down to 35 eV.
UPS of Longer Oligomers. Apart from the gas phase IPs of Jones et al.25 there are also gas phase IPs for tetrathiophene
through octithiophene26 and for furan through tetrafuran.27
However, only valence regions are available and the assignment of the peaks to individual states becomes more and more difficult because of band formation. In Figures 8 and 9 calculated and experimental peak positions according to deconvolution are compared for tetrafuran and octithiophene. Like for thiophene oligomers, B3LYP underestimates IPs of longer furans. This can be clearly seen in Figure 8. The difference between theory and experiment for tetrafuran amounts to 0.70 eV. For the second peak, theory and experiment agree, so that the difference between the two is predicted larger at TDB3LYP. In the region between 9 and 10.5 eV there are four states, two lie very close at TDB3LYP. It is not surprising that deconvolution of the experimental spectrum can not resolve the close lying states and yields only three peaks, all of them at slightly higher energy than theory predicts.
Since the underestimation of the first IP increases with increasing chain length, the first IPs of octithiophene are aligned in Figure 9 by shifting the theoretical first IP by 0.902 eV to higher energy. This shifts automatically all the other peaks by the same amount as they are obtained as IP1 plus the appropriate excitation energy. Figure 9 shows that such a linear shift aligns the major regions of theoretical and experimental spectra but does not produce a perfect match. IP2 and IP3 are now over-estimated. As for tetrafuran the first two IPs seem to lie closer
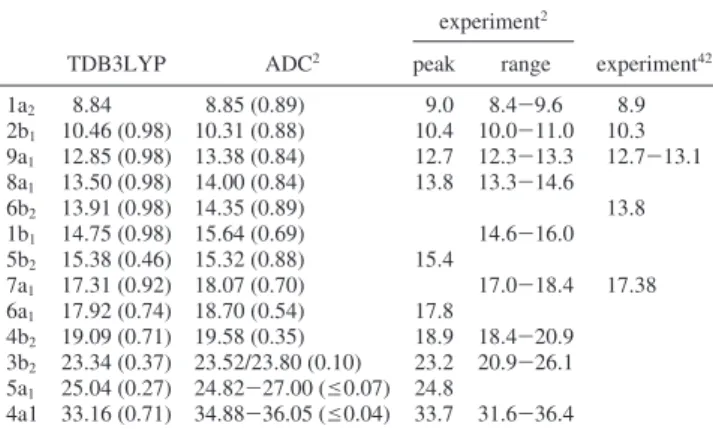
Figure 5. Comparison between experimental2IPs (red) and B3LYP/6-311G* IP
∆SCF/TD IPs (blue) of furan.
TABLE 3: IP∆SCF/TDIPs of Thiophene at the TDB3LYP/ 6-311G* Level and ADC Results Compared to Experiment in Electronvoltsa
experiment2
TDB3LYP ADC2 peak range experiment38
1a2 8.82 8.84 (0.88) 9.4 8.7-10.3 8.87 3b1 9.37 (0.98) 9.06 (0.89) 9.52 11a1 11.77 (1.00) 11.91 (0.88) 11.5-12.9 12.1 2b1 12.54 (0.83) 12.52 (0.57) 12.4 12.7 7b2 12.98 (0.98) 13.35 (0.89) 13.2 12.9-14.8 13.3 10a1 13.21 (1.00) 13.60 (0.89) 13.9 6b2 13.77 (0.98) 14.20 (0.88) 14.3 9a1 16.40 (0.90) 16.95 (0.70) 16.6 16.2-17.1 16.6 8a1 17.58 (0.52) 18.09 (0.39) 17.8 17.1-19.5 17.6 5b2 17.51/17.65 (0.24/0.24) 18.20 18.3 (0.27) 7a1 22.34 (0.49) 22.08 22.2 20.5-23.5 22.1 (0.12) 4b2 22.65 (0.26) 22.06-24.27 (e0.08) 22.3 6a1 27.03 (0.35) 26.32-28.95 (e0.06) 26.2 25.8-27.7
aAll DFT values include the B3LYP/6-311G* ZPE correction of
-0.059 eV. Values in parentheses are the squares of the CI coef-ficients of the electronic transition from the orbital under consi-deration to 1a2 for TD calculations and pole strengths for ADC calculations. Only states with CI coefficients>0.5 and pole strengths >0.1 are included.
in experiment than in theory. One should note, however, that there are only very broad and shallow bumps in the experimental spectrum which allows for some uncertainty in the experimental peak positions. A good agreement is reached in the energetic region between 8.4 and 9.8 eV although deconvolution can identify only 4 of the 15 major states predicted in this part of the spectrum.
Discussion
The aim of this investigation is to find out whether TDDFT calculations, which produce in principle UV spectra, can be employed to predict UP spectra as well. This idea is not new and was pursued by Shida et al.16These authors realized that
the nth IP of a neutral species relative to its first IP corresponds
to the (n - 1)th excited doubled state of the corresponding radical cation. Shida et al. compared UP and UV spectra experimentally and found a good match. It was concluded that comparison of UV and UP spectra can help detecting and assigning peaks that are either weak or out of the range with one of the two experimental techniques. In the context of conducting organic polymers, using UV peaks for predicting ionization potentials can be employed to construct band structures, avoiding the band gap problem,43-47and to investigate
the validity of the one-electron approximation.
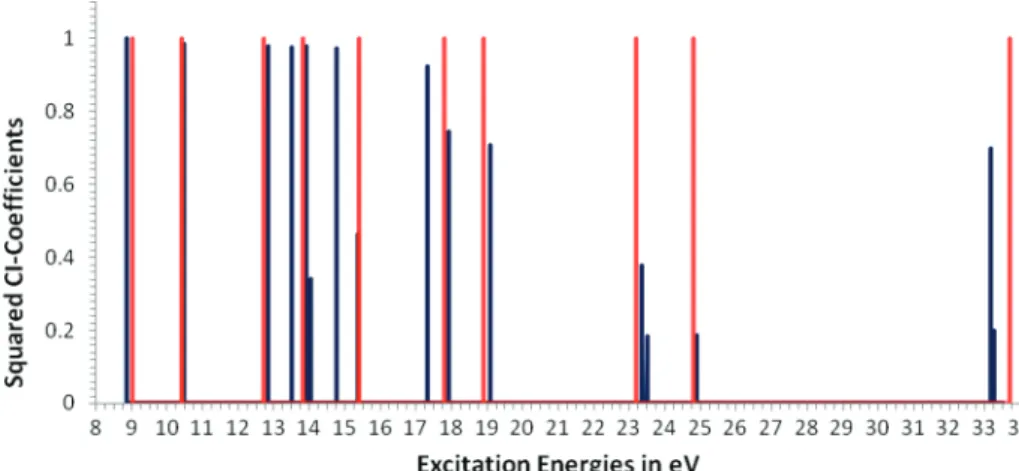
The near perfect match between predicted and experimental spectra of furan, pyrrole, and thiophene monomers proves that TDDFT is indeed capable of predicting UP spectra down to the inner valence region at binding energies of 35 eV. The Figure 6. Comparison between experimental2,40IPs (red) and B3LYP/6-311G* IP
∆SCF/TD IPs (blue) of pyrrole.
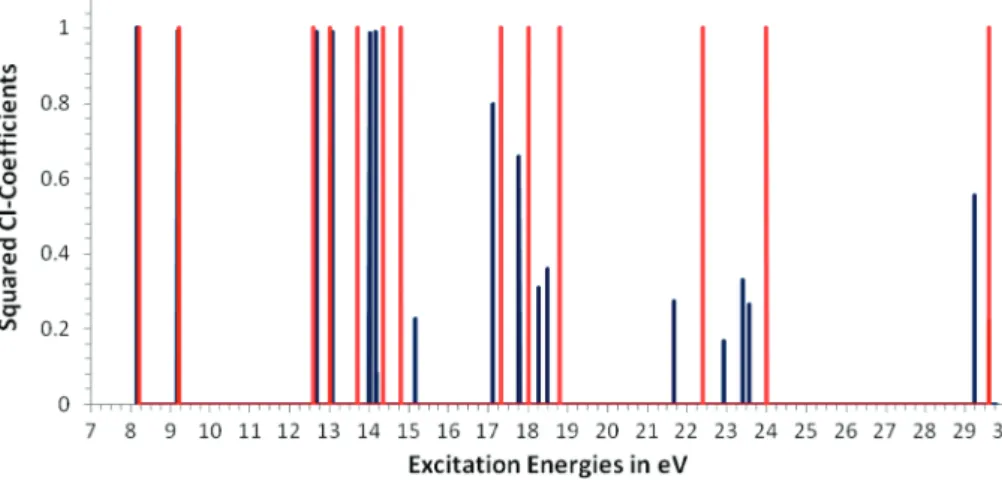
Figure 7. Comparison between experimental2,38IPs (red) and B3LYP/6-311G* IP
∆SCF/TD IPs (blue) of thiophene.
Figure 8. Comparison between experimental27IPs (red) and B3LYP/6-311G* IP
spectra (Figures 5-9) created with the IP∆SCF/TD method
according to Scheme 1 contain essentially as many peaks as there are occupied orbitals in the neutral form. Most of the peaks are single-configurational, which means that the electron removal obeys the one-electron approximation. This holds with increasing chain length as shown for octithiophene (Figure 9) by CI coefficients of close to unity.
Theory thus completely confirms the idea of Shida et al.16
Problems arise, however, when experimental spectra are used because of the different selection rules for UP and UV spectroscopy. As a result UV spectra contain peaks that do not correspond to energy differences between IPs and excited states that are needed to predict UP spectra may have zero oscillator strength in the UV spectra. TDDFT calculations predict for instance additional peaks that are not associated
with excitations of β-electrons into the SOMO. Such peaks are ignored in Figures 10 and 11. The most prominent of those is the main peak of radical cation UV spectra that arises from the SOMO f LUMO transition of an R-electron.48The
question therefore arises whether such excitations can occur during electron removal and produce peaks in UP spectra. For thiophene the SOMO f LUMO transition is excited state number 5 with excitation energy of 4.31 eV. Added to the IP, a photoelectron peak would occur at 13.1 eV. This is the region of a broad band where resolution is difficult and the number of peaks is uncertain. Unfortunately, at all chain lengths the excitation energy to this state lies within these broad bands or entirely outside the region that can be analyzed with certainty experimentally. Comparison with ADC results does not indicate missing peaks in the IP∆SCF/TDspectra and Figure 9. Comparison between experimental26IPs (red) and B3LYP/6-311G* IP
∆SCF/TD IPs (blue) of octithiophene. The theoretical spectrum is shifted to align the first ionization potential with experiment.
Figure 10. All IP∆SCF/TD peaks (dark blue) for thiophene that include a contribution from a HOMO-x f SOMO transition with absolute values of CI coefficients above 0.01 compared all ADC peaks (light green) with pole strengths above 0.01.
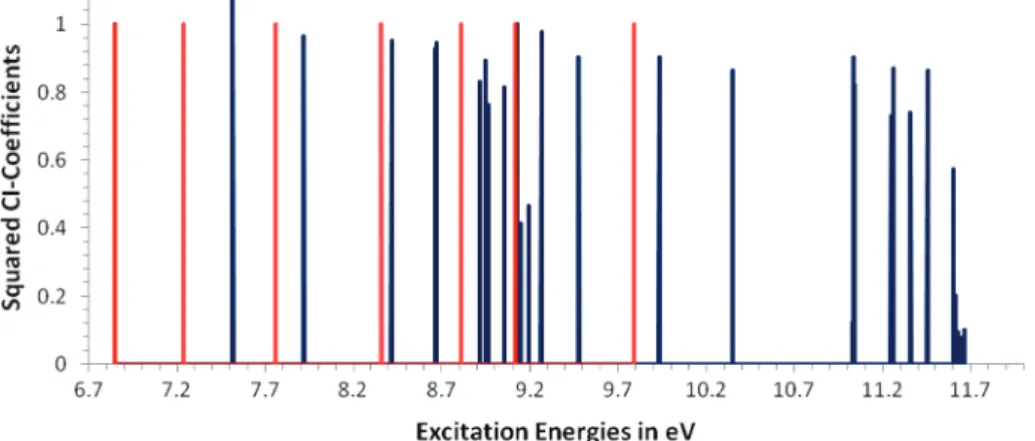
Figure 11. All IP∆SCF/TD peaks (dark blue) for thiophene that include a contribution from a HOMO-x f SOMO transition with squared CI coefficients above 0.01 compared to ADC peaks (light green) with pole strengths above 0.01. Only states with〈S2〉 values below 1.5 are included.
it seems therefore reasonable to ignore states that are not associated with transitions of β-electrons into the SOMO.
Apart from states that are not associated with HOMO-x f SOMO transitions, there are peaks that contain only a very minor component due to HOMO-x f SOMO. Such states are multiconfigurational with CI coefficients of the HOMO-x f SOMO transition below 0.50. These states appear to be the analogues of the satellites of ADC calculations as satellites are known to be associated with excited states.41Trofimov et al.
recommended treading these states with caution and the same will be done here. Nonetheless, a comparison of the ADC satellites with the additional IP∆SCF/TDpeaks seems worthwhile.
Three such peaks involving the 2b1, the 5b2, and the 8a1orbitals
of thiophene are discussed in more detail to serve as examples. All states to which these orbitals contribute are summarized in Table 4. The 2b1orbital is the lowest π-orbital of thiophene.
This orbital has at tendency to be multiconfigurational for thiophene, pyrrole, and furan and for their longer oligomers. The CI coefficient of the corresponding electron transition (4β f 1β in thiophene) is 0.94. For the numbering refer to Scheme 1 and ref 49. The 4β f 1β electron transition contributes also to excited states 8 and 11 but only to a small extent. Here one would clearly say that the correct state corresponding to the 1b1 orbital is excited state number 3. The situation becomes
less clear for the 8a1orbital. The relevant electron configuration,
10β f 1β, can be found in seven states. The 10β f 1β transition has a CI coefficient of 0.72 in excited state number 27 and of -0.49 in state 32. This means that excited state number 27 arises to about 52%, excited state number 32 to 24% from 10β f 1β. In both states there are several other significant contributions involving also excitations of R-electrons. Furthermore 10β f 1β contributes to a minor extent to excited states 21, 31, 34, 42, and 47. Despite the multiconfigurational character of state 27, experimental data in Table 1 show that there is an excellent match between the predicted and the measured peak position. For 5b2 finally there is no excited state for which 9β f 1β
would be the dominant contribution and this electronic transition contributes to six excited states. The question is thus whether any of these states can be seen in a UP spectrum. The energy range of the peaks associated with 5b2fall in the same region
as those associated with 8a1. The relevant regions in the
experimental spectrum are very broad, have low intensity, and cannot be resolved into individual peaks. The overall appearance of the peaks is therefore in agreement with electronic states that arise from various contributions.
In Figure 10 all excited states involving HOMO-x f SOMO transitions with squared CI coefficients above 0.01 are plotted and compared to ADC peaks with pole strength above 0.01. There is a very good agreement between the nature of peaks from ADC and TDDFT calculations. Whenever the pole strength goes down, the CI coefficient is reduced. All peaks with low pole strengths and with small CI coefficients are surrounded by satellites. The peaks that have satellite structures are very wide and of low intensity in experiment. The difference is that TDDFT states seem to be closer to the one-particle picture than the ADC ones, especially in the inner valence region of the spectrum. It is also visible that ADC predicts the inner valence level at slightly higher binding energy than IP∆SCF/TD. Data in
Table 2 show that IP∆SCF/TDenergies are closer to experiment.
Ipatov et al.24 have warned that TDDFT calculations of
radicals can produce nonsensical results and recommended to investigate the spin state of the excited states to identify spurious states. The peaks of all systems investigated here that arise from mainly one HOMO-x f SOMO transition have expectation
values of the spin operator of below 0.9. Most of them are close to 0.78. These states are therefore sound and reliable. Some of the multiconfigurational states have expectation values of larger
TABLE 4: Excited States That Involve the 2b1, 5b2, and 8a1 Orbitals of Thiophene
orbital excited state no. energy (eV) transitions CI coefficient
2b1 3 3.72 2R f 1′R -0.47 1R f 3′R 0.18 4β f 1β 0.94 8 5.48 2R f 1′R 0.79 1R f 3′R 0.49 4β f 1β 0.23 4β f 3′β 0.18 2′β f 3′β -0.24 11 6.48 5R f 3′R -0.10 2R f 1′R -0.37 1R f 3′R 0.65 4β f 1β -0.21 2β f 3′β -0.62 5b2 14 7.29 3R f 1′R 0.11 2R f 2′R 0.98 9β f 1β 0.12 23 8.39 6R f 1′R 0.86 1R f 4′R 0.16 9β f 1β -0.38 24 8.61 6R f 1′R 0.31 1R f 4′R -0.20 1R f 5′R 0.56 9β f 1β 0.42 2β f 4′β 0.52 2β f 5′β -0.29 25 8.64 1R f 4′R 0.71 1R f 5′R -0.17 9β f 1β 0.32 3β f 1′β -0.14 2β f 4′β 0.38 2β f 5′β 0.41 26 8.68 6R f 1′R -0.23 1R f 4′R 0.14 1R f 5′R -0.24 9β f 1β -0.49 2β f 4′β 0.62 2β f 5′β -0.47 28 8.83 6R f 1′R -0.25 1R f 5′R 0.64 9β f 1β -0.48 2β f 4′β 0.12 2β f 5′β 0.48 8a1 21 8.08 4R f 1′R 0.93 3R f 3′R 0.18 10β f 1β -0.12 27 8.76 7R f 1′R 0.26 6R f 3′R 0.10 4R f 1′R 0.16 2R f 4′R -0.45 10β f 1β 0.72 7β f 1′β -0.17 5β f 1′β 0.34 31 9.21 7R f 1′R -0.41 6R f 3′R -0.12 4R f 1′R -0.16 3R f 3′R 0.78 2R f 4′R 0.19 2R f 5′R 0.17 10β f 1β 0.29 5β f 1′β -0.12 3β f 3′β -0.10 32 9.28 7R f 1′R 0.19 6R f 3′R -0.10 3R f 3′R 0.47 3R f 4′R -0.24 3R f 5′R -0.21 10β f 1β -0.49 5β f 1′β 0.59 3β f 3′β 0.11 34 9.41 2R f 4′R -0.42 2R f 5′R 0.86 1R f 6′R 0.12 10β f 1β -0.21 42 10.05 7R f 1′R 0.13 10β f 1β 0.20 8β f 1′β 0.11 7β f 1′β 0.90 4β f 2′β 0.13 3β f 3′β -0.26 47 10.31 6R f 4′R 0.35 1R f 8′R -0.60 10β f 1β -0.12 6β f 3′β -0.10 2β f 8′β 0.65
than 2. For this reason Figure 11 shows the same spectrum as Figure 10 after all peaks with expectation values of the spin operator above 1.5 have been removed. Removing states with values above 1.0 would lead to the loss of major features that are present in ADC calculations and in experiment. Thus states with expectation values of the spin operator of around 1.3 seem to be real.
To produce the UP spectra, the oscillator strengths of the TDDFT calculations are replaced with squared CI coefficients of the main electron configuration in each relevant excited state (compare Scheme 1). Squared CI coefficients of the electronic configurations are roughly related with pole strengths of Green function calculations and were taken as peak heights because single electron peaks are expected to have higher probability than peaks that arise from complicated excitation and relaxation processes. Therefore, many peaks that have high oscillator strength in the UV spectra are absent in the UP spectra and vice versa. Especially several states that correspond to low IPs have high probability in UP but no oscillator strengths in UV spectra. Little resemblance remains therefore between the original UV and the resulting UP spectra. As example UP and UV spectra of thiophene extracted from the same TDDFT calculation are shown in Figure 12. The spectra are aligned so that excitation energies and corresponding differences between IPs appear at the same energy. The five-band picture in the UP spectrum found experimentally emerges only when CI coef-ficients are used to replace oscillator strengths and is not visible in the original UV spectrum. All low-energy IPs correspond to electronic transitions that are invisible in the UV spectrum. The necessary manipulations to extract the relevant peaks can only be done with theoretical data. It seems unlikely that comparison of experimental UP and UV spectra as done by Shida et al. can produce more than a very rough agreement.16
Longer Oligomers. The agreement between theory and experiment deteriorates for longer oligomers because of the problems with the first IP. As the ∆SCF method (Figures 2-4) does not involve any excited state calculations, the deterioration of results for longer oligomers is not caused by the TDDFT calculations. Figure 2 shows that even coupled cluster calcula-tions have some difficulties with predicting the decrease in the IPs versus chain lengths. In the case of CCSD, the geometry is crucial as the potential energy surface of the neutral forms is very flat with respect to changes in bond length alternation. It seems that this would lead to low-energy vibrations, which should be at least partially responsible for the very broad peak widths in the UPS.
Independently of the geometry, all DFT functionals predict an additional spurious contribution to the decrease of IP versus chain lengths. As a result B3LYP predicts ∆SCF IPs about 1.2
eV too small in the long chain length limit. This affects consequently the higher IPs of the longer oligomers. A practical work around could be to employ the P86 correlation functional for longer oligomers because it produces better IPs for medium size oligomers and polymers. The method is not very satisfac-tory, however, as it is clearly based on fortuitous error can-cellation.
When DFT fails, usually the incomplete cancellation of self-repulsion is assumed to be the reason. It seems unlikely that this argument holds in this case because self-repulsion decreases with increasing delocalization of the relevant MO.15Therefore
the self-repulsion error should decrease and not increase with increasing chain length. This issue will be addressed in more detail in a forthcoming paper investigating the validity of the one-electron approximation for predicting UP spectra.
To avoid the problem introduced by the incorrect first IP, it is worthwhile to explore the accuracy of the relative peak positions predicted with TDDFT. Figures 8 and 9 show that relative peak energies are quite accurate. Only the difference between peaks 1 and 2 is larger with TDDFT than in the UP spectra. Since the peaks are very wide, for octithiophene26there
is almost a continuum, deconvolution might be not very accurate. Following the spirit of Shida et al., UV spectra are used to get a better idea about the actual peak separation. Since UV spectra involve relaxed cation geometries and UP spectra are obtained at the geometry of the neutral form, the influence of the geometry was checked with sexithiophene. The first excitation energies differ by 0.1 eV; the lower value corresponds to the optimized geometry and therefore to the UV spectrum. Thus the peak separation in UP spectra should be equal or slightly larger than in the UV spectra.
UV spectra of oligothiophene radicals in solution were investigated by Fichou et al.50 The first exited state, which
corresponds to the peak separation between IP1 and IP2 in the UP spectrum, is found at 1.16 eV for the tetrathiophene cation and at 0.84 eV for the sexithiophene cation. Van Haare et al.51
determined the first excited state at 0.67 eV and at about 0.6 eV for the nonithiophene and duodecithiophene cations. Thus the experimental value of 0.4 eV for the octithiophene cation derived by deconvoluting the UP spectrum appears to be too small and the TDB3LYP peak spacings of 1.24 and 0.67 eV for the tetrathiophene and octithiophene cations seem to be accurate. This means that if the problem with the ∆SCF IPs can be solved, the IP∆SCF/TDshould be able to predict UP spectra
for conjugated oligomers of all chain lengths. Conclusions
Following the idea of Shida et al.16that there should be a
correspondence of UP spectra of neutral systems and UV spectra Figure 12. UV (red) and UP (blue) spectra of thiophene extracted from the same TDDFT calculation. The spectra are aligned so that excitation energies and corresponding differences between IPs appear at the same energy.
of their cations, TDDFT calculations were carried out and UP spectra were modeled by adding the appropriate excitation energies to the ∆SCF IPs. Very good agreement between experiment and theory was achieved for small systems. The IP∆SCF/TDresults also agree very favorably with ADC
calcula-tions. This proves that TDDFT is capable of producing accurate excited states for the radical cations of conjugated π-systems and that the vertical excited states correspond to both UVS and UPS.
For longer oligomers ∆SCF IPs fall off too fast with increasing chain length compared to experimental gas phase data. The error amounts to about 1.2 eV at infinite chain length at the B3LYP/6-311G* level. Because self-interaction should decrease with increasingly delocalized orbitals, self-interaction is probably not the reason for this DFT problem. The peak separations are predicted accurately with TDDFT calculations. Thus the IP∆SCF/TD works without adjustments also for long
oligomers if the problem with ∆SCF IPs can be solved. Most of the states of the cations produced by electron removal are simple one-electron states with CI coefficients close to 1. This is true for short and for long oligomers. States that are multiconfigurational in the small cations form multiconfigura-tional bands for long oligomers. Multiconfiguramulticonfigura-tional peaks and their satellites give rise to broad bands with low intensity of the individual peaks. Which of the multiconfigurational states predicted by TDDFT can be seen in UP spectra is hard to assess from comparison between theory and experiment because the relevant spectral ranges are extremely crowded and poorly resolved. Comparison between TDDFT and ADC shows that the two different methods mutually confirm each other at least qualitatively. The overall expected peak shapes are in good agreement with experimental observations.
Acknowledgment. The author thanks Professor Roi Baer for helpful discussions and Fahri Alkan for making test calculations at the B3P86-30%/SBK level. This work was supported by TU¨ BITAK (TBAG-109T426), by EU Seventh Framework Programme Project Unam-Regpot Grant No. 203953, and by Bilkent University.
Supporting Information Available: Table of first vertical ionization potential of thiophene at various theoretical levels. This information is available free of charge via the Internet at http://pubs.acs.org.
References and Notes
(1) Salaneck, W. R. Photoelectron Spectroscopy of Electrically Con-ducting Organic Polymers. In Handbook of ConCon-ducting Polymers; Skotheim, T. A., Ed.; Dekker: New York, 1986; Vol. 2, p 1337.
(2) Holland, D. M. P.; Karlsson, L.; von Niessen, W. J. Electron
Spectrosc. Relat. Phenom. 2001, 113, 221.
(3) Fincher, C. R., Jr.; Ozaki, M.; Heeger, A. J.; MacDiarmid, A. G.
Phys. ReV. B 1979, 19, 4140.
(4) Fesser, K.; Bishop, A. R.; Campbell, D. K. Phys. ReV. B 1983, 27, 4804.
(5) Lazzaroni, R.; Logdlund, M.; Stafstrom, S.; Salaneck, W. R.; Bredas, J. L. J. Chem. Phys. 1990, 93, 4433.
(6) Dannetun, P.; Logdlund, M.; Spangler, C. W.; Bredas, J. L.; Salaneck, W. R. J. Phys. Chem. 1994, 98, 2853.
(7) Iucci, G.; Xing, K.; Lo¨gdlund, M.; Fahlman, M.; Salaneck, W. R.
Chem. Phys. Lett. 1995, 244, 139.
(8) Fahlman, M.; Lo¨gdlund, M.; Stafstro¨m, S.; Salaneck, W. R.; Friend, R. H.; Burn, P. L.; Holmes, A. B.; Kaeriyama, K.; Sonoda, Y.; Lhost, O.; Meyers, F.; Bre´das, J. L. Macromolecules 1995, 28, 1959.
(9) Dannetun, P.; Logdlund, M.; Fredriksson, C.; Lazzaroni, R.; Fauquet, C.; Stafstrom, S.; Spangler, C. W.; Bredas, J. L.; Salaneck, W. R.
J. Chem. Phys. 1994, 100, 6765.
(10) Koopmans, T. A. Physica 1934, 1, 104.
(11) Parr, P. G.; Yang, W. Density-Functional Theory of Atoms and
Molecules; Oxford University Press: New York, 1989.
(12) Chong, D. P.; Gritsenko, O. V.; Baerends, E. J. J. Chem. Phys. 2002, 116, 1760.
(13) Salzner, U.; Baer, R. J. Chem. Phys. 2009, 131, 231101. (14) Bre´das, J. L.; Chance, R. R.; Silbey, R.; Nicolas, G.; Durand, P.
J. Chem. Phys. 1982, 77, 371.
(15) Ko¨rzdo¨rfer, T.; Ku¨mmel, S.; Marom, N.; Kronik, L. Phys. ReV. B 2009, 79, 201205.
(16) Shida, T.; Nosaka, Y.; Kato, T. J. Phys. Chem. A 1978, 82, 695. (17) Runge, R.; Gross, E. K. U. Phys. ReV. Lett. 1984, 52, 997. (18) Bauernschmitt, R.; Ahlrichs, R. Chem. Phys. Lett. 1996, 256, 454. (19) Casida, M. E.; Jamorski, C.; Casida, K. C.; Salahub, D. R. J. Chem.
Phys. 1998, 108, 4439.
(20) Foresman, J. B.; Head-Gordon, M.; Pople, J. A.; Frisch, M. J. Phys.
Chem. 1992, 96, 135.
(21) Olsen, J.; Jorgensen, P. J. Chem. Phys. 1985, 82, 3235. (22) Luo, Y.; Ågren, H.; Stafstro¨m, S. J. Phys. Chem. 1994, 98, 7782. (23) Cai, Z.-L.; Sendt, K.; Reimers, J. R. J. Chem. Phys. 2002, 117, 5543.
(24) Ipatov, A.; Cordova, F.; Doriol, L. J.; Casida, M. E. J. Mol. Struct.
(THEOCHEM) 2009, 914, 60.
(25) Jones, D.; Guerra, M.; Favaretto, L.; Modelli, A.; Fabrizio, M.; Distefano, G. J. Phys. Chem. 1990, 94, 5761.
(26) da Silva Filho, D. A.; Coropceanu, V.; Fichou, D.; Gruhn, N. E.; Bill, T. G.; Gierschner, J.; Cornil, J.; Bredas, J.-L. Philos. Trans. R. Soc.
London, A 2007, 365, 1435.
(27) Distefano, G.; Jones, D.; Guerra, M.; Favaretto, L.; Modelli, A.; Mengoli, G. J. Phys. Chem. 1991, 95, 9746.
(28) Stevens, W. J.; Basch, H.; Krauss, M. J. Chem. Phys. 1984, 81, 6026.
(29) Hehre, W. J.; Ditchfield, R.; Pople, J. A. J. Chem. Phys. 1972, 56, 2257.
(30) McLean, A. D.; Chandler, G. S. J. Chem. Phys. 1980, 94, 511. (31) Raghavachari, K.; Binkley, J. S.; Seeger, R.; Pople, J. A. J. Chem.
Phys. 1980, 72, 650.
(32) Dunning, J. T. H. J. Chem. Phys. 1989, 90, 1007.
(33) Frisch, M. J.; Trucks, G. W.; Schlegel, H. B.; Scuseria, G. E.; Robb, M. A.; Cheeseman, J. R.; Montgomery, J. A., Jr.; Vreven, T.; Kudin, K. N.; Burant, J. C.; Millam, J. M.; Iyengar, S. S.; Tomasi, J.; Barone, V.; Mennucci, B.; Cossi, M.; Scalmani, G.; Rega, N.; Petersson, G. A.; Nakatsuji, H.; Hada, M.; Ehara, M.; Toyota, K.; Fukuda, R.; Hasegawa, J.; Ishida, M.; Nakajima, T.; Honda, Y.; Kitao, O.; Nakai, H.; Klene, M.; Li, X.; Knox, J. E.; Hratchian, H. P.; Cross, J. B.; Bakken, V.; Adamo, C.; Jaramillo, J.; Gomperts, R.; Stratmann, R. E.; Yazyev, O.; Austin, A. J.; Cammi, R.; Pomelli, C.; Ochterski, J. W.; Ayala, P. Y.; Morokuma, K.; Voth, G. A.; Salvador, P.; Dannenberg, J. J.; Zakrzewski, V. G.; Dapprich, S.; Daniels, A. D.; Strain, M. C.; Farkas, O.; Malick, D. K.; Rabuck, A. D.; Raghavachari, K.; Foresman, J. B.; Ortiz, J. V.; Cui, Q.; Baboul, A. G.; Clifford, S.; Cioslowski, J.; Stefanov, B. B.; Liu, G.; Liashenko, A.; Piskorz, P.; Komaromi, I.; Martin, R. L.; Fox, D. J.; Keith, T.; Al-Laham, M. A.; Peng, C. Y.; Nanayakkara, A.; Challacombe, M.; Gill, P. M. W.; Johnson, B.; Chen, W.; Wong, M. W.; Gonzales, C.; Pople, J. A. Gaussian 03,
ReVision D.01; Gaussian, Inc. Wallingford, CT, 2004.
(34) Frisch, M. J.; Trucks, G. W.; Schlegel, H. B.; Scuseria, G. E.; Robb, M. A.; Cheeseman, J. R.; Scalmani, G.; Barone, V.; Mennucci, B.; Petersson, G. A.; Nakatsuji, H.; Caricato, M.; Hratchian, H. P.; Izmaylov, A. F.; Bloino, J.; Zheng, G.; Sonneberg, J. L.; Hada, M.; Ehara, M.; Toyota, K.; Fukuda, R.; Hasegawa, J.; Ishida, M.; Nakajima, T.; Honda, Y.; Kitao, O.; Nakai, H.; Vreven, T.; Montgomery, J. A., Jr.; Peralta, J. E.; Ogliaro, F.; Bearpark, M.; Heyd, J. J.; Brothers, E.; Kudin, K. N.; Staroverov, V. N.; Kobayashi, R.; Normand, J.; Raghavachari, K.; Rendell, A.; Burant, J. C.; Iyengar, S. S.; Tomasi, J.; Cossi, M.; Rega, N.; Millam, J. M.; Klene, M.; Knox, J. E.; Cross, J. B.; Bakken, V.; Adamo, C.; Jaramillo, J.; Gomperts, R.; Stratmann, R. E.; Yazyev, O.; Austin, A. J.; Cammi, R.; Pomelli, C.; Ochterski, J. W.; Martin, R. L.; Morokuma, K.; Zakrzewski, V. G.; Voth, G. A.; Salvador, P.; Dannenberg, J. J.; Dapprich, S.; Daniels, A. D.; Farkas, O.; Foresman, J. B.; Ortiz, J. V.; Cioslowski, J.; Fox, D. J. Gaussian 09,
ReVision A.1; Gaussian, Inc. Wallingford, CT, 2009.
(35) Frisch, Æ.; Frisch, M. J.; Clemente, F. R.; Trucks, G. W. Gaussian
09 User’s Reference; Gaussian, Inc.: Wallingford, CT, 2009.
(36) Salzner, U. J. Phys. Chem. A 2010, 114, 5397.
(37) Gidron, O.; Diskin-Posner, Y.; Bendikov, M. J. Am. Chem. Soc. 2010, 132, 2148.
(38) Palmer, M. H.; Walker, I. C.; Guest, M. F. Chem. Phys. 1999, 241, 275.
(39) Alema´n, C.; Julia, L. J. Phys. Chem. 1996, 100, 1524.
(40) Palmer, M. H.; Walker, I. C.; Guest, M. F. Chem. Phys. 1998, 238, 179.
(41) Trofimov, A. B.; Schirmer, J.; Holland, D. M. P.; Karlsson, L.; Maripuu, R.; Siegbahn, K.; Potts, A. W. Chem. Phys. 2001, 263, 167.
(42) Rennie, E. E.; Johnson, C. A. F.; Parker, J. E.; Holland, D. M. P.; Shaw, D. A.; MacDonald, M. A.; Hayes, M. A.; Shpinkova, L. G. Chem.
Phys. 1998, 236, 365.
(44) Sham, L. J.; Schlu¨ter, M. Phys. ReV. Lett. 1983, 51, 1888. (45) Williams, A. R.; von Barth, U. Applications of Density Functional Theory to Atoms, Molecules, and Solids. In Theory of the Inhomogeneous
Electron Gas; Lundqvist, S., March, N. H., Eds.; Plenum Press: London,
1983.
(46) Godby, R. W.; Schlu¨ter, M.; Sham, L. J. Phys. ReV. B 1988, 37, 10159.
(47) Fritsche, L. Physica B 1991, 172, 7.
(48) Salzner, U. J. Chem. Theor. Comput. 2007, 3, 1143. (49) Salzner, U. J. Phys. Chem. A 2008, 112, 5458.
(50) Fichou, D.; Horowitz, G.; Xu, B.; Garnier, F. Synth. Met. 1990,
39, 243.
(51) van Haare, J. A. E. H.; Havinga, E. E.; van Dongen, J. L. J.; Janssen, R. A. J.; Cornil, J.; Bre´das, J. L. Chem.sEur. J. 1998, 4, 1509. JP105588N