i
MICRO AND NANOTEXTURED POLYMER FIBERS
FOR OPEN MICROFLUIDICS
A THESIS SUBMITTED TO
THE GRADUATE SCHOOL OF ENGINEERING AND SCIENCE OF BILKENT UNIVERSITY
IN PARTIAL FULFILLMENT OF THE REQUIREMENTS FOR THE DEGREE OF
MASTER OF SCIENCE IN
MATERIALS SCIENCE AND NANOTECHNOLOGY
By
Muhammad Yunusa
January, 2016
ii
MICRO AND NANOTEXTURED POLYMER FIBERS
FOR OPEN MICROFLUIDICS
By Muhammad Yunusa January, 2016
We certify that we have read this thesis and that in our opinion it is fully adequate, in scope and in quality, as a dissertation for the degree of Master of Science.
Mehmet Bayındır (Advisor)
Çağlar Elbüken
Hatice Duran
Approved for the Graduate School of Engineering and Science:
Levent Onural
iii
ABSTRACT
MICRO AND NANOTEXTURED POLYMER FIBERS FOR OPEN
MICROFLUIDICS
Muhammad Yunusa
M.S. in Materials Science and Nanotechnology Supervisor: Mehmet Bayındır
January, 2016
Microfluidics is the science of controlling low volumes of fluids in a microchannel. It is used in diverse area of applications such as chemical and biological analysis. Benefits of microfluidics are fast analysis, short reaction times, and portability of device. Current fabrication techniques of lab-on-a-chip microfluidic devices are soft lithography and micromachining. However, these methods suffer from design limitations such as flexibility of product, high cost, integration of external components, and biocompatibility.
Surface textured polymer fibers are utilized as a novel platform for the fabrication of affordable microfluidic devices. Fibers are produced by thermal drawing technique tens of meters-long at a time and comprise twenty continuous and ordered V-grooves channels on their surfaces. Extreme anisotropic wetting behavior due to capillary action along the grooves of fibers is observed after surface modifications with polydopamine (PDA) coating and Ultraviolet/Ozone (UV/O) treatment. Three-dimensional arrays of flexible fibers spontaneously spread liquid on predefined paths without the need of external pumps or actuators. In addition, surface modification with organically modified silica nanoparticles was added on top of the V-grooves to enhance the hydrophobicity of the fiber surfaces. Surface textured fibers are well suited for the fabrication of flexible, robust, lightweight and affordable microfluidic devices which is believed to expand the role of microfluidics in a scope of fields including drug discovery, medical diagnostics and monitoring food and water quality.
iv
Keywords: Microfluidics, Anisotropic wetting, Polymer fiber drawing, Capillary flow,
v
ÖZET
MİKRO VE NANOYAPILI FİBER TABANLI AÇIK
MİKROAKIŞKANLAR
Muhammad Yunusa
Malzeme Bilimi ve Nanoteknoloji Yüksek Lisans Tezi Danışman: Mehmet Bayındır
Ocak, 2016
Mikroakışkanlar, çok küçük hacimlere sahip sıvıları, mikrometrelik kanallarda kontrol etme bilimidir. Mikroakışkanlar, kısa tepkime süresi ile çabuk analiz edilebilme ve taşınabilir özellikleriyle başlıca kimyasal ve biyolojik analizler olmak üzere daha birçok alanda teknolojik olarak uygulama bulmaktadır. Günümüzde mikroakiskan temelli cihazlar, litografi ve mikro-imalat gibi yöntemler ile cip üstü laboratuvar aygıtları olarak üretilmektedir. Ancak söz konusu üretim teknikleri, esneklik, biyolojik uyum, harici bileşenlerle bütünleşme ve üretim maliyetleri gibi yüksek önem arz eden konularda kısıtlamalara sahiptirler.
Bu çalışmada, yüzeyi şekillendirilmiş polimer fiberler, ekonomik açıdan uygun mikroakışkan cihazların üretimi için yeni bir platform olarak sunulmuştur. Isıl fiber çekme metodu kullanılarak üretilen onlarca metre uzunluğundaki fiberler, yüzeylerinde ‘V’ şeklinde yivlerden oluşan yirmi kanal içermektedir. Fiber yüzeylerinin polidopamin (PDA) ve Ultraviyole/Ozon (UV/O) gibi işleme tekniklerle modifiye edilmesinden sonra fiberlerin üstündeki yivler boyunca kılcal hareketten kaynaklanan yayılma yönüne bağlı olarak sıvı akışkanlığı gözlemlenmiştir. Üç boyutlu esnek fiberlerden oluşan diziler üzerinde, herhangi bir harici pompa veya hareketlendirici mekanizma olmaksızın önceden belirlenmiş kanallarda kendiliğinden
vi
sıvı aktarımı sağlanabilmektedir. Ayrıca, yüzeyi organik olarak modifiye edilmiş nano parçacıklar V yapılı yivlerin üzerinde kullanılarak fiber yüzeylerin hidrofobikliği arttırılmıştır. Yüzeyleri şekillendirilmiş fiberlerin, esnek, sağlam, hafif ve ekonomik mikrodamlacık tabanlı aygıtların üretimi için oldukça uygun olduğuna ve mikroakışkan aygıtların kullanım alanlarını yeni ilaç keşifleri, tıbbi tanılama, yiyecek ve su kaynaklarının kalitesinin denetlenmesini de kapsayacak şekilde genişleteceğine inanılmaktadır.
Anahtar Kelimeler: Mikroakışkanlar, Yöne bağlı ıslanma, Polimer fiber çekme, Kılcal
vii
Acknowledgement
First and I would like to thank my academic advisor, Prof. Mehmet Bayındır for his invaluable support and guidance throughout my thesis. He has given me the necessary advice and motivation during the course of my study. I believe his enthusiastic approach to research has myriad contributions to my perspective in science.
I would like to thank Adem Yildirim for all the support he has provided me through this journey. In fact he was not only a friend and teammate to me, but also a role model. I would like to thank my friends and teammates; Fahri Emre Öztürk, Urandelger Tuvshindorj, Mehmet Kanık, and Merve Marçali. I had a wonderful time working with them. I am grateful to prof. Çaglar Elbüken for his suggestions and invaluable comments that helped improved the quality of my thesis.
I want to express my sincere gratitude to my friends who helped steer the wheel with me all the time and reach out to me whenever I need their assistance. In particular I am grateful to Mustafa Fadlelmula, Abubakar Isa Adamu, Faruk Okur, Abba Usman Saleh, Umar Musa Gishiwa, Girayhan M. Say, Oyewole Benjamin Efunbajo, Bekir Türedi, Ahmet F. Yavuz, Tamer Doğan, and Kivanç Çoban.
I have good time and enjoyed sharing ideas with Bayindir research group members. They were the reason I felt comfortable to conduct my research in a conducive environment. I want to thank Tural Khudiyev, Ozan Aktaş, Erol Özgür, Gökcen Birlik Demirel, Ersin Hüseyinoğlu, Bihter Dağlar, Pınar Beyazkılıç, Osama Tobail, Mostafa El-Ashry, Murat Dere, Neşe Özgür, Emel Gürbüz, Dilara Oksüz, Hale Nur Çoloğlu, Pelin Tören, Orhan Genç, Arbab M. Toufiq, Ahmet Kağan Kolsuz, Reha Özalp, Ahmet Başaran, and Seyit Ali Yaşar.
I would like to thank all the faculty members, students and engineers at UNAM-National Nanotechnology Research Center. This work is partly supported by The Scientific and Technological Research Council of Turkey (TÜBİTAK) under project no: 113A055.
viii
Last but not the least, I want to express my deepest and unlimited gratitude to my family; my father, and my mother, for all their support and steadfast throughout my academics. They have always believe in me and encourage me thoroughly.
ix
x
Contents
Chapter 1 ... 21
1.1. Introduction ... 21
1.2. Materials for Microfluidics Fabrication ... 26
1.2.1. Soft Lithography ... 27
1.2.2. Paper-based Microfluidic Devices ... 28
1.3. Anisotropic Wetting in Microchannel ... 30
1.4. Flow Regime in Microchannel ... 35
1.4.1. Fluid Control ... 35
1.5. Cell Biology in Microfluidics ... 36
1.5.1. Laminar Flow for Cell Biology ... 37
Chapter 2 ... 39
2.1. Thermal Fiber Drawing ... 40
2.1.1. Preform Preparation ... 40
2.1.2. Preform Drawing ... 42
Chapter 3 ... 46
3.1. Polydopamine (PDA) Coating of PEI Fibers ... 46
3.2. Extreme Anisotropic Wetting on Free-standing Textured Fibers ... 50
3.2.1. Spontaneous Capillary Flow Calculation ... 52
3.3. Preparation of Fiber Arrays ... 53
3.3.1. Water Spreading Dynamics of Fiber Arrays ... 55
3.4. Three-dimensional Microfluidic Channels ... 57
xi
3.5. Microfluidics Switch Design ... 61
3.6. Flexibility of the Channels ... 62
3.7. Protein Assay as a Proof of Concept ... 64
Chapter 4 ... 69
4.1. Fabrication of Surface Textured Polymer Fibers ... 71
4.2. Introduction of Nano-scale Roughness on the Fiber Surfaces ... 74
4.2.1. Ormosil Nanoparticle Coating ... 74
4.3. Surface Characterization of Fiber Arrays ... 75
4.3.1. Comparison of Anisotropic Behavior on Fiber Arrays ... 79
4.4. Droplet Manipulation on Fiber Arrays and Tracks ... 82
Chapter 5 ... 86
5.1. Experimental Section ... 87
5.2. Surface Modification of Hierarchical PC Fiber by UV/Ozone ... 94
Chapter 6 ... 96
6.1. Conclusion ... 96
6.2. Future Work ... 97
xii
List of Figures
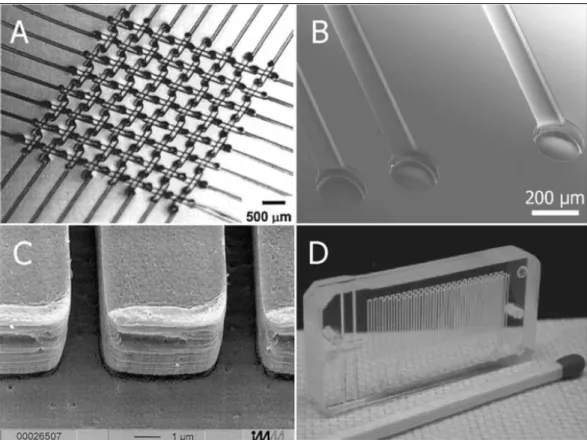
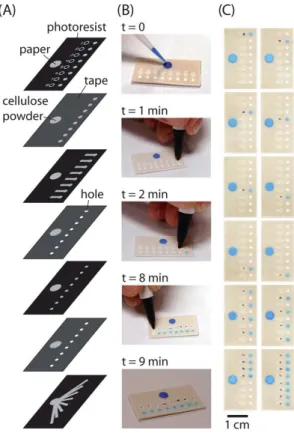
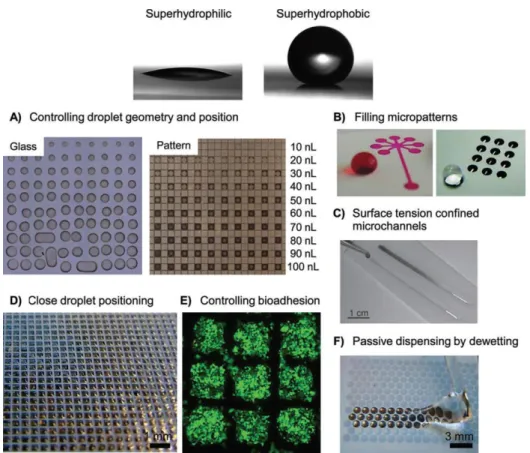
Figure 1: Disposable polymer microfluidic devices. (A) Basketweave pattern of a 3D PDMS microchannel system. (B) Multilayer microchannels replicated in thermoset polyester (TPE). (C) Embossed microstructures in PMMA. (D) PMMA device fabricated using laser ablation (CO2 laser) [1]. ... 28 Figure 2: A fluidic de-multiplexer. Fluid from a single inlet can deliver fluid to eight combination of outlets by using this device. The device consists of a fluid inlet, eight ‘on’ buttons, and eight circular zones connected to the outlet of each button. (A) Schematic illustration of the layers in the fluidic multiplexer. (B) The de-multiplexer can be switched by compressing the ‘on’ buttons before or after the fluid is added to the fluid inlet. Ball-point is used to press the buttons at one minute intervals after adding fluid (1 mM Erioglaucine) to the inlet. (C) Pictures of de-multiplexers after compressing different buttons or combinations of buttons by adding fluid to the source. Each picture shows a different device switched on separately [33]. ... 29 Figure 3: Schematic view of water contact angle and Young’s equation. ... 31 Figure 4: The two different superhydrophobic models; (a) The Wenzel state in which the liquid wet the entire contour of the solid surface. (b) The Cassie state where the liquid only contacts the peak of the asperities and forms air pockets [88]. ... 32 Figure 5: Advantages of superhydrophilic-superhydrophobic patterns. Top: A water droplet on a superhydrophilic surface, and a water droplet on a superhydrophobic polymer surface. (A) Pictures showing the difficulty to control the size and geometry of a dye solution when printed on glass, whereas volume independent confinement of the same solution printed on an array of 500 μm superhydrophilic squares separated by 62.5 μm superhydrophobic barriers is realized. (B) Left: Superhydrophilic pattern filled with aqueous dye solution. Right: A water droplet on the superhydrophobic background with array of superhydrophilic spots filled with water. (C) Dye gradient on fluid stripes on a hydrophobic coated slide. (D) Microarray of droplets formed by dipping the patterned substrate (335 μm superhydrophilic squares, 60 μm
xiii
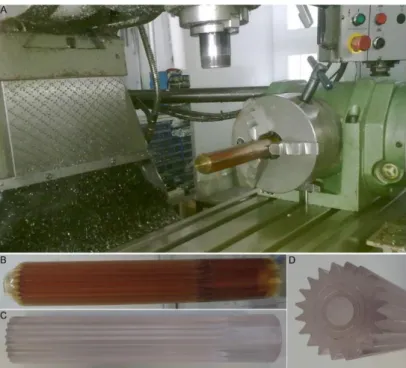
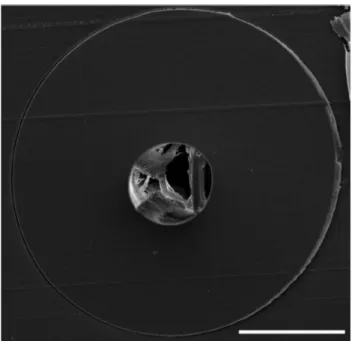
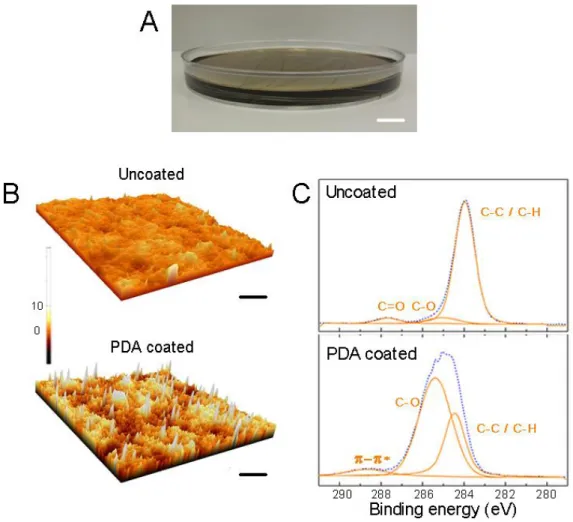
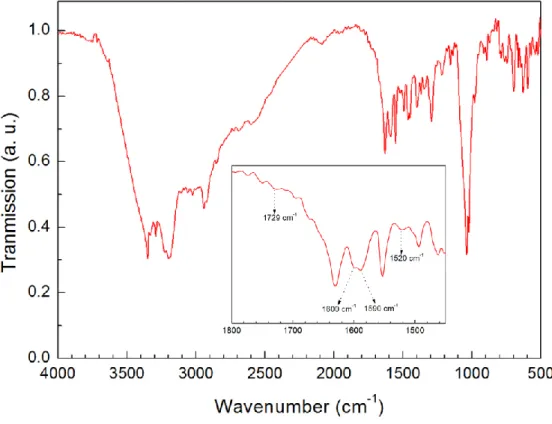
superhydrophobic barriers) into water. (E) Fluorescent cells cultured on a patterned substrate (335 μm superhydrophilic squares, 60 μm superhydrophobic barriers) for 48 h. (F) Image of water showing discontinuous dewetting when being moved along a patterned surface (1 mm diameter superhydrophilic circles, 100 μm superhydrophobic barriers) to form droplets only in the superhydrophilic spots [91]. ... 34 Figure 6: On-chip cell studies. (A) Optical micrograph of a fluorescence activated cell sorter (µFACS) device. (B) Fluorescence micrograph of two cell types [fluorescently labeled human bladder cancer cells (ECV304 cell line) and bovine adrenal capillary endothelial cells] deposited on a tissue culture dish in a polydimethylsiloxane (PDMS). (C) Optical micrograph of a normal red blood cell existing a blockage formed by malaria-infected erythrocytes in a PDMS microchannel. (D) Optical micrograph of a single Jurkat T cell captured in a cell dock [1]. ... 38 Figure 7: Polymer preform surface modification. (A) Lathe with preform mounted for structuring V-grooves, (B) PEI grooved preform, (C) PC grooved preform, and (D) edge view of PC grooved preform showing V-grooves and hollow core after removing Teflon rod. ... 41 Figure 8: Fiber drawing scheme. (A) Stretched PC preform during fiber drawing, (B) Fiber drawing tower. ... 42 Figure 9: PEI fiber fabricated by thermal drawing method. (A) Photograph of preform after fiber drawing (scale bar: 5 mm). (B) Photograph of drawn microstructured fibers of several meters showing their robustness and flexibility (scale bar: 1 cm). ... 43 Figure 10: (A) SEM micrograph of a 500 µm diameter and a 200 µm diameter textured polymer fiber showing microscale ordered grooves on their surfaces (scale bar: 100 μm). (B) SEM cross section of ordered micro grooves on textured fibers. Fibers preserve their 20 equilateral V - grooves along their length (scale bar: 50 µm). ... 44 Figure 11: Cross-sectional SEM image of smooth PEI fiber with a diameter of 300 µm. (Scale bar: 100 µm). ... 45 Figure 12: PDA coating and characterization. (A) PDA coating is achieved by dipping the fibers into dopamine solution for a determined time (scale bar: 1 cm). (B) AFM micrographs of uncoated and PDA coated fiber surfaces. After surface modification
xiv
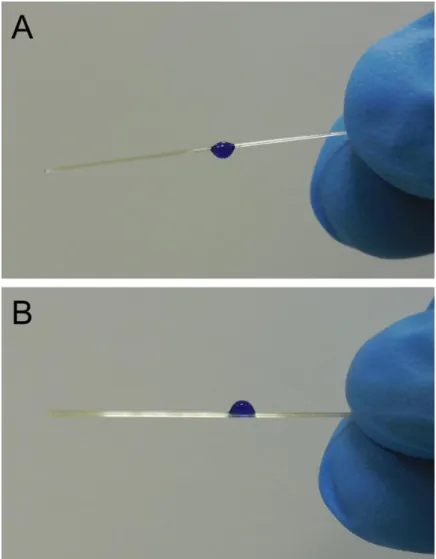
nanoscale roughness is introduced with PDA coating to the fiber surface (scale bar: 1 µm). (C) C1s XPS spectra of uncoated and PDA coated fibers. ... 47 Figure 13: (a) Absorption spectrum of dopamine solution, which is polymerized for 24 hours, showing the broad absorption of PDA. (b) Transmission spectra of PDA coated and bare PEI film. Film transmission decreased significantly after PDA deposition.48 Figure 14: FTIR spectrum of PDA powder, which is polymerized for 24 hours. Inset shows the assigned peaks. ... 49 Figure 15: Exceptional anisotropic wetting of star-shaped fibers. Dyed water is introduced to a free standing PDA coated star-shaped fiber. (A) Each fiber has 20 individual, parallel micro-channels on its surface (scale bar: 3 mm). (B) Close up photograph of the fiber end (scale bar: 100 µm). (C) Cross sectional view of the dyed water introduced fiber (scale bar: 100 µm). (D) The case when the water is introduced from the upper surface. Only the channels that come into contact with the water are filled (scale bar: 100 µm). ... 50 Figure 16: Colored water droplets (3 µL) on (A) PDA coated smooth and (B) uncoated star-shaped fibers, indicating that for complete wetting of fiber surface both V - groove structure and PDA coating is essential. ... 51 Figure 17: Water contact angles (CA) of bare PEI (A) and PDA coated (B) PEI films. After modification with PDA hydrophobic polymer surface becomes very hydrophilic. ... 52 Figure 18: Geometry of a single groove on a 300 µm diameter fiber filled with water. The groove is an equilateral triangle of side length 40 µm. ... 53 Figure 19: Extremely anisotropic wetting of star-shaped fibers. (A) Wetting behavior of fiber arrays. Fiber surfaces are prepared by simply aligning the fibers on an adhesive tape. Parallel and perpendicular corresponds to the direction contact angle measurement is taken. When there is no PDA coating, star-shaped fibers are more hydrophobic from smooth fibers due to increased roughness of the PEI surface. After PDA modification of the surfaces, both smooth and star-shaped fibers show increased hydrophilic behavior. However, water is spread to the whole length of the fiber for star-shaped fibers. (B) Contact angle measurements of fiber array surfaces. (C) A fiber
xv
array comprised of 16 fibers of length 6 cm. Dyed water of different colors is introduced to the surface (scale bar: 2 mm). ... 55 Figure 20: Spreading rates in fiber arrays with various fiber diameters (500 µm, 300 µm, and 200 µm). ... 57 Figure 21: Construction of microfluidic networks with star-shaped fibers. (a) Spontaneous wetting is achieved in about 2.5 minutes to the whole length of 15 cm fibers aligned in a curved path (scale bar: 1 cm). Orange arrows show the point of dyed water introduction. (B) Distribution of liquid to multiple channels from single drop. Single fibers of diameter 300 µm spread the dyed water to any direction (scale bar: 5 mm). (C) Connection of microfluidic channels by stacking fiber arrays. Liquid spread on the above array is transferred to the below array (scale bar: 5 mm). (D) Shows a close up view of the connection point. (E) A three-dimensional system comprising of 4 channels crossing one another. At the intersection points, two uncoated larger hydrophobic star-shaped fibers are placed at the both sides of the below channel serve as spacers to prevent contact between below and above channels (bridge geometry). (Scale bar: 5 mm). (F) Shows close-up view of the bridge from a different angle. ... 58 Figure 22: Demonstration of end to end added channels that can transmit water from one to another. Orange arrow shows the point of dyed water introduction. ... 59 Figure 23: Water (20 µL) filling times of four different open microfluidic channels. ... 60 Figure 24: Switches that control water spreading. Utilizing the observed liquid transfer upon stacked fibers, a simple button mechanism is shown. (A) Initially there is no liquid at the below array, there is no intermixing between above and below arrays (i) (scale bar: 5 mm). (ii) When the above array is pressed down with a tweezer it comes into contact with the below array and spontaneous spreading begins at the below array instantaneously. (iii) After release of the above array it relaxes back to its initial position and there is no further liquid transfer between channels. At the end stage water is distributed to the whole length of the below array. (B) Interplanar button mechanism. This example shows a button for liquid transfer between planes. Spontaneous spreading begins instantaneously by contact with the already wet array (scale bar: 5 mm). ... 62
xvi
Figure 25: Fiber based microfluidics unrestricted with planar based systems. Since fibers are flexible, the observed anisotropic wetting behavior can be achieved on any surface. (A) Spontaneous wetting on fibers of length 15 cm rolled around a glass tube (scale bar: 5 mm). (B) Microfluidic channel array on a flexible surface. The array consists of about 120 microchannels on 12 fibers, uncoated 500 µm star-shaped fibers are added in between the coated 300 µm fibers for avoiding the delivery of liquid to the wrong array (scale bar: 5 mm). ... 63 Figure 26: An example of a microfluidic channel demonstration on a three-dimensional object which shows fluid climbing a ramp. Orange arrow shows the point of dyed water introduction ... 64 Figure 27: Protein assays. (A) Demonstration of water transfer from a microfluidic channel to a piece of filter paper. (B) A protein assay composing of three detection zones. Upon addition of HSA immediate color change occurred at all detection zones (scale bar: 1 cm). (C) A protein assay composing of three analysis and control spots and three switches. After activation of all switches color change was observed in analysis spots (scale bar: 5 mm)... 65 Figure 28: Concentration dependent colorimetric response of the array. All experiments were performed in triplicate. Mean color intensities were calculated by averaging the change in the RGB values (compared to white) of randomly selected pixels. Inset shows the photographs of the color change in the assays after protein introduction. ... 66 Figure 29: Side view of a gap covered with a piece of paper, similar to the control spots in the protein assay. Although the two channels are connected over the gap with a piece of paper, blue colored water (introduced to the channel at left) did not transfer to the other channel (right channel). ... 67 Figure 30: Fabrication scheme of V - grooved PEI microfibers and surface modification with nanoparticle coating. (a) Thermal drawing of V - grooved microfibers from the macroscale star-shaped PEI preform. (b) SEM micrograph illustrating cross-sections of (i) 200 µm and 500 µm sized fibers with 20 parallel V-grooves (scale bar: 100 µm), and (ii) 500 µm size fiber showing the textured microgrooves that form microchannels which extend along its entire length (scale bar:
xvii
100 µm). (c) SEM micrographs of a coated fiber showing homogeneously coated nanoparticles (scale bars: 15 µm and 1.5 µm (inset)). (d) AFM micrographs of uncoated and nanoparticle coated fibers. Nanoparticle coating introduces a random nanoscale roughness on the ordered microscale roughness of the fiber surfaces (scale bars: 0.5 µm). ... 72 Figure 31: SEM image of (a) cross-section of smooth PEI fiber with a diameter of 300 µm, (b) 200 μm, 300 μm, and 500 μm of smooth PEI fibers, (c) cross-section of V – grooved fiber of 300 μm diameter, and (d) TEM micrograph of interconnected ormosil colloidal nanoparticles (with sizes of about 10 nm) forming a porous network layer. ... 73 Figure 32: Schematic illustration of ormosil nanoparticle spray coating on fiber surface. Spray gun is loaded with diluted ormosil solution, and then a surface is brought into close proximity (approximately 30cm away from the gun) with the gun. Ormosil gel was diluted in methanol solution. Pressurized nitrogen gas passes through the gun at 2 bar and the solution is sprayed onto fibers for about 2 – 3 s at ambient atmosphere. The sample is let dried at roomm temperature. ... 75 Figure 33: Model construction of surfaces for CA measurement on glass substrate using double sided tape (a), and CA values measurement on different substrates including glass, PC film, and PEI film and their coated surfaces (b). ... 76 Figure 34: (a) Contact angle measurements of fiber array surfaces (with each fiber 8 cm in length and 300 µm in diameter) with 4 µL water droplets. The measurements were taken from parallel and perpendicular directions, which correspond to the directions with respect to the fiber orientation of the surfaces. (b) Photographs showing the wetting behavior on PEI fiber surfaces. (i) The droplet on uncoated smooth fibers is in the Wenzel state, where spaces within the fibers are filled with water as seen in the inset. For nanoparticle coated smooth or uncoated grooved fiber surfaces, the droplets are in an intermediate state between Cassie and Wenzel states. (ii) The smooth fiber surface is wet, but the water cannot penetrate the in-fiber spaces for the array of coated smooth fibers. (iii) For the case of uncoated grooved fibers, water filled the micro-channels within the microscale grooves yet cannot wet the spaces between the fibers as seen from the inset. (iv) The droplet is in the Cassie state on nanoparticle
xviii
coated grooved fibers. The water droplet rests on the tips of triangular protrusions on the fibers and water cannot penetrate the grooves or the spaces between fibers. ... 78 Figure 35: Comparison of groove dimension on the basis of anisotropic behavior. (a) Uncoated 200 μm, 300 μm, and 500 μm grooved PEI fiber arrays, and (b) coated 200 μm, 300 μm, and 500 μm grooved PEI fiber arrays. ... 80 Figure 36: (a) Roll-off angle values measured on ormosil coated grooved fiber arrays (FA) formed by fibers with diameters of 500 µm, 300 µm and 200 µm (FA500, FA300 and FA200), and their combinations (FATrack1 and FATrack2). (b) Anisotropy (∆θ=SA⊥- SA∥) of the fiber arrays, showing enhanced anisotropic non-wetting behavior on FATrack1 and FATrack2 surfaces. (c) Photographs of droplets on FATrack1 and FATrack2. (i) FATrack1 is a parabolic array of 500 µm/300 µm /200 µm /300 µm /500 µm fibers. (ii) FATrack2 is a channel composed of 500 µm x2/200 µm x3/500 µm x2 array. (d) The relation between roll-off angle and droplet volume on FATrack2. Roll-off angle decreases with increasing droplet volume in both parallel and perpendicular directions. However, roll-off angle is higher in the perpendicular direction for all droplet volumes, which demonstrates the anisotropic non-wetting behavior of the surface. (e) Roll-off and adhesive properties of nanoparticle coated smooth and grooved fiber surfaces. (i) Anisotropic roll-off in parallel direction on the FA300 surface tilted at 14º. (ii) The droplet remains pinned to a nanoparticle coated fiber surface with 300 µm smooth fibers even when the surface is tilted at 90º. (iii) Pinned droplets on a flexible substrates for conceptual demonstration. ... 82 Figure 37: Droplet transport and mixing. (a) Snapshots of a 4 µL suspended droplet on the roll-off superhydrophobic fiber surface (array of 300 µm coated grooved fibers). The droplet is transferred from the superhydrophobic surface to the sticky surface (array of nanoparticle coated 300 µm fibers) upon bringing the two surfaces in close proximity. (b) Droplet transportation with fiber surfaces prepared on arbitrary surfaces. (i) An array of 300 µm coated smooth fibers was prepared on the fingertip of a nitrile glove. By gently touching the resting blue dyed water droplet (on the 300 µm nanoparticle coated grooved fiber surface), it was transferred to the fingertip. (ii) The blue droplet was carried on the fingertip and was contacted with the red dyed droplet
xix
resting on a sticky surface manually. (iii) The resulting droplet after mixing of the initial red and the blue droplets. ... 83 Figure 38: (a) Snapshots of a droplet rolling on the curved fiber track (FAtrack2) taken with a high-speed camera. Water droplet followed the curved path outlined by the fibers at a roll-off angle of around 11º. (b) A droplet based protein assay for colorimetric detection on linear fiber tracks. (i) Dispensing yellow BPB and colorless protein solution (8 µL and 9 µL, respectively). (ii) The instant of the droplet collision. (iii) Color change after coalescence of the two droplets. The yellow color of BPB solution changed to blue after mixing with the protein solution. ... 85 Figure 39: Scheme of UV cabinet for UV/Ozone treatment of polycarbonate surfaces. ... 88 Figure 40: (a) and (b) X-ray photoelectron spectroscopy (XPS) survey spectra of PC surfaces before and after UV/O treatment for 30 minutes. (c) and (d) high-resolution C1s spectra of the PC surfaces before and after UV/O treatment for 30 minutes. .... 89 Figure 41: AFM micrograph of untreated and UV/O treated PC films. The treatment time was 30 minutes. Change in the roughness contour is seen as the surface reconstructed after the treatment. ... 90 Figure 42: Contact angle measurements of different type of polymer materials. (a) UV/O treated and (b) untreated surfaces. ... 91 Figure 43: CA comparison between of PC film treated in an ambient atmosphere for 30 min and in excess O2 for 10 min. ... 92
Figure 44: (a) Exposure time dependent of CA measurement on PC film and (b) Effect of excess oxygen on different polymers... 93 Figure 45: CA Measurement in time during treatment of PC with excess oxygen applied. ... 94 Figure 46: Multiscale rough PC polymer preform (a, b) and thermally drawn PC fiber with preserved multiscale roughness (c, d). ... 95
xx
List of Tables
Table 1: Infrared bands of PDA powder ... 49 Table 2: RGB (Red, green and blue) values collected for 10 individual pixels for each analysis and control spot. RGB color model assigns a numerical value to each of the three primary colors, red, green and blue, in order to define each possible color as a function of the primary colors. The yellow shade of analysis spots and the blue shade of control spots were captured by a conventional scanner and RGB values were extracted by a commercial image editing software. ... 68
21
Chapter 1
Microfluidics
1.1. Introduction
For the past 15 years, significant developments in microfluidics have been achieved analogous to the benefits in miniaturization that microelectronics industry realized [1]. Utilization of minute quantity of sample and reagents in biological and chemical analysis is an important topic attracting scientists nowadays. In microfluidics, fluids at microliter, nanoliter, or picoliter volumes within micrometer-sized channels (ranging from 5 to 500 µm) are manipulated with respect to their physical consequences of microscale fluid dynamics. Also, due to small size, the used of microfabrication techniques adapted from the semiconductor and plastic industries are mandatory. These techniques include photolithography, micromachining, embossing, replica molding, and injection molding [2–11]. Miniaturization of the devices enables for automation of laboratory procedures for disease analysis and genomic applications. Rapidly advancing, lab on a chip has high promising potential in the mainstream of biological and chemical analysis that aims at using minute sample and reagent volume to attain low waste levels and specialty of microscale fluid flow. The smaller dimension of the microchannel is advantageous for reduced reagent handling cost [12]. The ability to produce large quantity of microfluidics device reduces cost. The main benefits regarding the use of microfluidics in biological and chemical analysis include fast analysis, short reaction times, portability of device, and multiplexing capability – parallel processing of samples. Until now, several platforms have been introduced as compact microfluidics that exhibit fast response time, high accuracy, high selectivity and high throughput. But, they are neither affordable nor disposable [1, 8]. Researchers have been working to find the way to make this technology prevalent in medical sector where it is believed to have strong hold. Right after its introduction by Terry et al. in
22
1979 as silicon-based analysis system, microfluidics has been the issue of modern medicine [11]. Then, in the 1990s, Manz et al. contributed to the advancement of microfluidics application [9]. Also, in the field of molecular biology, the emergence of genomics in 1980s required analytical techniques with high throughput and sensitivity. Microfluidic devices are used as portable diagnostic devices for the early detection of diseases such as diabetes, HIV, cancer, and cardiovascular [13–15]. In biological application they are used in DNA sequencing and immunoassays [4, 16– 21]. Other microfluidic applications include microelectronic cooling systems, ink jet printing, and micro-reactors [22–27].
During the early stage of microfluidics technology, silicon, steel and glass were the first materials utilized to build specialized systems that require chemical and thermal stability. Mechanical stability of silicon and glass materials plays very important role in microfluidics in which channels with rigid and strong walls can be useful [8, 30, 31]. However, these material are not biocompatible, they are fragile (especially glass) and susceptible to chemical corrosion and require great labor of production. Microfabrication of microfluidic devices is tedious and consumes huge amount of time. Therefore, inexpensive, biocompatible, high throughput, scalable, and disposable microfluidic devices are highly demanded for biological and chemical analysis. Emergence of polymer materials mainly polydimethylsiloxane (PDMS) as a candidate material for microfluidic devices tackles aforementioned limitations. It promotes design simplicity and addressed much of the problems that early materials failed to provide when utilized in microfluidics. PDMS is the most commonly used material in research laboratories because of its outstanding physical and chemical properties. For instance, PDMS is used in microfluidics channels because it has advantages over glass and silicon such as flexibility, biocompatibility, elasticity, and high optical transparency. PDMS is unreactive and permeable to gases, and can be bonded to glass surfaces. Cells culture and DNA/protein separation are widely studied in PDMS. It is easily integrated with external components such as pumps, mixers, valve, flow sensors, and pneumatic sensors. However, PDMS has disadvantages despite being reliable microfluidics materials. It absorbs organic solvents which can be detrimental in cells study. Other polymer materials of interest are polystyrene (PS),
23
polycarbonate (PC), polyester and polyurethane (PU) which nowadays attract great attention of researchers due to their characteristic physical and chemical properties especially in cell culture [2, 12].
The state of the art of the existing microfluidics is usually integrated with external components to aid smoother fluid flow in some fluid dynamic regimes. External components that are integrated to microfluidics include pumps, valves, and mixers. These are the basic elements required for local controlled fluid movement inside microchannel. Scaling of forces in microfluidics is vital in order to understand which force is effective in microscale channel during flowing regime. Some forces are more dominant in the micro domain. The influence of different forces such as gravity, surface tension, and pressure varies with the dimension of the microchannel. Pressure force and electromagnetic field force are mainly employ for pumping fluid as they scale favorably in the microfluidics regime.
Scaling of Force field in Microfluidic Channel - Scaling law (Trimmer 1996, Wautelet 2001) explains the effect of these forces as the channel dimension decreases. Surface tension and Van der Waals scale linearly with length, however, are difficult to manipulate. Electrical force and pressure force scale to the square of the length dimension. Gravity and magnetic forces scale to the cube of the length dimension and are insignificant in microscale. Therefore, pressure and electrical forces are more dominant over all other forces in microfluidic regime. Surface property play an important role depending on the nature of material. Surface chemistry is a driving force in manipulating fluid by electrokinetic – electroosmotic flow in capillary electrophoresis, which is based on the movement of bulk solution in a capillary or channel due to the movement of counterions near the surface of the walls of the channels under the influence of an applied electric field.
Pressure driven pump is by far the most commonly used integrated pump in research laboratories. It is a benchtop laboratory equipment attached to microfluidic on a chip to drive fluid move across the channels, and therefore cannot be deploy to field for analysis. This kind of obstacles raise the issue to develop integrated compact
24
and portable microfluidics which uses nonmechanical pumps to produce steady flows. With this kind of microfluidic system, it is possible to carry out analysis in field or home at any instant. Consequently, new microfluidics architecture for simple yet complex devices utilizing nonmechanical pumps governed by various forces including electrokinteic, capillary action, and centrifugal force have been realized. Thus, the fabrication of open-channel microfluidics becomes possible.
As low-cost competitors of conventional fabrication methods, paper based methods have been developed [32–37]. Paper-based devices utilize capillary wicking to transport fluid through its porous media. Several research groups demonstrated that, using hydrophobic/hydrophilic patterned paper layers, it is possible to construct low-cost disposable devices that can direct liquid flow in three-dimensions [38–40]. However, fabrication of paper devices include tedious photo-lithography and stacking steps. In addition, production of channels with diameters smaller than a millimeter is very challenging due to the rough fibrous structure of the paper (i.e., porous cellular matrix of paper).
Recently, Bayindir research group has developed a new technique for fiber drawing based on thermal iteration. Thermal fiber drawing is a well-established top-down fabrication method which is used for the production of various functional micro and nanostructured fibers [41–44]. Here, we utilize fiber drawing for producing polymer fibers with very regular, aligned microscale surface textures. This approach enabled to introduce intrinsic advantages of fibers including large surface area, flexibility and directionality. Extreme anisotropic spreading behavior due to capillary action along the grooves of fibers is observed after surface modification with polydopamine (PDA). We utilized the fibers as universal microscopic building block to construct three-dimensional open-channel microfluidic devices by simply fixing them to surfaces using double sided tape to form pre-defined architectures. Note that there are examples in the literature that use fiber yarns or fabrics to produce microfluidic channels [45–48]. These studies use bundles of fibers to transport liquids by taking advantage of the porous structure of fiber network in a similar manner to the paper based channels.
25
In this study, on the other hand, we engineered fiber surfaces to produce well-defined microfluidic channels on individual fibers. We produced on-fiber microfluidic channels in two steps; i) star-shaped very long polymer microfibers are produced by thermal drawing of a surface-structured polyetherimide (PEI) preform, ii) surface of the fibers is coated with PDA in order to provide them hydrophilic surface chemistry and nano-scale roughness over their textured surface topography. The PDA functionalized star-shaped fibers exhibited extreme anisotropic superhydrophilic behavior, which enables confinement of small liquid portions through microgrooves on the fibers which are tens of centimeters in length. Flexibility of the fibers enables production of complex three-dimensional device geometries that can control liquid spreading in both lateral and vertical directions. We first demonstrated preparation of several fiber based microfluidic device components such as open-channels, connections, bridges and switches on both planar and unconventional geometries. We then developed a proof of principle colorimetric protein assay for human serum albumin (HSA) detection. In the second part of this work, anisotropic non-wetting of the structured fiber by functionalizing with organically modified silica nanoparticle was investigated. Therefore, it was proven that structured polymer fiber cannot only be functionalized to be superhydrophilic, but also superhydrophobic in the sense that directional nonwetting is observed akin to extreme anisotropic wetting. It is an intrinsic property of fiber that allows the selective surface modification. The realization of artificial surfaces with anisotropic non-wetting capability is inspiring for the development of self-cleaning surfaces, droplet microfluidics, droplet micro-reactors for precise chemical and/or nanomaterial synthesis, and droplet transportation at precise volumes [49–52].Functional anisotropic surfaces of different architectures were constructed by fixing the fibers on paperboard, polymer, and glass substrates using double sided adhesive tape. The scalability of the fibers and optional nanoparticle surface modification enable construction of variety of fiber surfaces with different wetting characteristics. We demonstrated droplet transport with sticky hydrophobic (contact angle greater than 90°) and roll-off superhydrophobic (contact angle greater than 150°) surfaces, droplet guiding on track surfaces, and a simple protein assay with colliding droplets as examples of droplet manipulation with alternative surface designs. In the third part of this work, a new approach to
26
functionalization of PC fiber surface was studied. PC fiber was expose under Ultraviolet/Ozone (UV/O) thereby altering its surface chemistry to enhance the wetting property to superhydrophilic (contact angle nearly 0°). Lastly, conclusion and future work are discussed.
1.2. Materials for Microfluidics Fabrication
The common fabrication methods of microfluidics include micromachining, photolithography, etching, micro-molding, bonding and laser writing [1]. Early version of microfluidics were composed of silicon or glass patterned by micromachining [53, 54]. However, these materials have later been tremendously substituted and replaced by polymers due to their optical limitations such as transparency. Particularly, silicon is expensive and opaque [8]. Use of glass in microfluidics as a result of its facile fabrication technique has been around for a decade. It has been utilized in microfluidics due to its well-known fabrication method, surface stability, and chemical stability, and optical transparency. However, high cost of production and limited usage as disposable devices hinder its wide spread utilization in microfluidics [53]. PDMS is the common microfluidics material used for µtotal analysis. It is a soft elastomer, inexpensive, flexible, and optically transparent to a wavelength roughly 230nm. Its biocompatibility enables biological studies because it is permeable to water, gases and nontoxic to cell. Another advantages of PDMS over silicon and glass is that, PDMS can be fabricated and bonded to a surface [2]. On the other hand, some cells materials are nourish in different environment and therefore polymers such as poly (methyl methacrylate) (PMMA), SU-8 and PC are preferably used [56–58].
PDMS is very attractive polymer that has essential properties for microfluidic channels. It can be used with aqueous systems of cell biology. It is electrically insulating and its surface can be oxidized to have Si-(OH) groups; thus PDMS is made hydrophilic. The hydrophilic surface of PDMS is suitable for cell adhesion in biological analysis or in fluid transport. These particular characters of PDMS make it
27
useful for biological studies. Fluid can be manipulated in PDMS microchannel depending on the design introduced during fabrication [57].
1.2.1. Soft Lithography
A term invented by Whitesides and coworkers, soft lithography in PDMS is one of the important contributions in microfluidics technology as a method of fabricating prototype devices [8]. This technique consists of replica molding of elastomeric material (PDMS) for the fabrication of microfluidics [4, 59]. It is also used for patterning using PDMS stamps onto a surface. Lithography of silicon wafer is involved in this method to pattern features using photoresist (SU-8), then PDMS molds are replicated with feature of sizes limited to 8 µm. Thin membranes patterned PDMS can easily be stacked to form 3D microfluidic systems (Figure 1A) [60, 61]. Replica molding incorporated with PDMS by pouring prepolymer (PDMS) directly onto a patterned silicon master and curing at moderate temperature (60º C for approximately 2h) to copy the desired architecture. Closed microchannel is designed by conformal sealing on any preferred material’s surface [62, 63]. Soft lithography of PDMS has advantages including low-cost, fast processing (typically less than one day), multilayer fabrication of 3D devices, reusability, and suitability for cellular applications [64, 65]. The flexibility nature of PDMS is an intrinsic property that makes it viable for installation of fluidic interfaces from the macro-world to the microfluidic systems [66– 68]. There are some drawbacks of PDMS which are limited compatibility with organic solvents, difficulties in controlling surface properties and permeability for carrying out in-channel oxygen-sensitive polymerization reactions [69, 70]. Roll et al. have demonstrated that cross-linked perflouropolyether elastomers can be used instead of PDMS. Perflouropolyether elastomers have properties akin to PDMS but do not absorb many organic solvents as does PDMS [69]. Also, other techniques are developed to design polymer materials for microfluidic applications including embossing and laser ablation (Figure 1B, C, and D).
28
Figure 1: Disposable polymer microfluidic devices. (A) Basketweave pattern of a 3D PDMS microchannel system. (B) Multilayer microchannels replicated in thermoset polyester (TPE). (C) Embossed microstructures in PMMA. (D) PMMA device fabricated using laser ablation (CO2 laser) [1].
1.2.2. Paper-based Microfluidic Devices
Due to the increasing demand of inexpensive, easy-to-use, and disposable microfluidic systems [32–37], paper-based analytical devices (PAD) (e.g., medical toolkit) are invented to foster early disease detection in developing countries [38–40]. PADs are made from paper material and then patterned into hydrophilic channels bounded by hydrophobic polymer with specific geometry. The channels of the device will be filled with fluid in a sequence predetermined by the design. Control of fluid over flow direction is programmable in which the device structure and its function are determined by the user after fabrication is complete. With programmable µPAD, the user can select a desire channel of the device to be filled with fluid. A single device can multitask at a time according to the preferential frame of control. Figure 2A and B
29
illustrates the fabrication steps of paper-based microfluidic device (fluidic de-multiplexer). Simply pressing the connection zone (ON button) with standard ballpoint pen, fluid flows through the channels. The fluid de-multiplexer directed fluid from a single inlet through any combination of outlets. Tuning of specific channels within a time frame for analysis is demonstrated as seen in Figure 2C.
Figure 2: A fluidic de-multiplexer. Fluid from a single inlet can deliver fluid to eight combination of outlets by using this device. The device consists of a fluid inlet, eight ‘on’ buttons, and eight circular zones connected to the outlet of each button. (A) Schematic illustration of the layers in the fluidic de-multiplexer. (B) The de-multiplexer can be switched by compressing the ‘on’ buttons before or after the fluid is added to the fluid inlet. Ball-point is used to press the buttons at one minute intervals after adding fluid (1 mM Erioglaucine) to the inlet. (C) Pictures of de-multiplexers after compressing different buttons or combinations of buttons by adding fluid to the source. Each picture shows a different device switched on separately [33].
30
1.3. Anisotropic Wetting in Microchannel
Anisotropic textured surfaces experience direction-dependent wetting properties which are merely observed on animals and natural bodies [72–75]. Surface wetting is characterized by understanding how liquid makes contact angle upon surfaces [76, 77]. Liquid wetting on solids depends on surface chemistry and surface roughness [76]. Through evolution and species selection, biological surfaces developed beneficial wetting properties such as superhydrophobic and superhydrophilic [52, 79, 80]. Special surface chemistry and surface geometry are the combined effect of wetting found in certain plants and animals [72, 73, 75]. Superhydrophobic, superhydrophilic and superoleophobic microchannels can be designed on any surface for microfluidics applications and self-alignment of microchips [81–84]. For instance, superhydrophobic surface of lotus leave enable self-cleaning [83]. Similarly, butterfly wings [84], moth eyes [85], and desert beetle [86] exhibit distinct wetting properties that can be mimicked to design microfluidics, biomedical devices, and other surface functional smart devices. Extensive research has been conducted to scrutinize biomimetic surface and their application in modern technology [87]. By principle, the contact angle (CA) of a material surfaces either increases or decreases with structural roughness. The roughness ascribed can be isotropic or anisotropic depending on the surface property required for different applications. Microstructured grooves and patterns are the common architecture used to induce directional wetting. The CA of a normal surface is a measure of its surface wettability. Young’s equation defined the CA of any normal surface in equation 1 below:
cos 𝜃𝐶 =𝛾𝑆𝐺 − 𝛾𝑆𝐿
𝛾𝐿𝐺 (1)
Where γSG, γSL, and γLG are the surface tension of solid/gas, solid/liquid, and
liquid/gas respectively. In Figure 3, CA measurement on a normal smooth surface is shown.
31
Figure 3: Schematic view of water contact angle and Young’s equation.
Normal surfaces are classified as hydrophilic when the angle (θC) of the surface is
independent of the droplet size and directly related to the CA < 90°, and hydrophobic when CA > 90°. Even though normal surfaces appear to be macroscopically smooth, they have some micro, nano, and/or molecular roughness scale. The young’s equation does not hold when the surface roughness increases due to the existence of microscale geometries which protrude on the materials to alter the total contact area between solid and liquid. Therefore, wetting of the rough surfaces are described by two different wetting models developed by Wenzel and Cassie-Baxter (Figure 4). In the Wenzel model, the surface is completely wetted and water fills the rough space of the surface, whereas in the Cassie-Baxter model, the droplet wets the surface partially and air pockets form between the surface and water droplet such that the contact line is minimum [77, 78].
32
Figure 4: The two different superhydrophobic models; (a) The Wenzel state in which the liquid wet the entire contour of the solid surface. (b) The Cassie state where the liquid only contacts the peak of the asperities and forms air pockets [88].
The Wenzel model equation is written as:
cos 𝜃𝑊= 𝑟 cos 𝜃𝐶 (2)
Where θW is Wenzel’s CA on the rough surface, r is the roughness parameter:
actual area divided by projected area of the surface and θC is Young’s CA (contact
angle of smooth material of same surface). The Cassie-Baxter model equation is written as:
cos 𝜃𝐶𝐵 = −1 + 𝜑(1 + cos 𝜃𝐶) (3)
Where θCB is Cassie-Baxter’s CA, φ is fraction of wetted area to whole area and
θC is Young’s CA (contact angle of smooth material of same surface). In Cassie State,
water droplet roll-off from surface with CA > 150°. On the other hand, in Wenzel state, water pinned to the surface [89]. Superhydrophobic describes the state of water droplet when CA > 150° and superhydrophilic is when the CA approaches 0°.
In 2007, McCarthy and Gao reinforced a theory proposed by Pease (1945) to question the ideas of both Wenzel and Cassie models [90]. They contended the underlying phenomenon of wetting by trying to prove that the CA of droplets on rough surface within the contact line were identical to those of smooth surfaces. This theory
33
goes against Wenzel and Cassie theories that are modelled based on the contact area and the area fractions on rough surface. According to McCarthy’s theory, the contact line and the kinetics of droplet movement dictate the wettability. This affirms Bartell’s and Extrand’s works in trying to prove that the three - phase structure at the contact line controls the CA and not the liquid - solid interface.
Unique wetting properties arise from combination of superhydrophobic and superhydrophilic patterned regions as illustrated in Figure 5. Control of surfaces geometry enables easy positioning of liquid as depicted in Figure 5A. The combination of hydrophobic and hydrophilic wetting region is the reason of the selective wettability. Fluid can spread spontaneously within micropatterns and filled a specific spot without the need for surfactants (Figure 5B). Remarkable surface control is also demonstrated by the superhydrophilic patterns to confine fluid in microchannels due to surface tension as seen in Figure 5C. Droplets can be placed in close proximity on a surface without rupturing. The droplets positioning is an advantage for biological assay for minute reagent deposition (Figure 5D). Bioadhesion can be controlled by using the air-grid in Cassie-Baxter state (Figure 5E). Extreme difference in water CAs between superhydrophilic and superhydrophobic region leads to discontinuous dewetting without wetting the superhydrophobic background and passively dispensing aqueous solution into the superhydrophilic region as observed in Figure 5F [91].
34
Figure 5: Advantages of superhydrophilic-superhydrophobic patterns. Top: A water droplet on a superhydrophilic surface, and a water droplet on a superhydrophobic polymer surface. (A) Pictures showing the difficulty to control the size and geometry of a dye solution when printed on glass, whereas volume independent confinement of the same solution printed on an array of 500 μm superhydrophilic squares separated by 62.5 μm superhydrophobic barriers is realized. (B) Left: Superhydrophilic pattern filled with aqueous dye solution. Right: A water droplet on the superhydrophobic background with array of superhydrophilic spots filled with water. (C) Dye gradient on fluid stripes on a hydrophobic coated slide. (D) Microarray of droplets formed by dipping the patterned substrate (335 μm superhydrophilic squares, 60 μm superhydrophobic barriers) into water. (E) Fluorescent cells cultured on a patterned substrate (335 μm superhydrophilic squares, 60 μm superhydrophobic barriers) for 48 h. (F) Image of water showing discontinuous dewetting when being moved along a patterned surface (1 mm diameter superhydrophilic circles, 100 μm superhydrophobic barriers) to form droplets only in the superhydrophilic spots [91].
35
1.4. Flow Regime in Microchannel
One of the most important characteristic phenomena of fluid flow in microchannel, laminar flow-occur when two streams of fluid come together in microchannel, they flow in parallel without turbulence and diffusion of molecules occur across the interface between the fluids which results in mixing [8]. This type of flow requires the advancement of specific components to accomplish mixing in many situations. Components including pumps, valves, and mixers, have been developed to generate and handle fluid flow in microchannel [2]. The ratio of inertial to viscous forces on fluids is represented by the Reynolds number (Re) - a dimensionless number used in studying microfluidics [8]. Re is defined by the equation below:
Re
=
𝜌𝜈𝑑µ(4)
Where ρ is the density of fluid (g/cm3), ν is the velocity of the fluid (cm/s), and d is the hydraulic diameter (cm) of the channel. Fluid flow in microchannel is characterized by the dimensionless number Re. When the Re of a fluid is below ~2000, the flow is laminar, whereas above 2000 the flow is turbulent. Fluids which do not mix, flow side-by-side in the microchannel by simply diffusing at their interfaces [93, 94].
1.4.1. Fluid Control
Some of the common fluid flow mechanisms which substantially play important role in controlling fluid motion in microchannels are pressure-driven and electrokinetic flow [1, 2]. In pressure-driven flow, the flow rate Q (m3/s) is given by the equation;
𝑄 =𝑑𝑃
36
Where dP is the change in pressure across the channel (Pa), and R is the channel
resistance (Pa · s/m2). By applying vacuum at the outlet and opening the inlet to
atmospheric pressure, pressure drop can be created. Electrokinetic flow is based on the molecule movement due to their charges in an electric field. Electrokinetic encompasses two components: electrophoresis, which is the consequence of the accelerating force due to the charge of a molecule in an electric field balanced compensated by the frictional force, and electrosmosis that creates a homogeneous flow of fluid down the channel. Small channels have advantage of high surface-to-volume ratio in terms of electrokinetic flow. They give out heat more than large channels [2]. Use of other principles for fluid flow in microchannels has been described. Capillary action is one of the schemes introduced with plasma-oxidized PDMS to deposit immunoglobulins onto a surface [95, 96]. In non-PDMS-based systems, gradient in temperature [96], patterning of self-assembled monolayers with distinct surface free energies [97], capillary action [98], and gradient in surface pressure [99], are the mechanisms used to direct fluid flow.
1.5. Cell Biology in Microfluidics
A vast applications of microfluidics devices in cell biology has been spotted recently, especially in the area of single cell analysis, DNA sequencing, separation, and so on. Initially, capillary electrophoresis (CE) based DNA analysis on-chip is utilized to separate oligonucleotide and sizing of longer DNA fragments [1, 12, 101–103]. The greatest benefit of performing cell study in microchannel is the faster process time realized than in the traditional slab-gel processes. On-chip DNA screening is faster and high throughput technique. For instance, DNA sizing on-chip microfluidics is typically 10 times faster than using capillary electrophoresis and 100 times faster than the traditional slab-gel platform [103]. Glass devices are used to perform DNA on-chip analysis with a sieving matrix of polyacrylamide in microchannel. There are several steps to follow when analyzing a DNA on-chip. First and foremost is the cell lysis - breaking down of cell by enzymic or osmotic mechanism. Then follow by
37
isolation of solid phase - tediously time consuming step. DNA amplification is very significant application of microfluidics. Basically, polymerase chain reaction (PCR) on-chip amplification decreases thermal cycling time which leads to the accomplishment of a shorter overall reaction time. There are various approaches including simple silicon microreaction chamber and a continuous flow PCR with capillary electrophoresis (CE) separation on-chip [105–109]. Leu et al., reported a fully automated and integrated microfluidic system capable of performing all the steps necessary for single cell study, starting from sample preparation to electrochemical via DNA hybridization [109]. With just 1 mL sample of blood introduced on the chip, full detailed analysis is conducted. One of the most outstanding features of the device is that all the necessary component required for fluid manipulation are already integrated [1].
1.5.1. Laminar Flow for Cell Biology
Fluid flow in microchannel is normally laminar flow, and this enables the deposition of cells and proteins on a solid surface [111–113]. This trick is employed to deliver ions and molecules to different parts of living cell with high precision in the subcellular level [113]. A solution containing mitochondrial dyes contacted different regions of a cell, and the movement of the various populations of mitochondria was monitored. It was observed that after 2.5 hour they thoroughly mixed Laminar flow was used to answer the fundamental questions of how signal transmission occurs in a cell upon stimulation by a ligand [12, 115]. Another technique called flow cytometry is adopted for clinical and disease diagnostic, cell screening, and antibody labelled bead assay. Hydrodynamic focusing together with T-channel design that utilized EOF to direct fluid flow for cell sorting (Figure 6A). Another advantage of microfluidics is that, single cell capture is very handy with high precision. It is demonstrated to have deposited multiple types of cells over a surface with controlled location [1, 116]. This widen the horizon for fundamental studies in cell biology (Figure 6B).
38
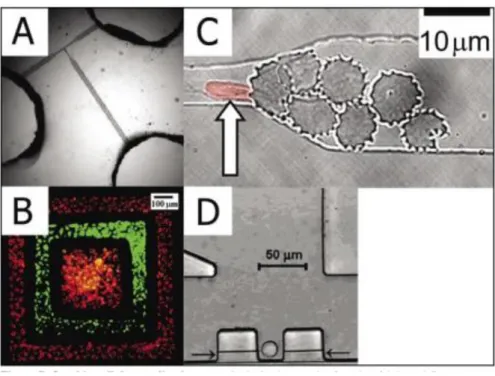
Figure 6: On-chip cell studies. (A) Optical micrograph of a fluorescence activated cell sorter (µFACS) device. (B) Fluorescence micrograph of two cell types [fluorescently labeled human bladder cancer cells (ECV304 cell line) and bovine adrenal capillary endothelial cells] deposited on a tissue culture dish in a polydimethylsiloxane (PDMS). (C) Optical micrograph of a normal red blood cell existing a blockage formed by malaria-infected erythrocytes in a PDMS microchannel. (D) Optical micrograph of a single Jurkat T cell captured in a cell dock [1].
39
Chapter 2
Fabrication of Anisotropic Polymer
Fiber
Microfluidic channels that use capillary wicking or directional wetting to control liquid flow are promising alternatives to conventional systems that require external pumps, which limits the simplicity and integrity of the system and thus restricts its use in a number of applications [73, 117–121]. In these channels, liquid flow is controlled by anisotropic (i.e. directional) surface structures (e.g. grooves, pillars and nanowires) or surface chemistry (e.g. hydrophilic/hydrophobic patterns) [70, 74, 122–127]. Such systems are widespread and have been fabricated on a variety of surfaces including glass, silicon and polymers. Current fabrication methods of both physically and chemically patterned surfaces are dominantly based on micro-fabrication techniques such as photolithography, laser-writing and plasma etching [83]. Although these techniques have shown to be very successful for shaping material at the microscale, they are impractical for fabrication of affordable microfluidic systems. In addition, fabrication of three-dimensional architectures, which is particularly important for compact and multicomponent microfluidic devices, is challenging with lithography based methods. In this chapter, the fabrication of polymer fibers of PEI and PC is discussed. Thermal reduction method was utilized to draw the fibers with variable diameters.
40
2.1. Thermal Fiber Drawing
Thermal fiber drawing is a well-established top-down fabrication method which is used for the production of various functional micro and nanostructured fibers. This simple and robust technique enables the drawing and maintaining well defined material geometries along the length of the fiber. In this work, we utilized fiber drawing method to fabricate and modify fiber surface by introducing V-grooves in order to obtain enhanced anisotropic wetting on the fiber surfaces. This is the first application of fiber drawing technique for the fabrication of surface modified fibers to the extent of our knowledge. High throughput of the fiber is the novelty of this method and the ability to structure the macroscopic fiber preform with a specific geometry such as the V-grooves.
2.1.1. Preform Preparation
Initially cleaned and kept in vacuum at 120 ºC for a day, PEI film (AJEDIUM;100 μm thickness and 35 cm width, RESIN – ULTEM 1000-1000) was tightly rolled around a Teflon rod under a clean pressure flow hood attaining a cylindrical PEI rod of 3 cm in diameter and 20 cm in length. The rolled PEI film and the Teflon rod were introduced into a consolidator (furnace) to fuse the PEI film thermally (i. e. consolidated) above its glass transition temperature, Tg (216 ºC) under vacuum condition at 8 × 10⁻³ torr.
Two heating regimes were applied to obtain a hollow core solid PEI preform. In the first regime, the rolled PEI film and the Teflon were heated to 180 ºC at a rate of 15 ºC min-1 and kept at this temperature for 4 h. In the second regime, the temperature
was increased to 257 ºC at a rate of 2 ºC min-1 and kept in this temperature for 45 minutes to achieve consolidation. Finally, the inner Teflon rod was removed and we obtained a hollow core PEI preform. In order to introduce the V-groove structure, the
41
hollow core preform was mechanically shaped in lathe by rotating the preform at some angle and chipping away the material (Figure 7A). The dimension of the groove on the preform formed by the lathe determines the final fiber dimension. 20 continuous equilateral V-grooves that look like star-shape on the preform surface were structured (Figure 7B, C and D). The same procedure is applied during preparation of PC preform which is identical to the PEI preform. However, PC has Tg of 147 °C which leads to difference in consolidation temperature regime. During the first heating regime, rolled PC film and the Teflon rod were heated to 140 ºC at a rate of 15 ºC min-1 and kept at this temperature for 4 h. In the second regime, the temperature was increased to 186 ºC at a rate of 2 ºC min-1 and kept in this temperature for 30 minutes.
Figure 7: Polymer preform surface modification. (A) Lathe with preform mounted for structuring V-grooves, (B) PEI grooved preform, (C) PC grooved preform, and (D) edge view of PC grooved preform showing V-grooves and hollow core after removing Teflon rod.
42
2.1.2. Preform Drawing
After obtaining V-grooves on the polymer macroscopic preform, the preform was extended to a length of tens of meters, and was scaled down to smaller diameters in the range of micron via thermal fiber drawing. The macroscopic V-grooved preform was fed into a furnace vertically with a constant speed of 8 mm/min. The furnace was heated to a high temperature (approximately 305 ºC for PEI and/or 230 °C for PC preform) and then a load is attached to the end of the preform to induce mechanical stress. The lower part of the preform dropped without rupturing as it soften as seen in Figure 8A. Consequently, fiber of reduced diameter of the initial preform was drawn by adjusting the stress level in the lower region of the using a constant speed motor (Figure 8B).
Figure 8: Fiber drawing scheme. (A) Stretched PC preform during fiber drawing, (B) Fiber drawing tower.
Precise control over temperature and the capstan enables drawing fiber with larger range in diameter. These two parameters can be manipulated and monitored by laser thickness measuring device. Therefore, the fibers have uniform diameter after scaling
43
down it dimension. Fiber with diameter as small as 200 μm was produced by increasing the capstan speed. It is worth noting that the initial shape of the preform with V-grooves was preserved down to micrometer without any interruption and surface damages. After the drawing process, the remaining part of the preform showed the diameter reduction area which appeared to be conical (Figure 9A). PEI fibers with several meters in length and few hundred microns in diameters were produced and rolled in bundle as shown in Figure 9B.
Figure 9: PEI fiber fabricated by thermal drawing method. (A) Photograph of preform after fiber drawing (scale bar: 5 mm). (B) Photograph of drawn microstructured fibers of several meters showing their robustness and flexibility (scale bar: 1 cm).
The surface texture of the microfibers was investigated by using SEM (Figure 10). The image in Figure 10A reveals 20 continuous perfectly aligned equilateral V-grooves on the fibers. It was observed that even after 150 fold size reduction from 3 cm (diameter of the preform) to 200 μm (thinnest fiber produced in this study),
V-44
groove with width of only 30 microns, was preserved. A cross-section of 300 µm fiber with the groove structures that extend along the length of the fiber is illustrated (Figure 10B).
Figure 10: (A) SEM micrograph of a 500 µm diameter and a 200 µm diameter textured polymer fiber showing microscale ordered grooves on their surfaces (scale bar: 100 μm). (B) SEM cross section of ordered micro grooves on textured fibers. Fibers preserve their 20 equilateral V - grooves along their length (scale bar: 50 µm).
To distinguish the effect of geometry of the grooved fibers, fiber with smooth surfaces using a non-structured preform was produced Figure 11. This SEM image shows the smooth surface of the PEI fiber of which surface property varies as explained in the next chapters.
45
Figure 11: Cross-sectional SEM image of smooth PEI fiber with a diameter of 300 µm. (Scale bar: 100 µm).
46
Chapter 3
Modification of Surface Textured
Polymer Fibers for Microfluidic
3.1. Polydopamine (PDA) Coating of PEI Fibers
PEI Fibers were coated with PDA by dipping into dopamine solution in order to make their hydrophobic surface to hydrophilic (Figure 12A). Surface topography images of uncoated and PDA coated smooth fibers indicates the formation of PDA nanoparticles after surface modification (Figure 12B). Chemical structure of the formed polymer (i.e. melanin like polymer synthesized using dopamine, commonly referred as polydopamine (PDA) on the surface of the fibers was investigated using XPS, FT-IR and UV-Vis absorption spectroscopies [128, 129]. Figure 12C shows the carbon 1s XPS spectra of PDA coated and uncoated PEI fibers.
47
Figure 12: PDA coating and characterization. (A) PDA coating is achieved by dipping the fibers into dopamine solution for a determined time (scale bar: 1 cm). (B) AFM micrographs of uncoated and PDA coated fiber surfaces. After surface modification nanoscale roughness is introduced with PDA coating to the fiber surface (scale bar: 1 µm). (C) C1s XPS spectra of uncoated and PDA coated fibers.
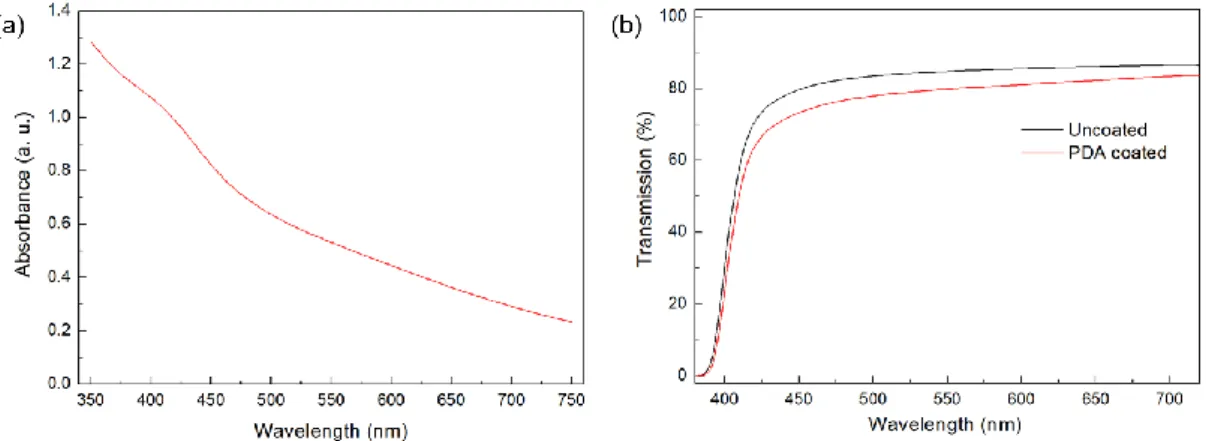
For uncoated fibers, very weak C-O peak was observed. After PDA modification this peak becomes much more intense which suggests the presence of PDA on the surface which is in accordance with previous works [130, 131]. UV-Vis absorption spectra of the 24 h polymerized DA solution shows the typical broad band absorption of PDA (Figure 13a) [131]. The transmission of PEI film significantly reduced after coating with PDA (24 h) due to the broad band light absorption of PDA (Figure 13b).