εΒ ^ ί ^ 9ΙΑΙ îix ci ύ ^ ^λ ζ :.0 }Μ 3Μ Ί^· ' τ "^ Л L W V . ■ .~ >^ _-. i 4ί · τ« ί' ·
-APPLICATION OF AHP TO MULTICRITERIA
INVENTORY CLASSIFICATION
A THESIS
SUBMITTED TO THE FACULTY OF MANAGEMENT AND
GRADUATE SCHOOL OF BUSINESS ADMINISTRATION OF BILKENT UNIVERSITY
IN PARTIAL FULFILLMENT OF THE REQUIREMENTS FOR THE DEGREE OF
MASTER OF BUSINESS ADMINISTRATION
BY
NURAY GÜVENİR SEPTEMBER, 1993
\ л ъ
ι+Ό
. Q U I і Э З
I certify that I have read this thesis and in my opinion it is fully adequate, in scope and quality, as a thesis for the degree of Master of Business Administration.
Assistant Prof. Dr. Erdal Erel
I certify that I have read this thesis and in my opinion it is fully adequate, in scope and quality, as a thesis for the degree of Master of Business Administration.
Assistant Prof. Dr. Selçuk Karabati
I certify that I have read this thesis and in my opinion it is fully adequate, in scope and quality, as a thesis for the degree of Master of Business Administration.
Assistant Prof. Dr. Murat Mercan
Approved for the Graduate School of Business Adminis^ation. ■, i) .
ABSTRACT
APPLICATION OF AHP TO MULTICRITERIA INVENTORY CLASSIFICATION
BY
NURAY Gü v e n ir
SUPERVISOR: ASSISTANT PROF. DR. ERDAL EREL SEPTEMBER 1993
In this thesis, a new method based on the application of Analytic Hierarchy Process (AHP) to ABC inventory classification is investigated. The traditional ABC classification method utilizes only the unit price and the annual usage of inventory items. However, in some cases, the classification done using only these two criteria turns out to be insufficient. The method described in this thesis enables the integration of several criteria that can be organized in a hierarchy into ABC classification.
The method can be summarized as follows: A matrix is constructed by the pairwise comparison of criteria on the highest level. The elements of the eigen vector of this matrix represent the weights (priorities) of the criteria. If a criterion has subcriteria in the hierarchy, the weights computed in the similar manner for the subcriteria are multiplied by the weight of the criterion and inserted in its place. Repetition of these steps for aU levels of the hierarchy, the weight of all criteria are determined.
Using the criteria weights determined by the AHP technique, the weighted score of each inventory item is computed. The items sorted by that weighted score are grouped in three classes: A, B, and C, as in the classical ABC classification.
This new method is applied to the classification of inventory items used in rock excavation jobs done using blasting by a construction company. The same inventory is also classified according to the classical ABC technique, and the results are compared.
Keywords: Inventory management, ABC classification. Analytic Hierarchy Process, multiple criteria
ÖZET
ΑΗΡ TEKNİĞİNİN ÇOK KRİTERLİ ENVANTER SINIFLANDIRMASINA UYGULANMASI
NURAY GÜVENİR
YÜKSEK LİSANS TEZİ, İŞLETME ENSTİTÜSÜ TEZ YÖNETİCİSİ: YRD. DOÇ. DR. ERDAL ER ET.
EYLÜL 1993
Bu çalışmada Analitik Hiyerarşi Süreci (AHS) tekniğinin ABC envanter sınıflandırmasına uygulanması esasına dayanan yeni metot incelenmiştir. Klasik ABC sınıflandırma metodu kriter olarak yalnızca birim fiyat ve yıllık ortalama kullanım değerlerini esas almaktadır. Ancak yalnızca bu iki kritere göre yapılan sınıflandırma bazı durumlarda yetersiz kalmaktadır. Buna karşılık ele alman yeni metot bir hiyerarşi şeklinde organize edilebilmek şartıyla çok sayıda kriterin ABC smıflandırmasmda kullanılmasına olanak vermektedir.
Bu yeni metoda göre önce en üst düzeydeki kriterler ikişer ikişer karşılaştırılarak bir matris oluştumlur. AHS tekniğine göre bu matrisin eigen vektörünün elemanları kriterlerin ağırlık değerlerini verir. Hiyerarşinin alt düzeylerindeki kriterler için de benzer şekilde hesaplanan ağırlıklar üst düzeydeki vektörde karşılık düşen kriterin ağırlık değeri ile çarpılarak bu değerin yerine konur. Bu adunlar hiyerarşinin tüm düzeyleri için tekrarlanarak bütün kriterlerin ağırlık değerleri bulunmuş olur.
AHS tekniği yardımıyla bulunan bu kriter ağırlık değerleri kullanılarak her envanter kaleminin ağırlıklı değeri bulunur. Bu değere göre sıralanan kelemler daha sonra klasik ABC sınıflandırmasında olduğu gibi A, B, ve C olmak üzere üç ayn smıfa yerleştirilir.
Bu yeni metot bir inşaat şirketi tarafından patlayıcı ile yapılan kaya hafriyatında kullanılan malzemelerin smıflandırılmasma uygulanmıştır. Aynı malzemeler ayrıca klasik ABC tekniğine göre de sınıflandırılmış ve sonuçlar karşılaştırılmıştır.
Anahtar sözcükler: Envanter yönetimi, ABC sınıflandırması, Analitik Hiyerarşi Süreci, çoklu kriter
ACKNOWLEDGMENTS
I am grateful to Assistant Prof. Dr. Erdal Erel for his supervision and helpful comments throughout the study. I would also like to express my thanks to Assistant Prof. Dr. Selçuk Karabati and Assistant Prof. Dr. Murat Mercan for reading and commenting on the thesis.
I owe special thanks to Prof. Dr. Kürşat Aydoğan for providing a pleasant environment for study.
I also thank to my husband, H. Altay Güvenir, for his continuous support and encouragement during the preparation of this thesis, especially in the implementation of the MCIC-AHP program.
TABLE OF CONTENTS
ABSTRACT... .
ÖZET... .
ACKNOWLEDGMENTS... ..
TABLE OF CONTENTS... vi
LIST OF TABLES... viii
LIST OF FIGURES...ix
1. INTRODUCTON...1
1.1. A Review of the Related Literature...2
1.2. Scope and Purpose of the Thesis... 5
1.3. Outline of the Thesis...6
2. ABC METHOD FOR INVENTORY CLASSM CATON... .'... 7
2.1. Traditional ABC Classification...9
2.2. Application of the ABC Analysis... 10
3. ΑΝΑΤΥΉΟ HIERARCHY PROCESS... 12
3.1. Hierarchic Design and its Evaluation... 13
3.2. The Pairwise Comparison Matrix... 15
3.2.1. Construction of the Matrix...15
3.2.2. Obtaining the Weights (Priorities) of the Criteria... 16
3.2.3. Consistency of the Matrix... 17
3.3. Application of AHP to Multicriteria ABC Classification...19
4. AN APPLICATION: INVENTORY CLASSIFICATION IN ROCK
EXCAVATION BY BLASTING...21
4.1. Criteria used in the Classification...22
4.2. Multicriteria ABC Classification...24
4.3. Classical ABC Classification and a Comparison... 27
4.4. Sensitivity Analysis... 31
5. SUMMARY AND CONCLUSION...34
APPENDIX 1... 37
APPENDIX n ... 42
The program listing... 55
BIBLIOGRAPHY... 65
LIST OF TABLES
Table 2.1. Ratios of ABC...11
Table 3.1. The fundamental scale...16
Table 3.2. Average Ratio Index values... 18
Table 4.1. Comparison of Multicriteria and Classic ABC classification... 29
Table 4.2. Effects of changes in pairwise comparisons... 32
Fig. 4.1. Criteria hierarchy... 22
Fig. 4.2. Distribution of items in both methods...30
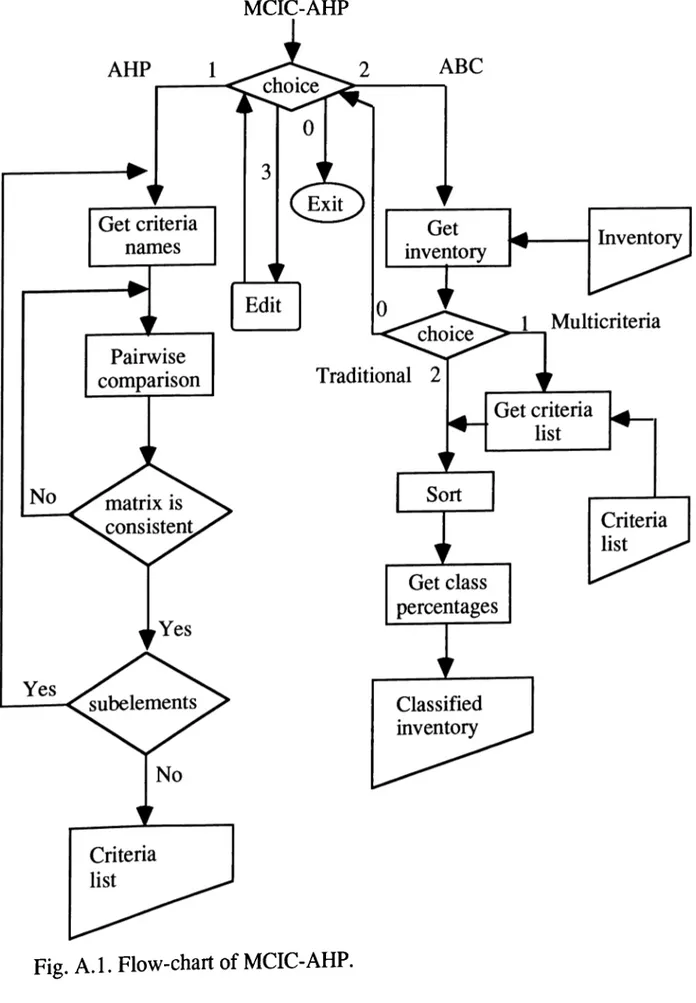
Fig. A .l. Flow-chart of MCIC-AHP... 44
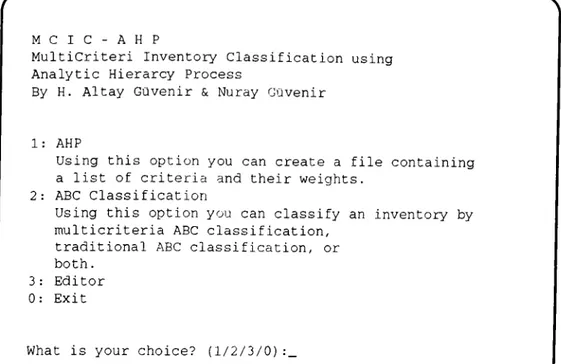
Fig. A.2 The main menu of the MCIC-AHP program... 45
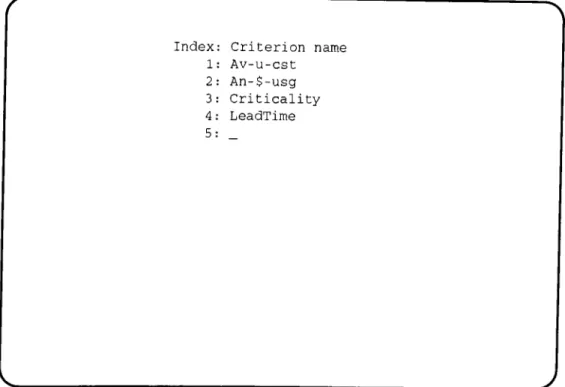
Fig. A.3. AHP first reads the criteria names... 46
Fig. A.4. Pairwise comparison... 47
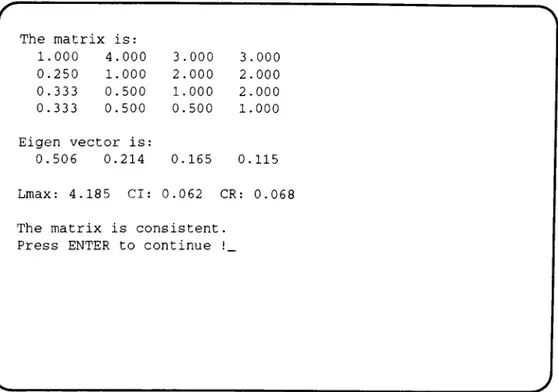
Fig. A.5. A consistent matrix, and its relevant values... 48
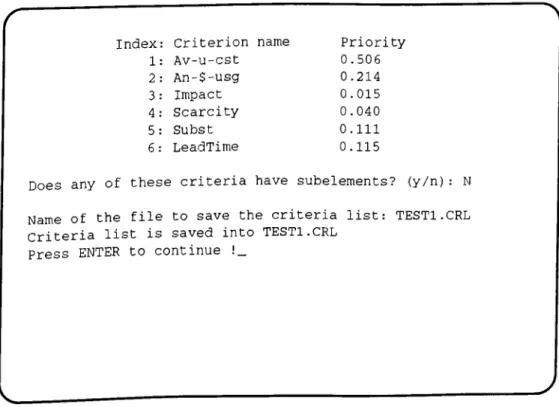
Fig. A.6. The criteria list... 48
Fig. A.7. The criteria list is saved into file TESTl.CRL...49
Fig. A.8. The contents of a criteria file, TESTl.CRL...50
Fig. A.9. The contents of an inventory file TESTİ.INV...50
Fig. A. 10. ABC Classification subprogram...51
Fig. A .l 1. Two types of classification, ara possible... 52
Fig. A. 12. Distribution of items in each class... 52
Fig. A.13. The classified inventory using multicriteria classification...53
Fig. A. 14. The classified inventory using traditional classification... 54
LIST OF FIGURES
1. INTRODUCTION
Inventory management represents one of the most important functions of production and operations management. Inventory managers try to maintain sufficient inventories to meet demand and achieve productivity, while at the same time to incur the lowest possible cost. In the literature, many models and approaches for planning and controlling inventories have been developed [11].
Management and control of inventories consisting of a large number of different items is usually done by classifying inventory items in three groups, called the ABC classification. In the traditional ABC classification, items are classified according to their total annual dollar usage. However, if criteria other than unit price and annual usage are important, managers must decide how to take them into account. Recently, it has been suggested that multiple criteria ABC classification can provide a more comprehensive managerial approach [8].
In the case of multiple criteria, a specific mechanical method is needed to reduce the classification to an ABC grouping. Flores, Olson and Dorai [7] have proposed the use of the Analytic Hierarchy Process (AHP) to reduce these multiple criteria to a univariate and consistent measure to consider multiple inventory management objectives.
1.1. A Review of the Related Literature
Some of the earliest formal work on classification was undertaken by Vilfredo Pareto in the late 1800’s [13]. He claimed that a small percentage of the population of a country creates the majority of its output. Pareto thought that his 80-20 observations were generalizable but was never able to prove definitely that this distribution would hold over all applications.
In the late 1940’s, H. Ford Dickie of General Electric Co. expanded on Pareto’s concept and defined what he called the ABC inventory classification. Since then, classical ABC analysis has found many applications (e.g., [5]).
The classical ABC analysis is a very valuable tool for inventory management. However, there are many cases where the classical method is unsuitable. Therefore several extensions have been proposed and developed to overcome the difficulties arising in such cases.
In 1979, Peterson and Silver [9] recommend that items can be grouped according to whether they are slow (with a low demand, Z), and high per unit cost, v) or fast moving items (with a high demand, D, and low per unit cost, v) in terms of average usage during lead time. Therefore there will not be any difficulties in the analysis of demand during a replenishment lead time.
In 1980, Sarai has extended the classical ABC analysis in two ways [17]. The first extension is the analysis of the items on the basis of their yearly chronological standard values. In this extended analysis, while annual dollar usage (value of the material consumption) is considered as a basis to classify items, relative numbers (cumulated ratio) are formed on the basis of chronological standards.
The other one is the refinement (precision) of the ABC analysis. In this case Sarai has considered some factors over the consumption value which is used in the classical ABC analysis. Those factors can be ranked as follows:
• Conditions of supply
• Conditions of consumption • Storing conditions
• The link between goods (complementary and possibility for substitution)
According to these factors each class has some special criteria that reflect the features of these factors. Items whose characteristics fit these criteria are designed to one of the three classes. With this technique, besides the annual dollar usage, Sarai has considered other factors that are useful for controlling items efficiently. The refinement technique proposed by Sarai has been applied to the classification of construction items by Ozaltm [12].
Classical ABC method may over-emphasize the importance of items that have high annual cost but are not as important to the firm. At the same time, focusing only upon one criterion may under-emphasize low annual cost items that are important. Therefore, use of annual usage only, in some cases, may lead the firm to mismanage its inventory assets.
In 1985, Flores and Whayberk [8] viewed the inventory classification technique from a different perspective by taking into account multiple criteria concept. They first proposed the use of joint criteria matrix to compare criteria pairwise [8]. They proposed the addition of several new criteria to the usual cost-volume criteria for ranking the importance of inventory items.
They pointed out that the importance of the criteria differs in each part of an organization. For example, engineering activities of a firm might deal with the obsolescence criterion. Because of the developments of high technology
items, some parts become obsolete, and they may not be used any more together with new items.
Similarly, one of the most important criteria that can influence the management of inventory in the purchasing area is the lead time. Both the length of lead time and its variability are important in maintaining an adequate supply of an item without excessive costs. The length of the lead time dictates the response time to a crisis. The variability of lead time determines the amount of safety stock, a firm has to supply to provide desired service level.
Substitutability is an important criterion for maintenance department. Substitution potential of items provide flexibility in response the problems by reducing the importance of them relative the less substitute items.
Repairability criterion also carries the similar advantages as the substitutability in terms of flexibility. Another possible criterion in the maintenance field is criticality. This factor is closely related to the idea of stock out costs. A criticality index would be a method of classifying such items for management purposes.
The last criterion they proposed is commonality, which is a measure of the number of possible uses of a component. If an item can be used in many different ways, it might be meaningful to devote extra attention to that item.
After describing the criteria list, Flores and Whybark presented a multiple criteria approach to rank inventory items. However, they did not propose a specific methodology to integrate the utilization of several criteria, and only suggested a mechanical way to reduce the classification to ABC grouping.
Meanwhile, Saaty introduced the AHP in his book published in 1980 [16]. Saaty’s AHP technique assumes that the criteria can be organized in a
hierarchy. The criteria are compared in a pairwise fashion to form a reciprocal square matrix. Then, according to the AHP technique, the eigenvector of the matrix gives the weights (priorities) of the criteria.
The AHP technique was developed in response to corporate and military contingence planning, decision making, the allocation of scarce resources, and to a need for political participation in negotiated agreements. Some applications of AHP include bank strategic planning [1], cost-benefit framework for highway projects[2], and allocation of livers for transplantation [4], and industrial bond rating [18].
Rores, Olson and Dorai [7], in 1992, extended the results of Flores and Whybark, and suggested the use of the Analytic Hierarchy Process (AHP) to integrate the use of several criteria and rank inventory items. They used the AHP technique to reduce these multiple criteria to a univariate and consistent measure to consider multiple inventory management objectives. The methodology used in this thesis is the one proposed by Flores, et. al. in 1992 [7].
1.2. Scope and Purpose of the Thesis
The purpose of the thesis is to determine the criteria that are applied for the classification of inventory items used in rock excavation jobs done by blasting, and apply the multicriteria ABC classification method proposed by Flores et. al in (Flores, 1992). The criteria used in the classification and their relative importance are the views of a civil engineer from the G0R1§ Construction and Engineering Co. Inc. These criteria will be put into a hierarchy first, and then using the AHP technique, these criteria hierarchy will be reduced into one level, and their relative priorities will be computed.
Using these criteria and their priorities, the inventory items used in rock excavation jobs involving explosives and blasting will be classified according to
the ABC classification. Since excavation is a part of most construction projects performed by GiJRl§, the company maintains an inventory of items used in such jobs. These items, equipment, explosives and consumables, are used continuously by GtjRl§. The reason behind choosing only this subset of all inventory is that this particular job requires a variety of items with different properties, which can help to illustrate the effect of multicriteria ABC inventory classification over the classical method.
In order to facilitate the AHP technique and the ABC classification, a computer program has been implemented. The program is called MCIC-AHP for MultiCriteria Inventory Classification using AHP technique. Using this program, it is possible to experiment with the effects of the differences in the relative importance of the criteria on the final classification of the inventory items.
1.3. Outline of the Thesis
The rest of the thesis consists of three main parts, llie second chapter describes the classical ABC inventory classification technique. In that chapter some extensions of the ABC technique to handle multiple criteria will be discussed. The third chapter describes the Analytic Hierarchy Process and its application to the multiple criteria inventory classification. The fourth chapter contains an application and comparison of the methods described above to the inventory classification in rock excavation jobs involving explosives. The final chapter concludes with a summary and an overall evaluation of the methodology proposed by Flores et al. in [7].
Implementation details of the MCIC-AHP are given in the Appendix, and the way it is used is explained through examples.
2. ABC METHOD FOR INVENTORY
CLASSIFICATION
The management of inventory of physical goods is accepted as a significant tool common to all enterprises. Inventories are idle goods or materials that are held for future use. Their importance to the firms stems from two reasons: financial and operational as explained below.
Inventory represents a rmior financial investment for any company and accounts for a large percentage of working capital. For many organizations, the expenses associated with financing and maintaining inventories are a substantial part of the cost of doing business. These costs can include transportation, warehousing, and capital costs.
On the other hand, from an operational perspective, inventories are essential to the successful operation of the organization. Although it is costly to carry inventories in terms of capital tied up, storage space used and insurance required, there are several reasons for keeping inventories. These include protection against variations in demand, maintaining smooth flow of production by decoupling function between stages of production, and lowering total material cost by taking advantage of quantity discounts. In addition, delayed
deliveries increase the risk of shortages. In order to prevent this risk, inventories are kept as “safety stocks.” Especially in countries where the inflation rate is high, inventories can be used as a protector from unexpected increases in material prices [3,6].
Inventories which have a substantial effect on the cost and profit of a firm should be controlled and maintained very carefully. A company can realize substantial savings by employing a rational technique for inventory management.
One of the important issues in designing an inventory control system is the frequency of the assessment of stock on the hand. The other issues are the time and the size of the replenishment order.
Continuous monitoring of inventory levels is a costly process. Equal control effort for all items is not ordinarily justified, or even in some cases it would be incorrect. Therefore, the managers prefer grouping the inventory items in different classes, and applying different level monitoring to each group.
A universal technique for classifying and controlling inventories is the ABC analysis. It identifies and controls inventory items by classifying them into three categories. These categories are labeled A, B and C, respectively, leading to the term ABC analysis. Once the analysis is performed and the categories are determined, the argument is that attention should be concentrated on the “A category” items to maximize effectiveness. The “C category” items are given the least importance. According to Pareto’s famous 80-20 mle, about 20% of the inventory items comprise about 80% of the total annual dollar usage; these items are classified as Class A.
ABC classification provides a means of breaking down the tasks of dealing with suppliers and tracking the materials needed by the operation. Specific staff members can be assigned to deal with A items only, B items only,
or C items only; in this way purchasing department resources can be matched well to the importance of particular inventory items.
Different values of inventory items suggest that one should concentrate on higher valued items and be less concerned about lower valued items. On the other hand, even though an item may by itself be of low value, it is possible that the stock out cost could be substantial [3,6].
2.1. Traditional ABC Classification
ABC inventory classification method is one universal inventory technique for any company and for any kind of manufacturing or service industry [9].
It has long been observed that in most companies a small fraction of the number of items in the inventory accounts for a disproportionately large fraction of purchasing expenditures. This small group of high-value items typically classified as A items. The A items usually account for 5 to 20 percent of the inventory.
In the traditional ABC inventory classification systems, two parameters for each item are used. The first parameter is the average unit cost and the other is the annual demand. For each item the parameter annual dollar usage is computed as the product of the average unit cost and the annual demand. The classification of inventory items is done on the basis of their annual dollar usage. In the ABC classification technique, the number of classes used in the classification is not important. For example, some companies may find it useful to use more than three classes. The important point is that control should provide a substantial value to the company.
In traditional ABC classification, the items are usually grouped as follows.
Class A; This group consists of a large annual dollar usage. The items
with high stock out costs and those which comprise a large fraction of the total inventory fall into this class. The closest control might be reserved for raw materials that are used continuously in extremely high volume. For Class A items, periodic ordering, perhaps on a weakly basis, provides the necessary close surveillance over inventory levels. Plans and forecasts for Class A items should be evaluated frequently.
Class B: While this group consists of items of secondary importance
with low demand and small unit value, they are still important and need intermediate control. The Class B items lay between the Class A and Class C items. These items should be monitored and controlled with periods larger than the periods of Class A items, e.g., biweekly or monthly. Stock out costs for Class B items should be moderate to low, and buffer stocks should provide adequate control for stock-outs.
Class C: This group consists of a small annual dollar usage but a
relatively large percentage of total inventory items. Class C items account for the great bulk of inventory items, and can be controlled carefully but routinely. Attention should be much less frequent for these items, because the safety stock protection is deliberately set high.
Although the traditional ABC classification contains three categories, the number of classification categories can be increased depending upon the working conditions of a company.
2.2. Application of the ABC Analysis
Classical ABC analysis of an inventory is performed in the following steps:
• For each item, demand(typically one year) D , and the present value, v are determined.
• Total annual dollar usage (Dv) is calculated by multiplying D by v.
• All these items are ranked in descending orders in terms of annual dollar usage.
• The percentage of the annual dollar usage (Dv %) and the cumulative percentage of the annual dollar usage is calculated for every item [12].
• These items can be categorized as an A, B, C class with respect to cumulative percents according to the ratios shown in Table 2.1.
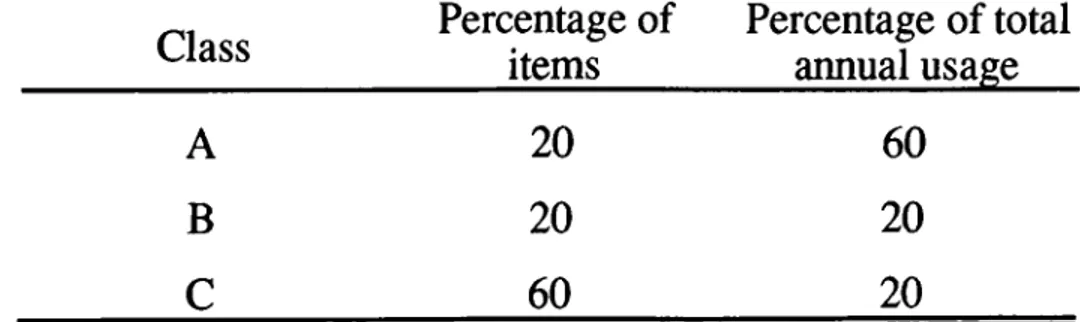
Table 2.1. Ratios of ABC.
Class Percentage ofitems Percentage of totalannual usage
A 20 60
B 20 20
C 60 20
These percentages may change from one organization to another. The principle of separation is very important in management because it allows concentration of management efforts in the areas of highest payoff.
3. ANALYTIC HIERARCHY PROCESS
In this chapter, we describe the Analytic Hierarchy Process (AHP) which will be used in the application of multicriteria to the ABC classification.
AHP is a general theory of measurement. It deals with quantifiable or intangible criteria that have found rich applications in decision theory. The success of the theory is a consequence of its simplicity and robustness [19]. AHP is based on the principle that, to make decisions, experience and knowledge of people is at least as valuable as the data they use. This technique is proposed by Saaty, to provide a methodology for modeling unstructured problems in economic, social and management sciences.
There are four axioms of the theory.
Axiom 1: Reciprocal comparison. The intensity of the preferences of the decision maker must satisfy the reciprocal condition: If A is x times more preferred than B, then B is \/x times more preferred than A.
Axiom 2: Homogeneity. The preference are represented by means of a bounded scale.
Axiom 3: Independence. In expressing preferences, criteria are assumed independent of the properties of the alternatives.
A xiom 4: Expectations. For the purpose of making a decision, the hierarchic structure is assumed to be complete.
It is important to satisfy these axioms in order to successfully apply the AHP technique to a decision making problem.
The next section explains the formation of a hierarchy and its evaluation. Section 3.2 describes how the weights (priorities) of elements are obtained [15]. Section 3.3 presents the methodology proposed by Flores et al. [7] for the application of AHP technique to the multicriteria ABC classification.
3.1. Hierarchic Design and its Evaluation
In making a decision, the most creative task is to choose the factors that are important for that decision. In the AHP technique, these factors are arranged in a hierarchical structure descending from an overall goal to the criteria, subcriteria and alternatives in successive levels [19].
Decision making applications of AHP are formed in two phases: hierarchic design and evaluation. The design of hierarchies requires the expertise and knowledge of the problem area. Two decision makers normally can construct two different hierarchies of the same problem; thus a hierafchy is not unique. On the other hand, even two people design the same hierarchy, their preferences can create different courses of action.
Criteria and subcriteria in a hierarchy serves two purposes. It provides an overall view of the complex relationships inherent in the situation and helps the decision maker assess whether the elements in each level are of the same order
>
of magnitude [14].
Each element in a given level does not have to have subelements in the level below. In addition, a hierarchy should not be considered as a traditional decision tree. Each level may represent a different part of the problem. For example one level may represent social factors whereas another may represent economic factors.
The evaluation phase consists of pairwise comparisons. The elements in a level of the hierarchy are compared in relative terms. This comparison is made according to the importance or contribution of the criterion that is placed above the elements. This process of comparison yields a relative scale of measurement of the priorities or weights of the elements.
The comparisons are performed for the elements in a level with respect to all the elements in the level above. The weights of elements at the bottom level of the hierarchy are obtained by adding all the contributions of the elements in a level with respect to all the elements in the level above. This is known as the principle of hierarchic composition.
To make pairwise comparisons, a decision maker should answer these questions: when two criteria are compared in a given problem, it should be determined that which criteria should be preferred to the another. The results is a matrix of paired comparisons. This process is repeated for the all elements in the level above. This can be accomplished by using the principal right eigenvector of the matrix of paired comparisons [14,19].
AHP is used to derive ratio scales from both discrete and continuous paired com parisons. These comparisons may be taken from actual measurements or from a priority scale. This scale reflects the relative strengths of preferences and feelings.
3.2. The Pairwise Comparison Matrix
The criteria of one level in a hierarchy are compared with each other one by one and the matrix is constmcted.
Let us consider the criteria as C\, C2, ... C„ of some level in a hierarchy.
We wish to find their weights of influence, wi, W2, ... w„ on some element in the
next level.
The matrix represents our subjective judgments about the pairwise comparisons of criteria. The element indicates the relative strength of criterion C; when compared to Cy. Therefore ¿Zy can be written as
% - w] ’ ~ aji ’ i , j = l , . . . , n . 1 Cl A = Ci Cn Cl W\ W\ VVl
Wi
Wi
Wi
CnW\
Wn
Wn
That is, the pairwise comparison matrix is a reciprocal square matrix whose diagonal is equal to 1. The size of the matrix is equal to the number of criteria.
3.2.1. Construction of the Matrix
Since the pairwise comparison is a subjective process, a priority scale is defined to compare two different criteria. This scale reflects the relative strengths of preferences and feelings. The preferences in a scale range from equally preferred to extremely preferred by giving numbers them from one through nine. The scales and their definitions are given in Table 3.1
Table 3.1. The fundamental scale. Intensity of
importance Definition
1 Equal importance
3 Moderate importance of one over another 5 Essential or strong importance
7 Very strong importance 9 Extreme importance
2 ,4 ,6 , 8 Intermediate values between the two adjacent judgments
A pairwise comparison matrix has the feature that the main diagonal consists of I ’s. In other words, each criterion is equally important when compared to itself. In addition, all other elements are reciprocal to the corresponding symmetric element. The rows represent the base factors. That is, if the row factor is less important than the column factor, then the value of the corresponding entry is the reciprocal of the scale given.
3.2.2. Obtaining the Weights (Priorities) of the Criteria
The next step consists of the computation of a vector of priorities from the constructed matrix. According to the AHP methodology, the eigenvector of the comparison matrix with the largest eigenvalue provides the priority ordering, and the eigenvalue is a measure of consistency of the judgment [16].
Computation of the exact Eigen vector of a matrix is complex and costly process. However, there are four approximate methods presented to compute the eigen vector of a matrix by Saaty [16].
1) Sum the elements in each row and normalize by dividing each sum by the total of all the sums, thus the results add up the unity.
2) Take the sum of the elements in each column and form the reciprocals of these sums, and divide each reciprocal by the sum of the reciprocals.
3) Divide the elements of each column by the sum of that column, and then add the elements in each resulting row, then divide this sum by the number of elements in the row.
4) Multiply the n elements in each row, and the take the nth. root. Normalize the resulting numbers.
In our experiments we found that the 3rd method gives the best approximation, which is also observed by Saaty.
3.2.3. Consistency of the Matrix
If our judgment is perfect in all comparisons, then atk = % . ajk for all i j , k and we call the matrix A consistent. Saaty has shown that if the diagonal of a matrix A consists of ones {an =1), and if A is consistent, then small variations of the atj keep the largest eigenvalue, A.max» close to n, and the remaining eigen values close to zero. Therefore, if A is the matrix of pairwise comparison values, in order to find the priority vector, the vector that satisfies Aw = XmaxW^ must be found.
We multiply the matrix of comparisons on the right by the estimated eigenvector obtaining a new vector. If we divide the first component of this vector by the first component of the estimated eigenvector, the second component of the new vector by the second component of the estimated eigenvector, and so on, we obtain another vector. If we take the sum of the components of this vector, and divide by the number of components we get an approximation to the value of Xmax to use in estimating the consistency [16]. The
closer X.max is to Ji (the number of criteria in the matrix) the more consistent is the result.
Deviations from consistency may be represented by
^ a x ~ n
n - l
which is called Consistency Index (C.I.). The consistency index of a randomly generated reciprocal matrix from 1 to 9, with reciprocals forced is called the Random Index (R.I.). At Oak Ridge National Laboratory, Dr. R. Uppuluri generated an average R.I. for matrices of order 1-15 using a sample size of 100. Average R.I. values for sizes 2 to 15 are given in Table 3.2. The R.I. values for sizes 1 and 2 are very close to 0.
Table 3.2. Average Ratio Index values
n 2 3 4 5 6 7 8 9 10 11 12 13 14 15
R.I 0.00 0.58 0.90 1.12 1.24 1.32 1.41 1.45 1.49 1.51 1.48 1.56 1.57 1.59
The ratio of C.I. to the average R.I. for the same size matrix is called the consistency ratio (C.R.). A consistency ratio of 0.10 or less is considered acceptable. Note that, since the average R.I. values are taken as zero for size less than three, the C.R. cannot be computed because of a division by zero error. If C.R. is more than 10% of R.I. then the matrix is considered as inconsistent. In this case, the matrix must be constmcted again with different values.
These comparisons and computations establish the priorities of the criteria of one level of a hierarchy, with respect to one criterion of the one level above. If there are more than two levels, the various priority vectors can be combined into priority matrices, which yield one final priority vector for the bottom level. The element corresponding to a super-ordinate criterion (the one with subcriteria) in the eigenvector is replaced by the elements of the eigen
vector of the subordinate criterion. In this replacement, the elements of the eigenvector of the subordinate are multiplied by the element being replaced. Therefore, the sum of all elements of the eigenvector remains one.
For example, if the eigenvector at the highest level is <wi, W2, ... ...
Wk> and the ith criterion has subcriteria C/i, C/2, ...C,>„, with eigenvector <w/i,
w/2»... Win?', then the resulting eigenvector would be <wi, W2, ..., w/*w/2,
... Wi Wiffi, ...
3.3. Application of AHP to Multicriteria ABC Classification
Hores et al. proposed a methodology to use AHP in multicriteria ABC inventory classification. It is based on classifying each item by a weighted value of the criteria utilized.
According to this methodology, the criteria hierarchy is constmcted first. Then using the AHP technique the weights of each criterion is computed. The next step is to determine the values of each criterion for each inventory item. As the criteria have different units of measure, the measures have to be converted to a common 0-1 scale. Therefore, the values for each criteria are normalized using the following formula:
Fj -F,min
max- F ,min
where F, is the value of the criterion under transformation, Fmaxis the maximum value and Fmin is the minimum value of the criterion under transformation.
Using these normalized criteria values for each item and the criteria weights, the weighted scores of the inventory items are computed. The items are sorted in descending order according to their weighted score values. The ABC classification can be then performed by the cumulative weighted scores. The
A-B and B-C cut-off points are given as percentages of the total weighted score. The items from the top of the list, whose cumulative weighted scores form the A-B percent of the total weighted score are classified as Class A. The items from the top of the list, whose cumulative weighted scores form the B-C percent of the total weighted score, but not classified as Class A are classified as Class B. The remaining items are classified as Class C. That is, the cumulative weighted scores of the Class A items form the A-B percent of the total weighted score. The cumulative weighted scores of the Class B items form the B-C - A-B percent of the total weighted score.
Another way of classification is to use the desired sizes of each group. In this case the percentages of items in each class is given by the user. If, for example, the user wants to have 20% of all inventory in class A, then first 20% of all items with highest weighted scores are assigned to Class A. Class B and C items are classified in the same way.
4. AN APPLICATION: INVENTORY
CLASSIFICATION IN ROCK EXCAVATION BY
BLASTING
This chapter describes the application of multicriteria ABC classification technique described in the previous chapters to the classification of the inventory items used in rock excavation jobs using the blasting technique. The data used here are obtained from the records of the Gi)Rl§ Construction and Engineering Co. Inc.
Rock excavation is one of the conunon tasks performed as a part of a large construction project. Therefore GtjRl§ maintains an inventory of items used for excavation jobs. In this study we have worked on a small but complete portion of the items in the inventory. The portion covered here contains only the items used in the rock excavation done by blasting. The inventory includes items such as equipment, explosives and consumables.
The next section describes the criteria used in the ABC classification. The hierarchy of the criteria and the criteria weights obtained by the application of the AHP technique are also given. Section 4.1 presents the inventory items and their resulting ABC classification. Finally, Section 4.2 applies the classical
ABC classification technique to the same inventory and compares the results with its multicriteria classification.
4.1. Criteria used in the Classification
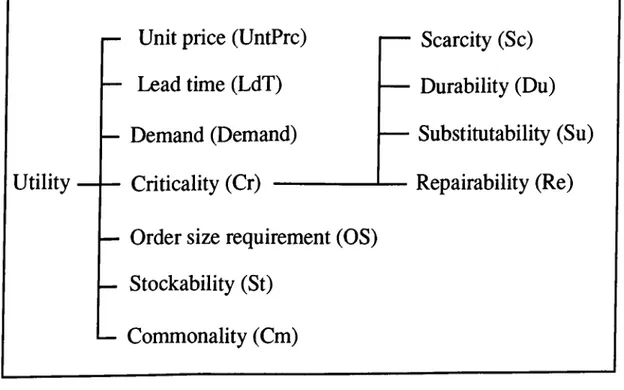
Discussions with the engineers of the GÜRl§ Construction and Engineering Co. Inc. revealed that the main criteria to be utilized in the classification of inventory items used in rock excavation by blasting jobs are unit price, lead time, annual usage (demand), c ritic a lity , order size requirements, stockability and commonality, in decreasing order of importance. The criticality criterion can be further divided into four subelements as scarcity, durability, substitutability, and repairability, in decreasing order of importance. The resulting criteria hierarchy is shown in Fig. 4.1.
Utility
■ Unit price (UntPrc) - Lead time (LdT) — Demand (Demand) ■ Criticality (Cr) ---Scarcity (Sc) Durability (Du) Substitutability (Su) Repairability (Re)
■ Order size requirement (OS) Stockability (St)
— Commonality (Cm)
Fig. 4.1. Criteria hierarchy.
The most important criterion in the classification is the unit price of the items. Unit prices are going to be given in U.S. dollars.
The second most important criterion is the lead time. Since many of the items used in the rock excavation by blasting job are imported from abroad, the length of lead time and its variability become crucial factors. The lead time becomes even more important than the annual usage parameter used in the classical ABC analysis. The lead time is given in days.
Demand (annual usage) takes the third place in the classification. It represents the average consumption of a given item in a period of a year.
Criticality criterion is closely related to the idea of stock-out costs. The criticality of an item depends on four subcriteria: scarcity, dura b ility, substitutability and repairability. These criteria will take on values in the range of 1 to 5.
Scarcity is a degree of the ease in acquiring an item. Scarcity can arise from the purchasing difficulties of an item. Scarcity is an important criterion for items that are imported from abroad. The value of 5 is assigned to scarce items.
Durability indicates the length of time that an item can stay in usable conditions. The existence of expired items in the stock can cause the stock-out costs for the company. For example, the explosive chemicals are not durable items. Usually, they have to be consumed in a few months of time. The durable items will take the value 1 while items with short usage periods will take the value 5.
Some items, when they are out of stock, can be substituted by similar items in the stock. In this case the stock-out cost of such items is less than the other items. The substitutability value of the items that have many substitutes in the inventory (e.g., brass handling rope) is 1, and for those that have no substitutes (e.g., seismic explosives) it is 5.
In case of stock-out, some items can be repaired and re-used. Closely related to the idea of substitutability for items is that of repairability. Repairable items provide a degree of flexibility similar to that of substitutability. The items that can be repaired quickly (e.g., containers and rock drills) will take the value 1 while the items that cannot be repaired (e.g., electrical and chemical items) will take the value 5.
There are three other criteria on the top level as described below. These criteria also take values in the range of 1 to 5.
For some items, a firm has to order a quantity which should not be less than a minimum order size required by suppliers or defined by a firm itself. This criterion can be called as order size requirement. The items with no order size requirements (e.g., anfo mixer and detonating box) takes the value 1, while items with large order size requirements (e.g., ignators and delay elements) take the value 5.
Stockability indicates the difficulty in storing an item. Items that require large space cause a difficulty in storage. The more importantly, for jobs involving blasting, the explosives cause dangers in storage areas. Therefore, explosives are given the value 5 for stockability criterion.
The final criterion used in this analysis is commonality. This is a measure of how many uses there are for an item. If an item is used in many different tasks, it might be important to devote extra attention to it. For example, trucks and screw drivers are items that are used commonly in many tasks; such items will take 5 as their commonality criterion.
4.2. Multicriteria ABC Classification
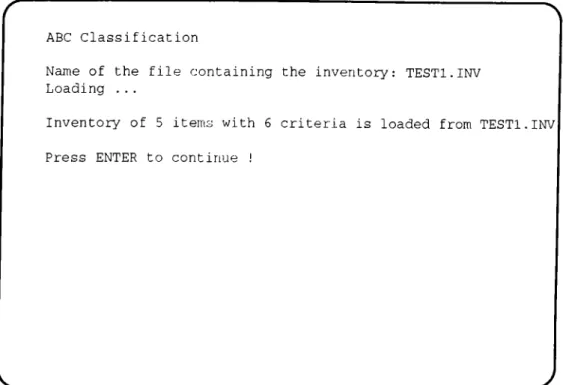
Multicriteria ABC classification of the inventory described in the previous sections of this chapter was done by the MCIC-AHP program
presented in the Appendix. Since the MCIC-AHP program requires that unit price and annual usage (demand) to be the first two criteria, we entered these two in the beginning.
According to the pairwise comparisons of the criteria made by an engineer of the company the following pairwise comparison matrix was constmcted by the MCIC-AHP program.
1JntPrc Demand LdT Cr OS St Cm UntPrc 1 3 2 4 6 7 9 Demand 1/3 1 1/2 1 4 2 7 LdT 1/2 2 1 3 5 6 8 Cr 1/4 1 1/3 1 3 5 6 OS 1/6 1/4 1/5 1/3 1 2 3 St 1/7 1/2 1/6 1/5 1/2 1 2 Cm 1/9 1/7 1/8 1/6 1/3 1/2 1
The Eigen vector of this matrix was computed as <0.358, 0.137, 0.246, 0.134, 0.057, 0.043, 0.025>. Also, Xmax = 7.283, Cl = 0.047, and CR = 0.036. Relations between criteria are given by an engineer from the company as follows: UntPrc > LdT > Demand > Cr > OS > St > Cm in order of importance to the company. After obtaining the weights of criteria, it is seen that the order of priorities are consistent with the above ranking. Since the matrix is consistent, we continued with the criticality criterion. The following matrix for the criticality was found in the similar way.
Sc Du Su Re Sc 1 2 4 6 Du 1/2 1 3 5 Su 1/4 1/3 1 3 Re 1/6 1/5 1/3 1 25
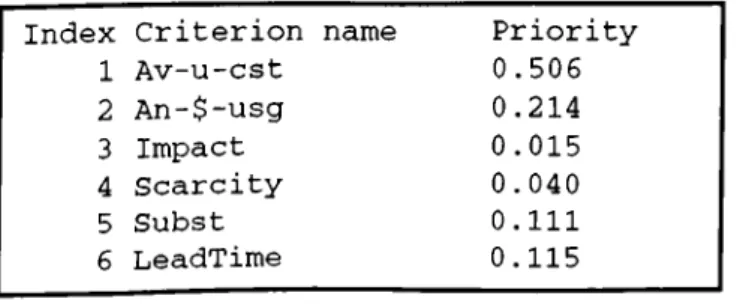
The Eigen vector of this matrix was computed as <0.492, 0.309, 0.136, 0.063>. Also, A^max = 4.080, Cl = 0.027, and CR = 0.029. This matrix is also consistent. The resulting weights (priority) of all criteria are as follows!
Index Criterion Priority
1 UntPrc 0.358 2 Demand 0.137 3 LdT 0.246 4 Sc 0.066 5 Du 0.041 6 Su 0.018 7 Re 0.008 8 OS 0.057 9 St 0.043 10 Cm 0.025
The scores of each item are computed as explained in the previous chapter. For example, the weighted score of the item “A.L.Truck” is calculated as
2-1 0.358 + 0.137 0.018 250000-1 4-1 125000-1 90-1 4-1 2-1 + 0.246 120-1+ 0.066 7-7 + 0.041 # T + 5-1 5-1 5-1 -I- 0.008 I5-1t + 0.057 F T + 0.043 7 T + 0.025 I5-1 5-1 5-1t = 0.5318
Two issues are important in determining the class boundaries. Firstly, we wanted to have the cut-off points in the large gaps between two consecutive scores, in order to have the items with similar score get the same class value. Secondly, we wanted to have about 20% of items in Class A, 20% in Class B and 60% in Class C. Considering these two issues we chose, as the class percentages, 20% for class A and 23.5% for class B. The resulting classification is given in Appendix I.
4.3. Classical ABC Classification and a Comparison
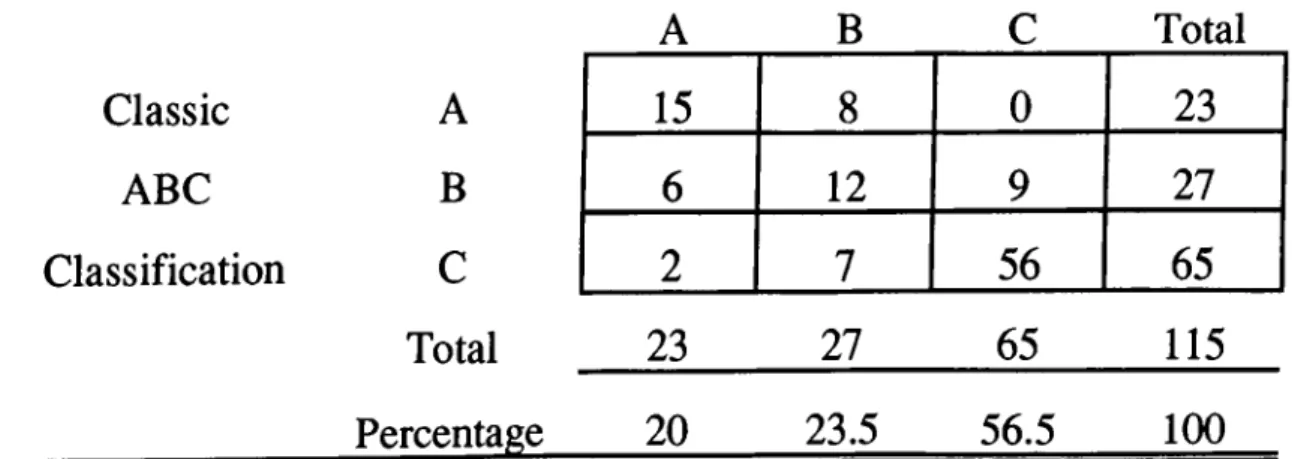
The same inventory is also classified using the classical ABC classification technique, and the results are compared. The items are sorted in decreasing order by their annual dollar usage. The multicriteria classification was resulted in twenty-three A class, twenty-seven B class, and sixty-five C class items. Therefore, in the classical ABC classification, we divided the inventory into the same size groups. The first twenty-three items were classified as Class A, the next twenty-seven items as Class B, and the remaining sixty-five items as Class C. The listing of the inventory classified by the multicriteria and classical ABC analysis is shown in Appendix I. By this comparison we wanted to see the number of items that are classified in different groups by the two method. The differences between the number of items in each class are shown in Table 4.1.
Fifteen items are classified as Class A, twelve items as Class B and fifty- six items as Class C by the both technique. The most important observation from this comparison is that the number of items that are classified as Class A by one method and Class C by the other method is very low, as expected. For example, there are no items that are classified as Class C by the multicriteria classification while Class A by the classical method. On the other hand, there exists only two items which are classified as Class A by the multicriteria classification and as Class C by the classical method. These two items, P.Grinder and Coupling, have relatively long lead times; 100 and 90 days, respectively. Especially demand for P.Grinder is very low. Since the lead time criterion is more important than demand, this item was classified as Class A. In addition these two items are considered as critical in terms of scarcity and durability.
Eight items are classified as Class B by the multicriteria classification while as Class A by the classical ABC analysis. Five of these items have a
relatively short lead time. It should be remembered that the weight of lead time criterion constitute 26.4% of all criteria weights, and the second most important among all criteria. Two items, namely Jel.Dynam and Power.Dyn, have moderately high lead times. But their degree of scarcity is relatively low. This is due to the incorporation of the criticality criteria into the classification. One item, Anf.Mixer, has a relatively high lead time. However, this item does not have to be classified as class A since it is durable and not scarce.
On the other hand six items are classified as Class A by the multicriteria classification and as Class B by the classical method. These items have relatively long lead times and high scarcity values. These two criteria have high weights. Especially the item Nonel.Det is very critical in terms of all subelements of the criticality criterion. The items Bit, Rod and Shank have no substitutes and can not be repaired quickly.
Similarly, multicriteria technique classifies nine of the items as Class C, while the same items are classified as Class B by the classical analysis. Of the nine items that went down to Class C from B, two have moderately long lead times, but not high criticality ratings. Other seven items have short lead times and criticality values. Also note that Delay .El. item is classified as Class C while item C.Hose3/4 as class B; although both items have the same annual dollar usage value. Normally items with the same annual dollar usage value are classified as the same class. However, in this experiment we wanted to have the same number of items in class groups. If after the sorting operation these two items switched their position, they would have been classified in the same class by both techniques.
It is important to note that items Gr.Robot and C.Hose3/4 are classified in different classes while they are classified as Class B by the traditional technique with the same annual dollar usage value. The reason is that, the lead time of Gr. Robot is ten times more than the lead time of C.Hose 3/4. In
addition, for Gr. Robot item, the unit price is relatively more than demand while there is an opposite relation for C Hose 3/4 item. If it is considered that unit price criterion is more important than demand, it is reasonable to assign Gr. Robot to Class A, while C.Hose 3/4 to Class C.
Seven items are classified as Class B by the multicriteria classification and as Class C by the traditional method. For three of these items, lead time and scarcity criteria are effective to move to the higher class. Other four items have high criticality values. Therefore this discrepancy is superficial, and occurs due to the random ordering of items with the same value during the sorting process.
Table 4.1. Comparison of Multicriteria and Classic ABC classification. Multicriteria ABC Classification
A B C Total Classic A 15 8 0 23 ABC B 6 12 9 27 Classification C 2 7 56 65 Total 23 27 65 115 Percentage 20 23.5 56.5 100
As a summary, there are two main reasons for the discrepancies between two classification techniques. Firstly, a long with unit price and annual usage, many other criteria are considered in the multicriteria classification. Secondly, the lead time criterion, which is not considered in the classical analysis, is more effective than the annual usage criterion.
The curves presented in Fig. 4.2 show the distribution of items in each class by the two methods. In multicriteria classification items that fall in Class A (42% of all total weighted cumulative score) constitute the 20% of all items However, in classical ABC analysis, the Class A items constitute 98.8%, and the
Class B items constitute about 1 % of all cumulative annual dollar usage. The item with the highest annual dollar usage, $20,000,000, is emulsion explosive. The total annual dollar usage of the inventory is $83,662,034. That is only the first item constitute the 23.9% of the total inventory. This shows that the classical ABC method with 80-20 rule would fail to classify the items in a meaningful way in this particular inventory.
□ Multicriteria ABC classification o Classical ABC classification Fig. 4.2. Distribution of items in both methods.
The classifications obtained by the two methods were presented to a project manager from the G 0r1§ Construction and Engineering Co. Inc., and he
was asked to compare the results. He indicated that the classification done by the multicriteria ABC analysis was more accurate than the one obtained by the classical method.
4.4. Sensitivity Analysis
We altered some values in the original matrix given in section 4.2 to see whether the weights of all criteria are affected from this change. Firstly, one value which corresponds to the entry of unit price and criticality criterion is changed. In the original matrix, unit price’s relative importance to the criticality is between weakly and essentially more important, which is the value of 4. The value of 3 is assigned to this entry.
1JntPrc Demand LdT Cr OS St Cm UntPrc 1 3 2 3 6 7 9 Demand 1/3 1 1/2 1 4 2 7 LdT 1/2 2 1 3 5 6 8 Cr 1/4 1 1/3 1 3 5 6 OS 1/6 1/4 1/5 1/3 1 2 3 St 1/7 1/2 1/6 1/5 1/2 1 2 Cm 1/9 1/7 1/8 1/6 1/3 1/2 1
The effect of this change onto the criteria weights are shown in the Weights 1 column of the Table 4.2. The weights of the new matrix is close to the original one. However in the new case, the weight of criticality criterion is increased over the demand criterion, while these two criteria are given as equally important in the pairwise comparisons. The reason is that the relative importance of unit price with respect to criticality and demand criteria is the same. Therefore, the small changes in values can change the order of importance of criteria. This changes in the weights has resulted in the small changes in the weighted scores of the items, however, the classification of all items remained the same.
Secondly, the relative comparison values of one criterion with respect to other criteria are rearranged and the changes are given. For example the values
of demand, which is the third important criterion, are changed as 1/3, 2, 3, 3, 6 sequentially. UntPrc Demand LdT Cr OS St Cm 1 1/3 1/2 1/4 1/6 1/7 1/9 3 1 3 1/2 1/3 1/3 1/6 2 1/3 1 1/3 1/5 1/6 1/8 4 2 3 1 1/3 6 3 5 3 1 7 3 6 5 2 1/5 1/2 1 9 6 8 6 3 2 1/6 1/3 1/2 1
According to this change, the weights of all criteria are shown in the weights2 column of Table 4.2. The striking observation in this example is that if the relative importance of demand with respect to any criteria is increased, the weights of criteria will decrease. For example, if the relative importance of demand with respect to stocability is inceased from 2 to 3, the weight of stocability decreases from 0.043 to 0.0040, while the weight of demand criterion increases from 0.137 to 0.139.
Criterion Original weight Weights 1 Weights2
UntPrc 0.358 0.346 0.354 Demand 0.137 0.137 0.139 LdT 0.246 0.250 0.260 Cr 0.134 0.140 0.124 OS 0.057 0.057 0.058 St 0.043 0.043 0.040 Cm 0.025 0.025 0.025 32
The changes in values did not change the order of importance of criteria. This changes in the weights has resulted in the small changes in the weighted scores of the items, however, the classification of all items remained the same, as in the previous case.
We have also experimented with the sensitivity of a change on a criteria value. The last item in the Class A group is the Coupling item. As the criterion to test the sensitivity, we chose the lead time criterion. We found out that in order to change the classification of Coupling item to Class B the lead time value must be dropped from 90 days to 84 days. In this experiment we kept the class percentages the same. For criteria with lower weights, the change in the value required to change the classification will be more.
In order to see the effect of changes in the low priority criteria, we have changed the scarcity value of the same item (Coupling) from 5 (maximum possible value) to 1 (minimum possible value). However this change in the scarcity value was not sufficient to move the Coupling item to Class B. As a conclusion, we can say that a small amount of change in the value of important criteria can change the classification of an item, while change in the value of low priority criteria do not have much effect in the classification.
5. SUMMARY AND CONCLUSION
In this thesis, a new method proposed by Rores et. al, which is based on the application of the Analytic Hierarchy Process (AHP) to ABC inventory classification, has been investigated. The traditional ABC classification method uses only the unit price and the annual usage of inventory items in ranking. However, in some cases, the classification done using only these two criteria turns out to be insufficient. On the other hand, the new method enables the integration of multicriteria into ABC classification. The requirement for the application of AHP is that the criteria must be organized in a hierarchical form.
The method first constructs a matrix by the pairwise comparison of criteria on the highest level. According to the AHP method, the elements of the eigen vector of this matrix represent the weights (priorities) of the criteria. If a criterion has subcriteria in the hierarchy, the weights computed in the similar manner for the subcriteria are multiplied by the weight of the criterion and inserted in its place. By repeating these steps for all levels of the hierarchy, the weight of all criteria are determined. Using the criteria weights determined by the AHP technique, the weighted score of each inventory item is computed. Then, the items sorted by that weighted score are grouped in three classes. A, B, and C, as in the classical ABC classification.
This new method is applied to the classification of inventory items used in rock excavation jobs done using blasting by GURl§, a constmction company. The classification was done by a computer program called MCIC-AHP, which implements the this new method. The inventory contains 115 items including equipment, explosives and consumables. In the classification 10 criteria were used. According to an engineer from the company, unit price was the most important criteria, and lead time was the second most important criteria. Average annual usage (demand) came after lead time. That is lead time, which is not considered by the classical ABC method, was more important than annual usage. In general, we observed that the engineer rated the criteria which is not under control of the company higher than the others.
The same inventory is also classified according to the classical ABC technique, and the results are compared. The most striking observation was that if the classical ABC analysis were employed with 80-20 rule, only one item would be classified as Class A. The next item which has very similar properties had to be classified as Class B. This was due to the fact that explosives have very high price and very high annual usage, and constitute a very large portion of the total annual dollar usage. When the classical ABC analysis was performed using the number of items in each class as that of the multicriteria classification, the number of that changed class was 31 (27%). The resulting classifications were presented to the same engineer, he claimed that the multicriteria classification reflects more closely the way the items should be classified.
An analysis of the sensitivity of the multicriteria classification technique is conducted. In this analysis, we first changes the pairwise comparison value of two criteria by one point. The resulting values of the criteria weights are observed to remain the same. However, when we changed the importance of one criterion with respect to all other criteria in the pairwise comparisons, the order
of the importance has changed slightly. We have also experimented with the effect of change on a criteria value on the classification. About 4% change in the value of an important criterion (lead time) for the bottom most item in the Class A was sufficient to move it from class A to class B. Therefore, if the company can find another means of acquire that item, than it can be considered as Class B, instead of A. On the other hand, 80% change in the value of a low priority criterion (scarcity) for the same item was not sufficient to move to Class B. As a conclusion, a small amount of change in the value of important criteria can change the classification of an item, while change in the value of low priority criteria do not have much effect in the classification.
APPENDIX I
This appendix presents the inventory used in rock excavation jobs done by blasting. The inventory was classified first by the multicriteria ABC classification technique. The same inventory was then classified using the traditional ABC classification technique. Both classifications have been accomplished using the MCIC-AHP program. The output of the program displays the classification of the items, assigned by both techniques.
Here the symbols and their meanings are as follows:
UntPrc: Unit Price Demand: Annual usage LdT: Lead time Sc: Scarcity Du: Durability Su: Substitutability Re: Reparability
OS: Order Size requirement St: Stockability
Cm: Commonality
WtScr: Weighted Score for multicriteria classification M_C: Class value assigned by Multicriteria classification Ann$usg: Annual Dollar Usage for traditional classification T_C: Class value assigned by Traditional classification
IR.Hammers 15000 Ia s.cutter 20000 jNonel.Det ID.J .Hamm. Shank PVC.Pipe Rod LLwire25 3 30 3 3 4 2 2 1 4 0 . 1 8 3 B 2 15 4 2 5 2 2 2 2 0 . 1 6 9 B 4 1 0 0 0 0 90 5 5 5 5 4 2 1 0 . 3 8 1 A 45000 B 40000 B 40000 B 8000 5 90 4 3 4 2 2 2 4 0.325 B 40000 B 250 150 90 5 3 4 4 3 2 2 0.336 A 37500 B 12 3000 7 5 3 3 1 2 1 3 0.138 C 36000 B 300 100 90 5 3 4 4 3 2 2 0.336 A 30000 B 3 10000 4 2 4 2 2 5 2 4 0.157 B 30000 B jWrk.cloth 10 3000 35 2 2 4 4 4 1 2 0.169 B 30000 B iDeton.box 5000 6 60 4 1 5 4 1 2 1 0.213 B 30000 B jAlumin.Pw 4 5000 30 5 5 4 5 4 2 1 0.247 B 20000 B D.H.Plug 5 4000 95 2 4 2 4 4 2 2 0.316 B 20000 B | c .Hammers 10000 2 30 2 2 4 2 1 1 4 0.135 c 20000 B R.Breaker 2500 8 30 2 1 4 2 2 2 2 0.127 c 20000 B S.Helmet 20 1000 7 2 3 4 4 3 2 3 0.122 c 20000 B |Jc.Hammer 3500 5 15 4 2 5 2 3 2 I s .R.drill 5000 3 30 4 1 4 3 4 2 T.P.Cover 28 500 9 2 1 2 1 2 1 1 B .H .rope 24 500 3 2 1 1 4 3 2 L .P .G .Con 120 100 7 2 2 4 3 1 2 G r .Robot 10000 1 100 5 2 4 2 2 3 |c.Hose3/4 10 1000 10 2 2 5 4 4 2 4 0.143 C 1Delay.El. 2 5000 10 3 5 5 5 5 2 1 0.192 B 10000 C iLight.F.S 4500 2 30 4 2 5 4 1 1 2 0.156 B 9000 C I Int.Steel 150 60 7 2 1 4 4 3 1 1 0.077 c 9000 C I C.Hose.l 15 600 10 2 2 5 4 4 2 4 0.142 c 9000 C Coupling 75 120 90 5 3 4 4 3 2 2 0.336 A 9000 C Tape 2 4000 1 1 4 3 4 3 2 5 0.114 C 8000 C U.W.Carr. 250 30 8 2 2 3 2 3 2 4 0.111 C 7500 C 39