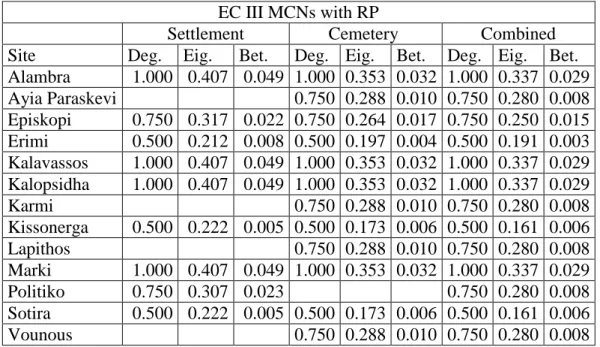
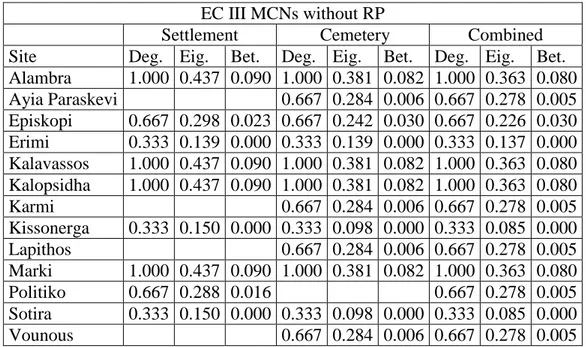
Middle Bronze Age Cyprus inter-site relationships: a social network analysis approach
Tam metin
Şekil
Benzer Belgeler
Şekil 2’ye göre, IFRS taksonomileri, işletmelerin finansal raporlarında yer alan bilgilerinin etiketlenmesinde kullanılmaktadır. Bu etiketleme işlevi ile birlikte
Since we observed that activin A inhibited and mitogenic cytokines induced the colony- forming activity of K562 cells by activating p38 MAPK and deactivating p38 MAPK, respec-
öte yandan sultan~ n, Eyyûloi ailesinin geni~~ imkanlar~ ndan yararlanmas~, ad~ m ad~m gerçekle~en ba~~ms~zl~ k hareketinin, onun genel menfaatlerini ve merkezini
At high coverage of TM atoms, ferromagnetic silicon nanowires become metallic for both spin directions with high magnetic moment and may have also significant spin polarization at
Among other findings, we identify two nodes (representing patient and physician) are as the most important people in the network in terms of structural analysis
Thus, supply chain networks that include flows in the reverse direction should be designed by integrating forward and reverse logistics activities.. The models introduced
We focus on three aspects of short-term capital inflows: (1) short-term foreign credits obtained by the banking sector, and inflows due to (2) security sales of residents abroad,
OBJECTIVE: In the present study, we aimed to compare serum irisin levels in patients with fibromyalgia syndrome (FMS) and healthy control subjects and also investigate
