Mass Spectrometry Using Nanomechanical Systems: Beyond the
Point-Mass Approximation
John E. Sader,
*
,†,‡M. Selim Hanay,
‡,§Adam P. Neumann,
‡and Michael L. Roukes
‡†ARC Centre of Excellence in Exciton Science, School of Mathematics and Statistics, The University of Melbourne, Victoria 3010,
Australia
‡Kavli Nanoscience Institute and Departments of Physics & Applied Physics and Biological Engineering, California Institute of
Technology, Pasadena, California 91125, United States
§Department of Mechanical Engineering and National Nanotechnology Research Center (UNAM), Bilkent University, Ankara 06800,
Turkey
*
S Supporting InformationABSTRACT: The mass measurement of single molecules, in real time, is performed routinely using resonant nanomechanical devices. This approach models the molecules as point particles. A recent development now allows the spatial extent (and, indeed, image) of the adsorbate to be characterized using multimode measurements (Hanay, M. S., et al. Nature Nanotechnol., 10, 2015, pp 339−344). This “inertial imaging” capability is achieved through virtual re-engineering of the resonator’s vibrating modes, by linear superposition of their measured frequency shifts. Here, we present a complementary and simplified methodology for the analysis of these inertial imaging measurements that exhibits similar performance while streamlining implementation. This develop-ment, together with the software that we provide, enables the broad implementation of inertial imaging that opens the door to a range of novel characterization studies of nanoscale adsorbates.
KEYWORDS: Nanomechanical systems, mass spectrometry, inertial imaging, frequency-shift detection
N
anomechanical resonators can be used as fast and sensitive mass balances due to their small mass, high vibrational frequencies, and low intrinsic energy dissipation.1−10 The strong dependence of mass responsivity on device size has driven the development of a new type of mass spectrometer based on inertial mass sensing using nanoelectromechanical systems (NEMS).8,9 This technology enables very precise measurements particularly for high molecular weight bio-materials. Measurements to date include the weighing of individual proteins, metal nanoparticles, and large biomolecules and the demonstration of mass sensing with near atomic scale mass resolution.11−14The above-mentioned measurements use the property that the resonant frequency of a nanomechanical device is directly related to its inertial mass. Increasing the device’s inertial mass, via mass adsorption on its surface, reduces the resonant frequencies of its vibrating modes in a deterministic fashion. Central to all such measurements of adsorbed mass is a theoretical model enabling conversion of the observed frequency shifts to an added (adsorbed) mass. The most common approach is to approximate the adsorbate by a point mass. This leads to the well-known result for a one-dimensional elastic beam: δ ϕ ≈ − f f m M x 2 ( ) n n n added device 2 (1)
where δfn is the change in resonant frequency of the device upon mass adsorption, fn is the resonant frequency of the device without the adsorbate, madded is the adsorbed mass at
position x, Mdeviceis the device mass, and ϕn(x) is the scaled
displacement mode shape of mode n; this formula is valid for madded≪ Mdevice.Eq 1shows that the frequency shift depends not only on the adsorbed mass but also on its position because ϕn(x) varies spatially in general; without knowledge of this
position, the adsorbed mass cannot be determined. However, use of two (or more) modes can disentangle this ambiguity, leading to simultaneous determination of the adsorbate’s position and mass;9,10 at least three modes are required for a cantilever beam. Despite the demonstrated success of this so-called “two-mode theory”, data pertaining to the adsorbate’s shape is absent in all such point particle analyses.
Recently, a methodology was proposed that discards the point particle approximation and allows the spatial distribution of the adsorbate’s mass density to be measured, i.e., an “inertial
Received: October 7, 2017
Revised: January 13, 2018
Published: January 25, 2018
pubs.acs.org/NanoLett
Cite This:Nano Lett. 2018, 18, 1608−1614
Downloaded via BILKENT UNIV on February 25, 2019 at 08:13:07 (UTC).
image” of the adsorbate is obtained.15 This inertial imaging methodology uses the property that within all the measured fractional frequency shifts,δfn/fn, lie untapped information on
the adsorbate’s shape. By linearly superposing the measured frequency shifts, the square of the device’s vibrating modes are virtually re-engineered to yieldflat (constant), linear, parabolic, cubic, etc. spatial dependencies. This virtual re-engineering enables all moments of the analyte’s mass distribution to be measured simply by adding constant multiples of the observed fractional frequency shifts of several device modes. That is, the mass, position, variance, skewness, etc. of the adsorbate’s mass density distribution are determined simultaneously. This“linear superposition” approach was proposed and demonstrated in ref 15 using both synthetic numerical data and experimental measurements of liquid droplets deposited on a microcantilever in air (Figure 1).
Critically, the spatial resolution of this inertial imaging technique is limited by uncertainty (noise) in the measured frequency shifts, not the spatial wavelength of the vibrating modes, i.e., diffraction-like phenomena play no role. Theoretical projections show that with frequency noise levels in current NEMS devices, simultaneous mass measurement and imaging with molecular-scale resolution is possible. The methodology presented in ref15involves a numerical algorithm to perform the required virtual mode re-engineering and iteratively determine the measurement zone (i.e., the spatial region of the device) over which the moments are to be determined. Because this approach requires some computational analysis, it is desirable to simplify its underlying theoretical framework to enable its general use.
Here, we develop such a complementary theoretical framework for measuring the mass distribution of an analyte adsorbed to a resonating nanomechanical device. Rather than relying on linear mode superposition to virtually re-engineer the mode shapes and, thus, determine the required moments of the mass distribution,15we directly determine the moments of the mass distribution using a nonlinear analytical formula; the requirement to determine a measurement zone is also eliminated. Formulas for both one- and two-dimensional devices are presented. These formulas are simple and can be employed using standard packages such as Mathematica and Matlab; Wolfram CDF Player apps are available from the authors, screen shots of which are provided in theSupporting Information for cantilever and doubly clamped beams. The
formulas are derived using a local (asymptotic) expansion of the mass distribution, whereas the linear superposition approach of ref 15 uses a global approach of linearly superposing the mode shapes over a finite region; these frameworks present complementary approaches for interpreting multimode NEMS mass adsorption data.
We examine the performance of the new nonlinear formulas using both numerical (synthetic) data and the above-mentioned published experimental measurements15 and contrast them with the properties of the linear superposition theory. Strikingly, both theories exhibit similar properties and depend-encies on frequency noise, i.e., their spatial resolutions are identical. In fact, these complementary theories present an inverse set of relations in the limit of small particle size, as we shall discuss. We show that the two-mode theory outlined above, which implements a point-mass approximation, is simply a subset of this general nonlinear theoretical formula. The one-and two-dimensional formulas are applicable to beam one-and plate resonators, respectively, under arbitrary boundary conditions; they can therefore be used to analyze a multitude of measurement configurations. The number of modes required to determine the moments is also explored.
Theory. We first consider a one-dimensional elastic beam resonator. The leading-order expression for the fractional frequency shift of this resonator with an adsorbate mass, madded, that is far smaller than that of the resonator, Mdevice, is:
∫
δ μ ϕ = − f f M x x x 1 2 ( ) ( )d n n L n device 0 1D 2 (2)whereμ1D(x) is the linear mass density of the adsorbate, L is
the device length and the scaled displacement mode shapes,ϕn,
form an orthonormal basis set, i.e.,
∫
Lϕ ϕm ndx=Lδmn0 , where
δmnis the Kroneckerδ function.
We expand ϕn2(x) in its Taylor series about the
center-of-mass (position) of the adsorbate, x̅, and substitute the result intoeq 2, giving:
∫
∫
∫
δ ϕ μ ϕ μ ϕ μ = − ̅ + ∂ ∂ − ̅ + ∂ ∂ − ̅ + = ̅ = ̅ ⎡ ⎣ ⎢ ⎢ ⎤ ⎦ ⎥ ⎥ f f M x x x x x x x x x x x x dx 1 2 ( ) ( )d ( )( )d ( )( ) 2 ... n n n L n x x L n x x L device 2 0 1D 2 0 1D 2 2 2 0 1D 2 (3)Knowledge of the position, x̅, is not required yet; it is determined from measurements of the fractional frequency shifts of multiple modes using the resulting formula (see below). Importantly, the second integral in eq 3 vanishes because it is the difference of the first moment with itself. This gives the required result:
∑
δ ϕ ϕ = − ̅ + ! ∂ ∂ ⟨ ⟩ = ∞ = ̅ ⎧ ⎨ ⎪ ⎩⎪ ⎫ ⎬ ⎪ ⎭⎪ f f m M x p x x 2 ( ) 1 n n n p p n p x x p added device 2 2 2 (4)where maddedis the adsorbate’s mass and the central moments are defined as thus:
Figure 1.Optical image for droplets deposited on a microcantilever using AFM dip-pen lithography to generate samples with known mass, mean position, extent, and skewness. After each droplet deposition, the frequency shifts in the cantilever modes were measured. The analysis of mechanical frequency shifts yielded the spatial properties of deposited droplets in ref 15. A simplified theoretical approach is
presented here to obtain the spatial properties of the same analytes. Cantilever dimensions are 397μm long, 29 μm wide, and 2 μm thick. Figure is taken from ref15and replicated here.
∫
μ ⟨ ⟩ ≡x − ̅ m x x x x 1 ( )( ) d p L p added 0 1D (5)Eq 4 enables the central moments, ⟨xp⟩, of the adsorbate’s mass distribution to be determined from the measured
fractional frequency shifts, δfn/fn, of multiple modes. The corresponding result for a two-dimensional structure, e.g., an elastic membrane, is obtained in an analogous fashion, yielding the required formula:
∑ ∑
δ = − Φ ̅ ̅ + ⟨ ⟩ − ! ! ∂ Φ ∂ ∂ = ∞ = − − = ̅ ̅ ⎧ ⎨ ⎪ ⎩⎪ ⎛ ⎝ ⎜ ⎜ ⎞ ⎠ ⎟ ⎟ ⎫ ⎬ ⎪ ⎭⎪ f f m M x y x y p j j x y 2 ( , ) ( ) n n n p j p p j j p n p j j x y x y added device 2 2 0 2 ( , ) ( , ) (6)where (x,y) is the Cartesian coordinate system in the plane of the structure, (x̅,y̅) is the adsorbate’s center of mass, and the two-dimensional moments are
∫
μ ⟨x y ⟩ ≡ − ̅ − ̅ m x y x x y y S 1 ( , )( ) ( ) d p q S p q added 2D (7)whereasμ2D(x,y) is the areal mass density distribution of the
adsorbate and the region of integration is the structure’s surface area, S. The scaled displacement mode shapesΦn(x, y) ineq 6
form the orthonormal basis set,∫SΦmΦndS= Sδmn.Eq 6allows the determination of the central moments, ⟨xpyq⟩, of a two-dimensional adsorbed mass distribution from the measured fractional frequency shifts of multiple modes of a two-dimensional mechanical resonator.
As mentioned previously, eqs 4 and 6 apply to all one-dimensional and two-one-dimensional resonators, regardless of their boundary conditions, such as cantilevered and simply supported beams, square plates, etc. The mode shapes intrinsically embody the structure’s boundary conditions. We now discuss some features and practicalities of the above nonlinear formulas, eqs 4 and 6, for inertial imaging using nanomechanical devices.
Number of Modes. Eqs 4 and 6 can be implemented in practice by truncating their infinite series and solving for the unknown moments using a numerical rootfinding procedure. Numerical solutions of eqs4and6are easily found using built-in functions of standard packages such as Mathematica and Matlab, e.g., using Newton’s method. Importantly, the number of required moments of the mass distribution specifies the number modes that need to be measured. For example, to measure the variance of a (1D) mass attached to a beam resonator requires at least three modes because its specification involves the three lowest moments of the distribution. We discuss the convergence of the moments with increasing mode number below. We focus on the one-dimensional resonator formula,eq 4, because (i) these structures are widely used1−8 and (ii) the properties of this formula are identical toeq 6for two-dimensional structures.
Two-Mode (Point-Mass) Theory. The two-mode theory,eq 1for a one-dimensional elastic beam, is clearly a subset of the general formula,eq 4; the latter includes all moments of the adsorbate’s mass distribution. The two-mode theory is obtained by truncating this general formula to include only the zeroth andfirst-order moments of the mass distribution, in line with the methodology described above. The use ofeq 4, rather than eq 1, enables higher-order moments to be evaluated using the same methodology as the two-mode theory through the systematic inclusion of higher-order terms in the expansion.
Central Moments. Another feature of the nonlinear formulas for one-dimensional and two-dimensional structures is that the moments are specified about the mean position of the
adsorbate’s mass distribution. This contrasts to the linear superposition theory reported in ref 15 that evaluates the moments about a (user-specified and fixed) reference point on the device, e.g., the clamped position of a cantilever beam. The required central moments, about the center of mass of the adsorbate, are subsequently determined by combining these fixed-reference-point moments. The present formulation eliminates this requirement because the central moments are evaluated directly; see eqs4 and6. As we shall see, this does not affect the final result (and its uncertainty), but direct determination of the central moments does simplify analysis.
Convergence. While eqs4and6use an (asymptotic) Taylor expansion of the mode shape squared, they are expected to converge with increasing mode number, regardless of the spatial extent of the mass distribution. This is because the mode shapes can be expressed in terms of elementary functions such as trigonometric and hyperbolic functions. That is, exponential functions whose Taylor expansions are themselves uniformly convergent for all values of their arguments, i.e., they are entire functions. This convergence can be proved for one-dimensional devices by performing a ratio test for the series ineq 4(see the Supporting Information).
Eqs4and6and linear superposition theory are both derived from eq 2, albeit using different assumptions. The linear superposition theory takes a global approach of virtually re-engineering the modes over afinite spatial domain of the device to obtain the required weights for each moment. In contrast, eqs 4 and 6 locally expand the device modes about the adsorbate’s center-of-mass using Taylor expansions. In the limit of small adsorbate size, both formulations are expected to yield identical results; this is observed in the numerical results reported later.
Moreover, eqs4and6express the fractional frequency shifts in terms of the adsorbate’s moments, whereas linear super-position theory presents the inverse relation: moments as a function of the fractional frequency shifts. These comple-mentary theories therefore present a set of inverse functions. Indeed, a Taylor expansion can be used to formulate linear superposition theory in the limit of small adsorbate size; see the Supplementary Section 5 of ref15.
Results and Discussion. We now assess the utility ofeq 4for recovering the moments of an adsorbate’s mass distribution. This is first performed by generating (synthetic) numerical frequency shift data fromeq 2for a specified mass distribution and then recovering the moments of this distribution usingeq 4. Second, we reanalyze the experimentally measured frequency shift data reported in ref15usingeq 4and compare its results to those of the linear superposition method.15 The one-dimensional resonator considered here is a cantilevered elastic beam and we use its lowest-orderflexural modes of vibration in the analysis.
Synthetic Data. The adsorbate’s mass distribution chosen for this analysis is illustrated in Figure 2. It consists of two
individual rectangular distributions of different magnitude, leading to an overall skewed distribution. The width of each rectangular distribution is the same, while the overall width,ϵ, of the adsorbed mass is varied. This enables the assessment of the robustness of eq 4 in recovering the required central moments as a function of the width of the adsorbate. The cantilever length, L, scales all distances.
Wefirst examine the performance ofeq 4using data for the lowest four flexural modes of the cantilever beam. This approach is identical to the measurement analysis reported in ref 15 and allows the robustness of using a fixed number of modes to be assessed; the exact moments of the adsorbate’s mass distribution are known in the present case.
Table 1gives a comparison of (i) the recovered mass (zeroth moment), center of mass (position), variance, and skewness of the sample mass distribution using eq 4, and (ii) the exact moments, as a function of its overall width,ϵ, which is varied from ϵ = 0.01 to 0.3. The largest value of ϵ is an adsorbate whose spatial extent covers 30% of the device. The results in Table 1show that mass, position, and variance are all recovered accurately, with the error ineq 4growing asϵ increases. This rise in error is expected because eq 4 is based on a Taylor expansion about the adsorbate’s center of mass. It is striking that despite this asymptotic approach, eq 4 is robust in
recovering these low-order moments, even for the largest value ofϵ = 0.3. Skewness is also captured accurately for the smallest ϵ but fails for larger spatial extents. This decrease in accuracy with increasing adsorbate size is enhanced for the higher-order moments, as expected due to the asymptotic nature of eq 4. Nonetheless, the reduction in accuracy can be overcome by using more beam modes, which is now explored.
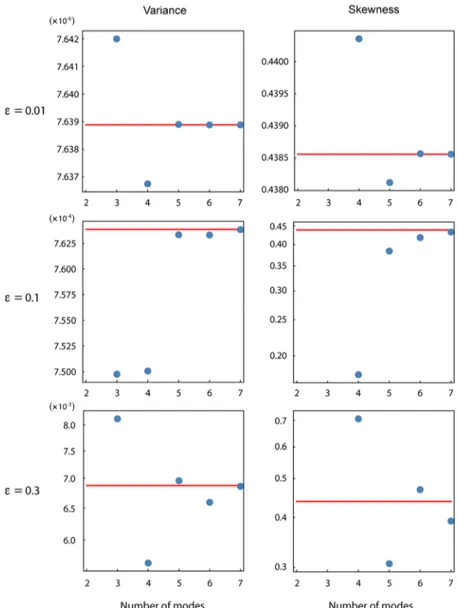
Results for the moments as a function of the number of modes are given in Figures3and4.Figure 3shows thefirst two moments of the mass distributions recovered using eq 4 and those obtained directly from the distribution (the exact values); Figure 4 gives corresponding results for the variance and skewness. Critically, determination of the pthmoment usingeq
4requires use of at least p mechanical modes. As such, results for the higher-order moments do not exist when a smaller number of modes are used; seeFigure 4. While a minimum of three modes are required (in general) to unequivocally determine the position of an adsorbate using a cantilever, results for two modes are also shown for completeness; any ambiguity in the solution is removed here because the exact solution is known.
Recovered moments for the narrowest mass distribution (ϵ = 0.01) are given in thefirst row of Figures3and4. Note that as the number of modes is increased, the moments determined usingeq 4 systematically approach their exact values. Indeed, accurate results for all the presented moments are found regardless of the number of modes used. This is because the spatial extent of the adsorbate is only 1% of the total length of the device, ensuring that the Taylor expansion in eq 2 converges rapidly.Eq 4is thus ideally suited to measuring the moments of adsorbates whose sizes are much smaller than that of the device; this is particularly advantageous when exploring the ultimate limits of sensitivity of the technique.15We remind the reader that inertial imaging is independent of any wavelength-dependent phenomena; this feature is illustrated here with the adsorbate size being one to two orders-of-magnitude smaller than spatial wavelengths of the beam modes. The second and third rows of Figures3and4show that rates of convergence to the exact solutions decrease with increasing ϵ, i.e., more modes are required. For the largest spatial extent, ϵ = 0.3, the moments recovered usingeq 4oscillate about their exact values and even using 7 modes does not achieve convergence in highest-order moment, i.e., the skewness. While increasing the number of modes will in principle lead to convergence (see above), a large number of modes may be required and truncation error may provide a limitation in practice (see discussion above). This limitation is in addition to obvious practical issues involved in measuring many modes of a real device. This shows that the number of modes used in inertial imaging should be systematically increased until convergence is achieved in the required moments. If
Figure 2.1D mass density distribution of a sample adsorbate on an elastic beam. The adsorbate’s spatial extent (width) is ϵ, and the adsorbate is formed from two rectangular density distributions of equal width that differ in magnitude by a factor of 2. The lower boundary of the adsorbate is positioned at x = 0.7, and its overall width isϵ = 0.1. The spatial coordinate is scaled by the device length, L, whereas the mass distribution is scaled by its maximum value,μ0.
Table 1. Accuracy of Eq 4 in the Recovery of the Moments of a Specified Mass Distribution (Illustrated in Figure 2)a
width,ϵ mass center of mass variance skewness
0.01 7.50× 10⁻³(0.00%) 0.704 (0.00%) 7.64× 10⁻⁶(−0.03%) 0.440 (0.41%)
0.03 2.25× 10⁻²(0.00%) 0.712 (0.00%) 6.86× 10⁻⁵(−0.23%) 0.429 (−2.20%) 0.07 5.25× 10⁻²(0.02%) 0.729 (−0.01%) 3.70× 10⁻⁴(−1.10%) 0.335 (−24.0%)
0.1 7.51× 10⁻²(0.11%) 0.741 (−0.04%) 7.50× 10⁻⁴(−1.80%) 0.178 (−59.0%)
0.3 0.217 (−3.60%) 0.837 (1.40%) 5.67× 10⁻³(−18.0%) 0.706 (61.0%)
aRecovered moments are reported; percentage error relative to the exact result is in parentheses. Frequency shift data for the lowest fourflexural
modes of a cantilever beam is generated usingeq 2. Recovered mass (second column) is scaled byμ0L; seeFigure 2.
convergence does not occur using the available modes, the recovered moments may not be accurate. This is expected to be an issue only for adsorbates whose spatial extent is a large fraction of the device size. In theSupporting Information, we present an approach to estimate the number of modes needed as a function of the geometric moment to be calculated and the spatial extent of the analyte.
Experimental Data. We now reanalyze the experimental data shown inFigure 1and reported in ref15for liquid droplet arrays deposited on a microcantilever using dip pen lithography. Supplementary Tables 1 and 2 of ref 15 report numerical data for the measured resonant frequencies of the lowest four flexural modes of the cantilever, and their uncertainties (based on a 95% confidence interval). A total of six cantilever and droplet configurations are reported: the unloaded cantilever and five droplet arrays. In ref 15, linear superposition theory (discussed above) was used to recover the mass, position, variance, and skewness of the droplets arrays, with the measured frequency shift noise used to determine uncertainties in the measured moments. This published (linear superposition theory) data set is now compared to the same moments recovered with the nonlinear formula,eq 4.
Table 2presents numerical results for the measured variances of the droplet arrays usingeq 4and those obtained using the
linear superposition theory. We refrain from presenting results for the mass and position because they exhibit similar agreement to the data in Table 2. This comparison shows that numerical values for the recovered variances are nearly identical using these two complementary approaches. Even more striking is the uncertainties in the variances due to the measured frequency noise of each mode: the two theoretical frameworks give virtually identical results. While there are some minor differences, especially for the droplet distributions of greater spatial extent, this comparison shows thateq 4can be used with confidence to recover the spatial extent (variance) of an adsorbate. This finding is also consistent with above observations regarding the applicability ofeq 4to adsorbates of finite extent: whileeq 4is derived using an asymptotic Taylor expansion, it is expected to hold for adsorbates of arbitrary size, provided that a sufficient number of modes are used to verify convergence.
The right-most column of Table 2 gives the measured variance using only the first three modes. Comparing these results to those obtained using four modes (second right-most column) shows that convergence is weaker for adsorbates of larger spatial extent (size increases down the table). Nonethe-less, it is clear that convergence in the measured variances as a
Figure 3.Adsorbed mass and position of sample adsorbate in Figure 2, recovered usingeq 4as a function of number of modes and spatial extent of adsorbate (ϵ = 0.01, 0.1, 0.3). Exact solutions are shown as red horizontal lines. Mass distribution is given in Figure 2.
function of mode number is indeed achieved. Similar results are found for the linear superposition approach (data not shown). Experimental Skewness Data. Because more than four modes were not measured in ref 15, an assessment of the convergence of the results for skewness with mode number cannot be made. However, Figure 4 clearly shows that increasing the spatial extent of the adsorbate reduces the rate of convergence with increasing mode number. Thus, results for the droplet array consisting of two rows are expected to be more accurate than other arrays; wefind nearly identical results
using linear superposition andeq 4, with their results differing by less than 1% (data not shown). This agreement decreases with increasing spatial extent of the adsorbate. For the asymmetric droplet array, linear superposition theory gives a value of −0.453,15 whereas the optically measured value is −0.537; eq 4predicts a value of −0.695, which is consistent with these results. We refrain from analyzing this data further because its convergence, as a function of mode number, cannot be assessed.
Figure 4.As for Figure 3 but for the variance and skewness of the mass distribution.
Table 2. Measured Normalized Variance of the Droplet Arrays of Ref15a
eq 4
droplet array linear superposition four modes three modes
two rows 5.35× 10⁻⁴(±38%) 5.32× 10⁻⁴(±34%) 5.33× 10⁻⁴(±31%)
three rows 1.60× 10⁻³(±6.9%) 1.56× 10⁻³(±6.5%) 1.48× 10⁻³(±4.8%)
four rows 2.92× 10⁻³(±1.4%) 2.79× 10⁻³(±1.2%) 2.81× 10⁻³(±0.74%)
five rows 4.33× 10⁻³(±0.39%) 3.87× 10⁻³(±0.36%) 4.12× 10⁻³(±0.34%) asymmetric rows 5.21× 10⁻³(±1.5%) 4.67× 10⁻³(±1.3%) 4.23× 10⁻³(±1.1%)
aDistance is again scaled by the cantilever length, L. Results obtained using linear superposition theory of ref15andeq 4. Listed uncertainties in the
parentheses specify a 95% confidence interval and are determined by the uncertainty in the measured resonant frequencies. The first four modes of the cantilever are used in the linear superposition theory.
The only inertial imaging measurements to date were reported in ref15. Importantly, these were performed passively by measuring the thermal noise spectra of the cantilevers over a finite bandwidth (to 1 MHz); hence, only four modes were collected. As discussed, analysis of these measurements (using the linear superposition theory of ref 15) required significant computation because a measurement zone needed to be computed. The present theory eliminates this requirement, simplifying analysis and ensuring unequivocal measurement interpretation; uncertainty due to the measurement zone is eliminated. Use of this theory in future measurements, e.g., using active drive and a larger bandwidth to overcome the above-stated limitations, will enable the full potential of inertial imaging to be experimentally realized.
Conclusions. We have presented simple nonlinear formulas for measuring the spatial distribution of a mass adsorbed to a nanomechanical resonator. Formulas for both one- and two-dimensional devices have been reported, which facilitates inertial imaging measurements using a range of current NEMS devices. The linear superposition theory of ref15 and the nonlinear formulas in eqs4and6formally represent a set of inverse relations in the limit of small adsorbate size. They produce identical numerical results in this limit. The presented nonlinear formulas can be implemented trivially using standard packages such as Mathematica and Matlab and simply involve the use of a root-finding procedure, e.g., Newton’s method. These formulas are expected to be advantageous in the application of inertial imaging in practice. Wolfram CDF Player apps that implement the nonlinear formulas for cantilever and doubly clamped beams are available from the authors; details are provided in theSupporting Information.
■
ASSOCIATED CONTENT*
S Supporting InformationThe Supporting Information is available free of charge on the ACS Publications website at DOI: 10.1021/acs.nano-lett.7b04301.
Additional information on the software provided and a detailed description of the conditions for convergence of the algorithm delineated in the main manuscript. (PDF)
■
AUTHOR INFORMATION Corresponding Author *E-mail:[email protected]. ORCID John E. Sader:0000-0002-7096-0627 M. Selim Hanay:0000-0002-1928-044X Michael L. Roukes:0000-0002-2916-6026 NotesThe authors declare no competingfinancial interest.
■
ACKNOWLEDGMENTSThe authors acknowledge support from an NIH Director’s Pioneer award, the Australian Research Council grants scheme, and the ARC Centre of Excellence in Exciton Science (CE170100026). M.S.H. acknowledges support from FP7 Marie Curie Career Integration Grant. The authors thank Mustafa Kara for useful discussion.
■
REFERENCES(1) Ekinci, K. L.; Huang, X. M. H.; Roukes, M. L. Ultrasensitive nanoelectromechanical mass detection. Appl. Phys. Lett. 2004, 84, 4469−4471.
(2) Ilic, B.; et al. Attogram detection using nanoelectromechanical oscillators. J. Appl. Phys. 2004, 95, 3694−3703.
(3) Yang, Y. T.; Callegari, C.; Feng, X. L.; Ekinci, K. L.; Roukes, M. L. Zeptogram-scale nanomechanical mass sensing. Nano Lett. 2006, 6, 583−586.
(4) Li, M.; Tang, H. X.; Roukes, M. L. Ultra-sensitive NEMS-based cantilevers for sensing, scanned probe and very high-frequency applications. Nat. Nanotechnol. 2007, 2, 114−120.
(5) Gil-Santos, E.; et al. Nanomechanical mass sensing and stiffness spectrometry based on two-dimensional vibrations of resonant nanowires. Nat. Nanotechnol. 2010, 5, 641−5.
(6) Burg, T. P.; et al. Weighing of biomolecules, single cells and single nanoparticles in fluid. Nature 2007, 446, 1066−1069.
(7) Schmid, S.; Kurek, M.; Adolphsen, J. Q.; Boisen, A. Real-time single airborne nanoparticle detection with nanomechanical resonant filter-fiber. Sci. Rep. 2013, 3, 1288.
(8) Naik, A. K.; Hanay, M. S.; Hiebert, W. K.; Feng, X. L.; Roukes, M. L. Towards single-molecule nanomechanical mass spectrometry. Nat. Nanotechnol. 2009, 4, 445−450.
(9) Hanay, M. S.; Kelber, S.; Naik, A. K.; Chi, D.; Hentz, S.; Bullard, E. C.; Colinet, E.; Duraffourg, L.; Roukes, M. L. Single-protein nanomechanical mass spectrometry in real time. Nat. Nanotechnol. 2012, 7, 602−608.
(10) Dohn, S.; Svendsen, W.; Boisen, A.; Hansen, O. Mass and position determination of attached particles on cantilever based mass sensors. Rev. Sci. Instrum. 2007, 78, 103303.
(11) Jensen, K.; Kim, K.; Zettl, A. An atomic-resolution nano-mechanical mass sensor. Nat. Nanotechnol. 2008, 3, 533−7.
(12) Chiu, H. Y.; Hung, P.; Postma, H. W.; Bockrath, M. Atomic-scale mass sensing using carbon nanotube resonators. Nano Lett. 2008, 8, 4342−6.
(13) Lassagne, B.; Garcia-Sanchez, D.; Aguasca, A.; Bachtold, A. Ultrasensitive mass sensing with a nanotube electromechanical resonator. Nano Lett. 2008, 8, 3735−8.
(14) Chaste, J.; Eichler, A.; Moser, J.; Ceballos, G.; Rurali, R.; Bachtold, A. A nanomechanical mass sensor with yoctogram resolution. Nat. Nanotechnol. 2012, 7, 301−304.
(15) Hanay, M. S.; Kelber, S. I.; O’Connell, C. D.; Mulvaney, P.; Sader, J. E.; Roukes, M. L. Inertial imaging with nanomechanical systems. Nat. Nanotechnol. 2015, 10, 339−344.
(16) Kelleci, M.; Aydogmus, H.; Aslanbas, L.; Erbil, S. O.; Hanay, M. S. Towards microwave imaging of cells. Lab Chip 2018, 18, 463−472.
■
NOTE ADDED IN PROOFA paper showing that the original formulation of the inertial imaging technique15 can be extended beyond mechanical systems and applied to electromagnetic sensors has appeared recently.16