Identification of Endogenous Reference Genes
for qRT-PCR Analysis in Normal Matched Breast
Tumor Tissues
Article in Oncology Research Featuring Preclinical and Clinical Cancer Therapeutics · February 2009 DOI: 10.3727/096504009788428460 · Source: PubMed CITATIONS
28
READS230
6 authors, including: Some of the authors of this publication are also working on these related projects: Zebrafish (MSc projects)View project Ozlen Konu Bilkent University 68 PUBLICATIONS 574 CITATIONS SEE PROFILE Betul Bozkurt Ankara Numune Training and Research Hospital 35 PUBLICATIONS 236 CITATIONS SEE PROFILE Isik Yulug Bilkent University 65 PUBLICATIONS 1,873 CITATIONS SEE PROFILE
All content following this page was uploaded by Isik Yulug on 23 September 2014. The user has requested enhancement of the downloaded file.
Oncology Research, Vol. 17, pp. 1–100 0965-0407/09 $90.00+ .00
Printed in the USA. All rights reserved. E-ISSN 1555-3906
Copyright 2009 Cognizant Comm. Corp. www.cognizantcommunication.com
Identification of Endogenous Reference Genes for qRT-PCR Analysis
in Normal Matched Breast Tumor Tissues
Bala Gur-Dedeoglu,* Ozlen Konu,* Betul Bozkurt,† Gulusan Ergul,‡ Selda Seckin,‡ and Isik G. Yulug*
*Department of Molecular Biology and Genetics, Faculty of Science, Bilkent University, Ankara, Turkey †Department of General Surgery, Ankara Numune Research and Teaching Hospital, Ankara, Turkey
‡Department of Pathology, Ankara Numune Research and Teaching Hospital, Ankara, Turkey
Quantitative gene expression measurements from tumor tissue are frequently compared with matched normal and/or adjacent tumor tissue expression for diagnostic marker gene selection as well as assessment of the degree of transcriptional deregulation in cancer. Selection of an appropriate reference gene (RG) or an RG panel, which varies depending on cancer type, molecular subtypes, and the normal tissues used for interindi-vidual calibration, is crucial for the accurate quantification of gene expression. Several RG panels have been suggested in breast cancer for making comparisons among tumor subtypes, cell lines, and benign/malignant tumors. In this study, expression patterns of 15 widely used endogenous RGs (ACTB, TBP, GAPDH, SDHA, HPRT, HMBS, B2M, PPIA, GUSB, YWHAZ2, PGK1, RPLP0, PUM1, MRPL19, and RPL41), and three candidate genes that were selected through analysis of two independent microarray datasets (IL22RA1, TTC22, ZNF224) were determined in 23 primary breast tumors and their matched normal tissues using qRT-PCR. Additionally, 18S rRNA, ACTB, and SDHA were tested using randomly primed cDNAs from 13 breast tumor pairs to assess the rRNA/mRNA ratio. The tumors exhibited significantly lower rRNA/mRNA ratio when compared to their normals, on average. The expression of the studied RGs in breast tumors did not exhibit differences in terms of grade, ER, or PR status. The stability of RGs was examined based on two different statistical models, namely GeNorm and NormFinder. Among the 18 tested endogenous reference genes, ACTB and SDHA were identified as the most suitable reference genes for the normalization of qRT-PCR data in the analysis of normal matched tumor breast tissue pairs by both programs. In addition, the expression of the gelsolin (GSN) gene, a well-known downregulated target in breast tumors, was analyzed using the two most suitable genes and different RG combinations to validate their effectiveness as a normal-ization factor (NF). The GSN expression of the tumors used in this study was significantly lower than that of normals showing the effectivity of using ACTB and SDHA as suitable RGs in this set of tumor–normal tissue panel. The combinational use of the best performing two RGs (ACTB and SDHA) as a normalization factor can be recommended to minimize sample variability and to increase the accuracy and resolution of gene expression normalization in tumor–normal paired breast cancer qRT-PCR studies.
Key words: Real-time quantitative RT-PCR; Endogenous reference genes; Normalization factor; Breast cancer
INTRODUCTION
Real-time quantitative RT-PCR (reverse-transcription polymerase chain reaction) is one of the most sensitive and specific methods for quantification of expression at the mRNA level (1–4). Inclusion of an endogenous ref-erence gene or genes (RGs) is crucial to standardize ini-tial RNA quantity to overcome bias originating from RNA measurement errors, problems with RNA integrity, and differential cDNA conversion efficiencies (5–7). Different options exist to quantify expression from the results of a qRT-PCR run, such as the relative quantifi-cation by the 2−∆∆Ctmethod or mRNA copy number
esti-Address correspondence to Isik G. Yulug, Ph.D., Department of Molecular Biology and Genetics, Bilkent University, Faculty of Science, TR-06800 Ankara, Turkey. Tel:+90-312-290-2506; Fax: +90-312-266-5097; E-mail: [email protected]
1
mation (8). Quantification of a target gene requires the use of a proper RG whose expression is relatively stable across samples to estimate the degree of variability within and among experimental groups as well as to standardize the expression to a baseline common to all samples (5–7,9). Nevertheless, numerous studies show an inherent instability in regard to expression of house-keeping genes, many of which are still commonly used as references (10–16).
Analysis of gene expression is fundamental for can-cer research for the detection of subtle differential ex-pression between tumor and normal tissues or among different tumor types. In particular, recent target
valida-tion and disease diagnostic marker selecvalida-tion studies rely primarily on gene expression comparisons between tu-mor–normal pairs (17–21).
Moreover, the use of multiple endogenous RGs sig-nificantly increases the accuracy of the normalization by reducing the impact of outliers (5,9). Accordingly, a plethora of single or combinational usage of two or more RGs has been recommended for relative quantification of expression data for various tumor tissue types (22– 29).
Breast cancer is the most common cancer affecting women worldwide. New high-throughput technologies have opened the possibility to study the gene expression profile of the tumors. The validation of differentially ex-pressed genes using independent methodology such as qRT-PCR is often desirable. In breast cancer qRT-PCR studies, different single housekeeping genes have been used to quantify the expression level of target genes (30–40). Recently, MRPL19 and PPIA were reported as a stable RG combination to analyze benign and malig-nant breast cancer specimens (41). Similarly, Lyng et al. reported an RG panel comprised of TBP, RPLP0, and
PUM1 for normalizing the gene expression levels across
the ER+ and ER− breast tumors, and normal breast tis-sues (42).
However, there are yet no systematic studies report-ing on the expression of commonly used RGs in tumor-matched normal breast samples.
The aim of this study was to identify a suitable RG(s) that can be used as a normalization factor (NF) for more accurate and reliable normalization of paired breast tu-mor–normal tissue gene expression studies with qRT-PCR.
We evaluated 18 potential candidate RGs listed in Table 1 for their expression profile in 23 normal paired breast tumor tissue specimens. The genes ACTB and
SDHA were calculated as the most stable RGs by two
dedicated validation programs, geNorm and Norm-Finder. Furthermore, the suitability of these RGs as NF individually or in combination was validated based on the relative expression quantification of gelsolin (GSN). Correlation coefficients between GSN expression values that were normalized either to a single RG or combina-tions of RGs in breast tumors were also assessed. We also determined the expression of 18S rRNA to ACTB or SDHA mRNA from randomly primed cDNA on a subset of tumor–normal samples (n= 13 pairs) and found that tumors exhibited significantly lower rRNA/ mRNA ratio.
The results of the present study showed that using the geometric mean of the combinations of two of the best performing RGs as NF can be used to reduce the vari-ability between tumor samples and their normal
counter-parts while studying their expression by qRT-PCR in breast tumor samples.
MATERIALS AND METHODS
Patients and Samples
Primary tumor samples and matched normal breast tissues were obtained from patients (n= 23, mean age 48 years, range 24–74 years) during surgery and imme-diately snap-frozen in liquid nitrogen and stored at −80°C until RNA extraction. The frozen tissue samples were sectioned and mounted on glass slides. The slides were stained with hematoxylin and eosin for histopatho-logical examinations. The tumor samples with more than 90% tumor cells and patient-matched tissue pairs with normal histological examination were included in this study. These frozen tissues were cut into 5-µM-thick sections and used for RNA isolation and cDNA synthe-sis. All the tumor samples had been classified as infil-trating ductal carcinoma. Tumor grade was determined according to the Bloom-Richardson score. Eight of the 23 tumors studied were grade 1 and the number of grade 2 and grade 3 tumors was 7 and 8, respectively. Eleven of the samples were estrogen receptor positive (ER+) while 10 of them were estrogen receptor negative (ER−). The number of progesterone positive (PR+) tumors was 11 and that of progesterone negative (PR−) tumors was 10.
The use of the tissue material was approved by the Research Ethics Committee of Ankara Numune Re-search and Teaching Hospital and consents were ob-tained in accordance with the Helsinki Declaration.
RNA Extraction and cDNA Synthesis
The frozen breast specimens were put into Trizol re-agent (AppliChem, Darmstadt, Germany), disrupted with a homogenizer, and total RNA was isolated accord-ing to the manufacturer’s instructions. Genomic DNA contaminations were removed by on-column DNaseI treatment (Macharel Nagel, Duren, Germany). The con-centration of the isolated RNA and the ratio of absor-bance at 260 nm to 280 nm were measured with the
NanoDrop ND-1000 spectrophotometer (NanoDrop
Technologies, Montchanin, DE, USA) in triplicate. The mean OD260/280 ratio for RNA samples was 2.03± 0.12
(range 1.92–2.15; n= 46). An aliquot of 1 µg total RNA from each sample was electrophoresed on a 1.2% RNA agarose gel to confirm integrity of the RNA. First-strand
cDNA was synthesized from 1 µg total RNA using
oligo(dT) or random hexamer primers by using the Re-vert Aid First strand cDNA synthesis kit (Fermentas, MD, USA). The random hexamer primed cDNA sam-ples (n= 13, tumor and normal pair) were used for the
REFERENCE GENES FOR NORMAL MATCHED BREAST TUMORS 3
analysis of 18S rRNA gene expression together with SDHA and ACTB in the same samples. All cDNAs were diluted 1:5 times before being used as a PCR tem-plate and stored at−20°C until further use.
Real-Time Quantitative RT-PCR
Expression levels of 18 RGs [ACTB, GAPD, TBP,
SDHA, HPRT, HMBS, B2M, PPIA, GUSB, YWHAZ, PGK1, RPL41, PUM1, RPLP0, MRPL19, TTC22, IL22RA1, ZNF224, and the gelsolin (GSN) gene] were
quantified with qRT-PCR by using the SYBR Green I dye detection system on the BioRad iCycler Instrument (BioRad Laboratories, Hercules, CA, USA). In order to test whether the ratio of the mRNA to rRNA was stable across tumor and matched normal samples, 18S rRNA,
ACTB, and SDHA genes were quantified with qRT-PCR
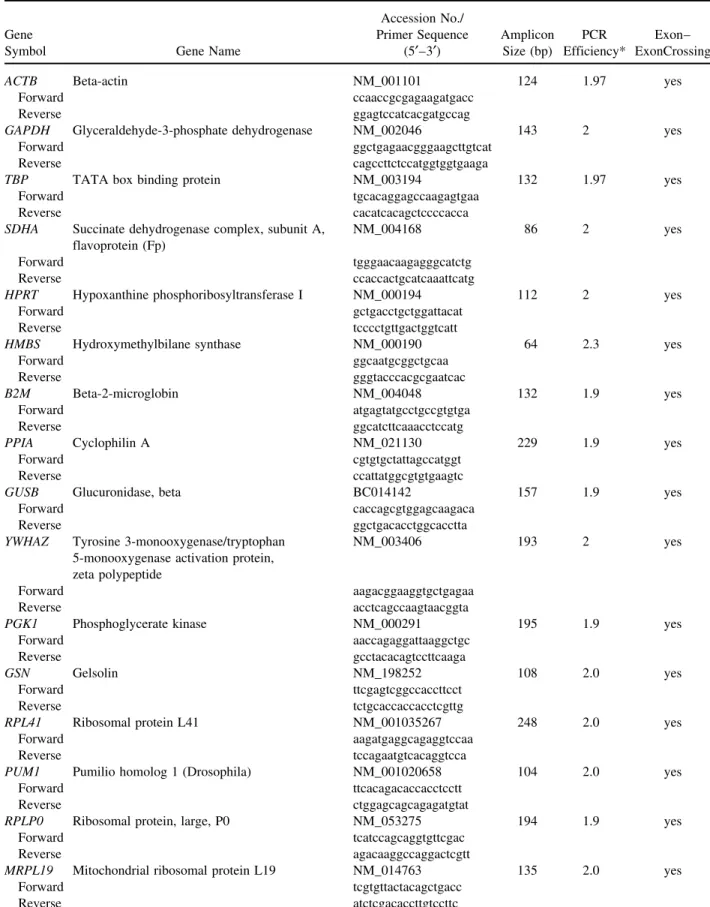
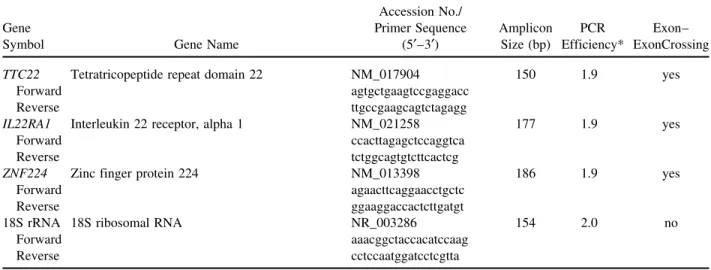
by using randomly primed cDNA samples. The primers were designed to include large intronic sequences be-tween the forward and reverse pair or designed from exon–exon boundaries to avoid DNA contamination if any remained in the RNA samples. The sequences of the gene-specific primers were put into the blast search to determine their specificities. None of the primer pairs showed significant homology to other sequences in the genome but their own. The primer sequences and acces-sion numbers of the RGs are listed in Table 1.
The amplification mixtures contained 1.0 µl of 1:5 diluted cDNA template, 6.25µl SYBR Green PCR Mas-ter Mix Buffer (BioRad, Hercules, CA, USA), and 10 pmol forward and reverse primers in a final volume of 12.5µl. The cycle conditions were as follows: an initial incubation of 95°C for 5 min and then 45 cycles of 95°C for 30 s and 60°C for 30 s, during which the fluores-cence data were collected. Following amplification, a re-action product melt curve was obtained to provide evi-dence for a single reaction product. The iCycler iQ Optical System Software (version 3, BioRad Labora-tories) was used to determine the melting temperatures of the products. The threshold cycle (Ct) value was cal-culated as the cycle where the fluorescence of the sam-ple exceeded a threshold level. Tumor and matched nor-mal samples were always analyzed in the same run to exclude between-run variations and each sample was studied in duplicate. The stability between duplicates was evaluated by taking the standard deviations of the average differences of all duplicate pairs (95% CI,−0.3 ± 0.8, n= 984). A no-template control of nuclease-free water was included in each run. The RNA samples used for cDNA synthesis were also used for (−)RT control (no reverse transcriptase enzyme) reactions. These nega-tive RT-PCR controls were also included in the PCR reactions for each set of primers. No genomic DNA con-tamination was detected.
Data Retrieval and Selection of Candidate Reference Genes From Microarray Studies
Two publicly available independent microarray gene expression data sets GDS2635 (43) and GDS2250 (44) were downloaded from the Gene Expression Omnibus (GEO, http://www.ncbi.nlm.nih.gov/geo/) and processed by the BRB-ARRAYTOOLS (Biometric Research Branch [http://linus.nci.nih.gov/BRB-ArrayTools.html]. Both of the datasets were generated by using the Affymetrix HGU133 Plus 2.0 platform; thus, they were highly com-parable. These two independent microarray datasets (GDS2635 and GDS2250) were combined with respect to gene names using a set of customized Perl routines and the genes that were stably expressed between tumor and normal samples were selected by using Student’s t-test (p> 0.99). A total number of 12 normal and 45 tu-mor samples and 54,674 gene probes were used in this analysis. TTC22 was one of the top ranked nondifferen-tially expressed genes between tumor and normal sam-ples (p> 0.99) and was selected as a candidate RG.
The GDS2635 dataset is the only available dataset that was generated by using matched normal breast tu-mor samples. Therefore, we used this set independently and determined the genes that showed no expression dif-ferences between tumors and matched normal samples by using paired Student’s t-test (p> 0.99). IL22RA1 and
ZNF224 were selected from the list as top ranked genes
and used as candidate RGs (p> 0.99).
Data Analysis
The PCR efficiencies (E) were evaluated by 10-fold dilution series of cDNAs (1–1:100 000 dilution) for each pair of primers by using a breast carcinoma cell line cDNA pool (MCF7, MDA-MB-231, T47D, HMEC, MCF12A). The primer amplification efficiencies were also tested with reference genes ACTB, GADPH, and
SDHA in breast tumor tissue cDNA pools (n= 3) to
en-sure no inhibitory component was present in the tissue samples. No inhibitory effect was observed in amplifica-tion efficiencies (E= 2.0). A graph of threshold cycle (Ct) versus relative log10copy number of the calibration
sample from the dilution series was produced and the reaction efficiency was determined for each primer set by using the slope of this graph (E= 10(−1/slope)) and
pre-sented at Table 1 (45). The amplification efficiency of each primer pair was corrected accordingly (2).
The gene expression level of GSN was normalized with respect to RGs and expressed as the ratio of ∆Cts [(Etarget)∆CtTarget (control−sample)/(Eref)∆CtReference (control−sample)] using the
corresponding normal pair as a control (2). When the
GSN normalization was based on multiple RGs, the
Table 1. Information on the Gene-Specific Primers and Their Real-Time PCR Efficiencies Accession No./
Gene Primer Sequence Amplicon PCR Exon–
Symbol Gene Name (5′–3′) Size (bp) Efficiency* ExonCrossing
ACTB Beta-actin NM_001101 124 1.97 yes
Forward ccaaccgcgagaagatgacc
Reverse ggagtccatcacgatgccag
GAPDH Glyceraldehyde-3-phosphate dehydrogenase NM_002046 143 2 yes
Forward ggctgagaacgggaagcttgtcat
Reverse cagccttctccatggtggtgaaga
TBP TATA box binding protein NM_003194 132 1.97 yes
Forward tgcacaggagccaagagtgaa
Reverse cacatcacagctccccacca
SDHA Succinate dehydrogenase complex, subunit A, NM_004168 86 2 yes
flavoprotein (Fp)
Forward tgggaacaagagggcatctg
Reverse ccaccactgcatcaaattcatg
HPRT Hypoxanthine phosphoribosyltransferase I NM_000194 112 2 yes
Forward gctgacctgctggattacat
Reverse tcccctgttgactggtcatt
HMBS Hydroxymethylbilane synthase NM_000190 64 2.3 yes
Forward ggcaatgcggctgcaa
Reverse gggtacccacgcgaatcac
B2M Beta-2-microglobin NM_004048 132 1.9 yes
Forward atgagtatgcctgccgtgtga
Reverse ggcatcttcaaacctccatg
PPIA Cyclophilin A NM_021130 229 1.9 yes
Forward cgtgtgctattagccatggt
Reverse ccattatggcgtgtgaagtc
GUSB Glucuronidase, beta BC014142 157 1.9 yes
Forward caccagcgtggagcaagaca
Reverse ggctgacacctggcacctta
YWHAZ Tyrosine 3-monooxygenase/tryptophan NM_003406 193 2 yes
5-monooxygenase activation protein, zeta polypeptide
Forward aagacggaaggtgctgagaa
Reverse acctcagccaagtaacggta
PGK1 Phosphoglycerate kinase NM_000291 195 1.9 yes
Forward aaccagaggattaaggctgc
Reverse gcctacacagtccttcaaga
GSN Gelsolin NM_198252 108 2.0 yes
Forward ttcgagtcggccaccttcct
Reverse tctgcaccaccacctcgttg
RPL41 Ribosomal protein L41 NM_001035267 248 2.0 yes
Forward aagatgaggcagaggtccaa
Reverse tccagaatgtcacaggtcca
PUM1 Pumilio homolog 1 (Drosophila) NM_001020658 104 2.0 yes
Forward ttcacagacaccacctcctt
Reverse ctggagcagcagagatgtat
RPLP0 Ribosomal protein, large, P0 NM_053275 194 1.9 yes
Forward tcatccagcaggtgttcgac
Reverse agacaaggccaggactcgtt
MRPL19 Mitochondrial ribosomal protein L19 NM_014763 135 2.0 yes
Forward tcgtgttactacagctgacc
Table 1. Continued
Accession No./
Gene Primer Sequence Amplicon PCR Exon–
Symbol Gene Name (5′–3′) Size (bp) Efficiency* ExonCrossing
TTC22 Tetratricopeptide repeat domain 22 NM_017904 150 1.9 yes
Forward agtgctgaagtccgaggacc
Reverse ttgccgaagcagtctagagg
IL22RA1 Interleukin 22 receptor, alpha 1 NM_021258 177 1.9 yes
Forward ccacttagagctccaggtca
Reverse tctggcagtgtcttcactcg
ZNF224 Zinc finger protein 224 NM_013398 186 1.9 yes
Forward agaacttcaggaacctgctc
Reverse ggaaggaccactcttgatgt
18S rRNA 18S ribosomal RNA NR_003286 154 2.0 no
Forward aaacggctaccacatccaag
Reverse cctccaatggatcctcgtta
*PCR efficiencies were calculated according to Rasmussen (45).
statistical analyses were performed using Minitab soft-ware. The two-tailed paired Student’s t-test was used when comparing tumor and matched normal expression values; and values of p< 0.05 with Bonferroni correc-tion were considered statistically significant. One-way ANOVA was performed to investigate whether tumor samples, which were normalized to their matched nor-mal counterparts, differed in terms of grade, estrogen (ER), and progesterone receptor (PR) status and the ef-fect of the age at diagnosis was analyzed with regression analysis. Bonferroni correction was performed when multiple tests were applied.
The software geNormTM, version 3.4 (9) and Norm
Finder (25), both Visual Basic Applications (VBA) for Microsoft Excel, were used to calculate the stability of candidate RGs and to find the best normalizer(s) for a given set of reference genes. Ct values were converted to linear expression quantities by E−∆Ctto investigate the
genes in geNorm and NormFinder. Tissue samples were categorized into normal (n= 23) or tumor groups (n = 23) according to standard histopathological examina-tions for the NormFinder analysis.
RESULTS
Expression Patterns of Candidate RGs
Expression levels of 18 candidate RGs were deter-mined in 23 breast tumor tissues and their matched nor-mal samples by qRT-PCR using the SYBR Green I dye detection system. Amplification efficiencies calculated based on standard curves from the serial dilutions of breast cancer cell lines indicated that all primer pairs were over 90% efficient (values ranged between 1.97 and 2.3) (Table 1). Each RG had a different expression range between the tumors and matched normal samples.
The RG expression levels displayed a wide range of Ct values between 13 and 33, grouped into three ranges for their mean Ct values. Highly expressed genes were
B2M, ACTB, PPIA, RPL41, RPLP0, and GAPDH (mean
Ct values below 20 cycles). Genes with moderate ex-pression were YWHAZ, PGK1, SDHA, PUM1, MRPL19, and GUSB (mean Ct values between 20 and 25 cycles). Genes with low expression were TBP, HPRT, IL22RA1,
TTC22, ZNF224, and HMBS (mean Ct values over 25
cycles).
The stability between duplicate measurements of each RG used in the study was very high (95% CI,−0.3 ± 0.8,
n= 984), suggesting high experimental measurement
ac-curacy.
RGs used in this study did not exhibit differences in terms of grade, ER, PR status (p> 0.05), or age (R2=
0.001 to 0.139; p> 0.05) in breast cancer. Furthermore, raw Ct values of the 18 RGs were found to be moder-ately to highly correlated with each other (p< 0.05, Pearson’s correlation coefficient range 0.516–0.929, n= 46).
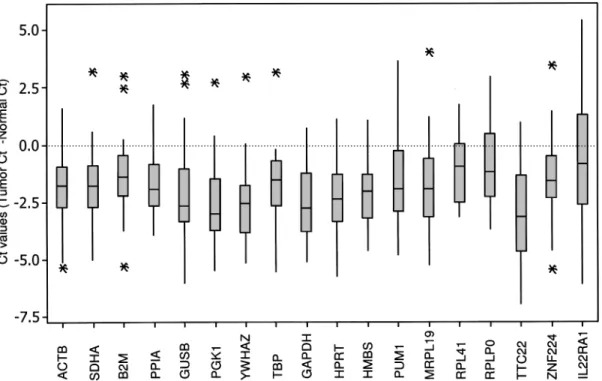
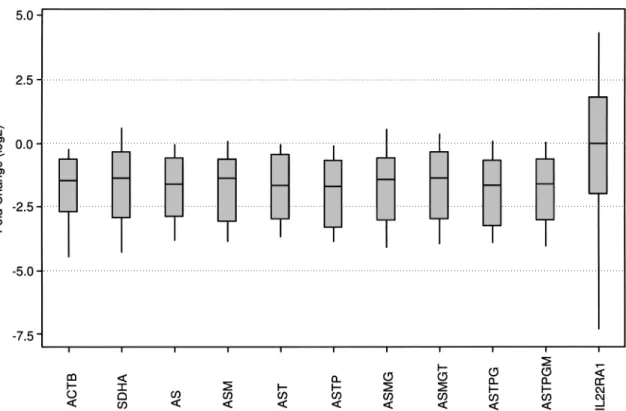
The reference genes used in our panel exhibited rela-tively higher expression in tumor samples than in their normal counterparts (paired t-test; p< 0.05). Seventeen out of 18 reference genes displayed a consistent 1.86± 0.7 (log2, mean± SD) fold expression difference
be-tween breast tumor and normal pairs. The expression range of candidate genes was shown in terms of differ-ence between the Ct values of tumor and normal sam-ples as box-whisker-plots (Fig. 1).
Expression Stability of Candidate RGs
The expression stability of each gene was validated using two different software programs, geNorm and
Figure 1. Expression range of differences between the Ct values of breast tumor and normal samples for each candidate reference genes. Threshold cycle values (CtTumor−Ctnormal) for each reference gene are shown as medians (lines), 25th to 75th percentile (boxes), and range (whiskers). Whiskers illustrate the data points in Q3+1.5 (IQR) and Q1−1.5(IQR) [interquartile range (IQR) = Q3−Q1). p-Values were calculated using the paired Student’s t-test (p < 0.05, significant). ACTB, p = 8.7 × 10⁻⁶; SDHA, p= 5.7× 10⁻⁵; B2M, p= 0.001; PPIA, p = 4.7 × 10⁻⁶; GUSB, p= 0.000; PGK1, p = 1.0 × 10⁻⁶; YWHAZ, p= 1.0 × 10⁻⁶; TBP, p= 0.000; GAPDH, p= 4.3 × 10⁻⁸; HPRT, p= 1.9 × 10⁻⁷; HMBS, p= 8.2 × 10⁻⁵; PUM1, p= 0.000; MRPL19, p = 0.000; RPL41, p= 0.005; RPLP0, p = 0.036; TTC22, p = 3.5 × 10⁻⁷; ZNF224, p= 0.001; IL22RA1, p = 0.358. *The Ct values that fall beyond the whiskers.
NormFinder, to identify the most suitable genes for nor-malization.
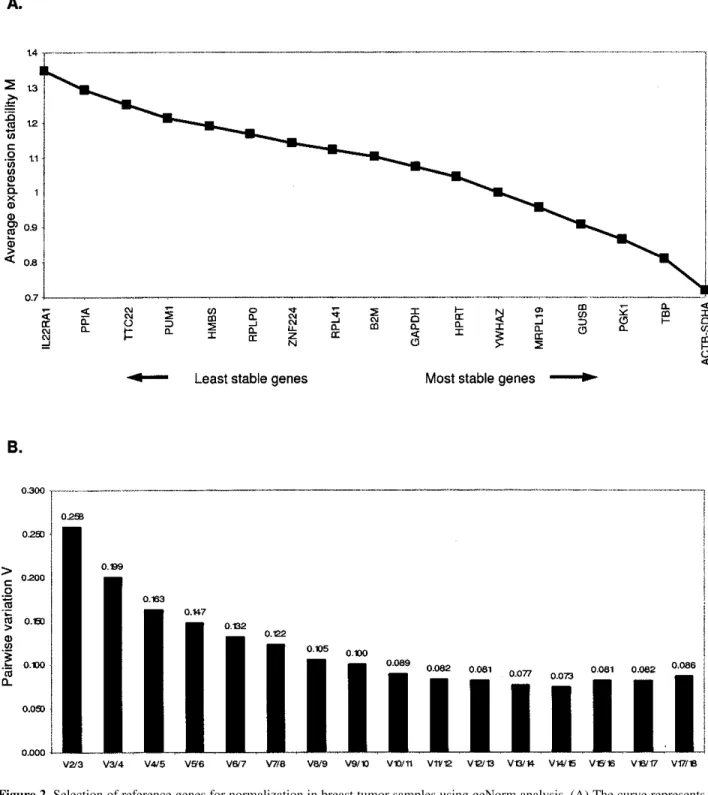
The geNorm program determines the most stable RGs from a set of investigated genes in a given set of samples. It calculates the gene expression stability mea-sure (M) for an RG, considering the average pair-wise variation of all other tested RGs (9). The lowest M value marks the gene(s) with the most stable expression. The average M value of the 18 candidate RGs are plotted in Figure 2A. The curve represents the stepwise exclusion of the least stable genes with higher M values. This re-sult led to the identification of the two most stable
genes, ACTB and SDHA, in the tested samples (M=
0.7).
In addition to the stability value M, pair-wise varia-tions (Vn/n+ 1) were calculated to determine the effect of adding a gene (n+ 1) in normalization (Fig. 2b). This allowed for determination of an NF needed to define the optimal number of RGs required for reliable normaliza-tion. A large pair-wise variation means that the added gene has a significant effect on normalization and should therefore be included for calculation of reliable
normalization (9). The most stable six genes, ACTB,
SDHA, TBP, PGK1, GUSB, and MRPL19 yielded a V
value of 0.147, giving the cut-off value 0.15.
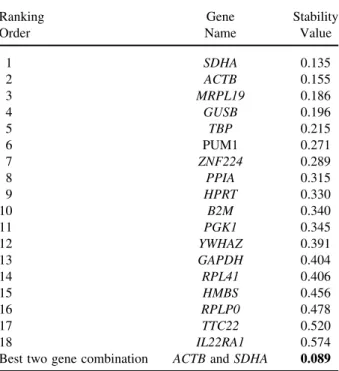
We also used the NormFinder software program for stability evaluation among the candidate RGs. Norm Finder is an add-in for Microsoft Excel and is used for calculating a stability value from a set of candidate RGs. In this program, the stability value is based on the com-bined estimate of inter- and intragroup expression varia-tions of the studied gene. The candidate gene with the smallest variability value has higher stability as it shows the lowest variability of inter- and intragroup expression (25). NormFinder also ranks the set of candidate RGs according to their expression stability from a panel of candidate genes that could be organized in different sub-groups (tumor and matched normal tissues). Our find-ings indicated that the genes occupying the top five ranks, SDHA, ACTB, MRPL19, TBP, and GUSB ap-peared to be the most stable genes, while IL22RA1 was defined as the least stable gene (Table 2). Although Norm Finder selected SDHA as the most stable gene with a stability value of 0.135, the best combination of the two
REFERENCE GENES FOR NORMAL MATCHED BREAST TUMORS 7
Figure 2. Selection of reference genes for normalization in breast tumor samples using geNorm analysis. (A) The curve represents the stepwise exclusion of the least stable genes according to the M values calculated by geNorm. The genes with the higher M values are eliminated and the remainders represent the two most stable genes, SDHA and ACTB. The genes are ranked on the x-axis from left to right according to their expression stability. (B) Determination of the optimal number of reference genes for normalization by calculation of the pair-wise variation (V) of normalization factor ratios for different numbers of control genes. Each number on the bars shows the pair-wise variation between two sequential normalization factors. On the left-most side is the pair-wise variation when the number of genes is enlarged from 2 to 3 (V2/3). Stepwise inclusion of less stable genes generates the next data points. Inclusion of the third and the fourth genes (V4/5) nears the V value to the cut-off value of 0.15.
Table 2. Rank of Candidate Reference Genes According to the Expression Stability Calculated by Normfinder
Ranking Gene Stability
Order Name Value
1 SDHA 0.135 2 ACTB 0.155 3 MRPL19 0.186 4 GUSB 0.196 5 TBP 0.215 6 PUM1 0.271 7 ZNF224 0.289 8 PPIA 0.315 9 HPRT 0.330 10 B2M 0.340 11 PGK1 0.345 12 YWHAZ 0.391 13 GAPDH 0.404 14 RPL41 0.406 15 HMBS 0.456 16 RPLP0 0.478 17 TTC22 0.520 18 IL22RA1 0.574
Best two gene combination ACTB and SDHA 0.089
The candidate reference genes are listed with decreasing expression stability from 1 to 18. The best combination of the two genes and the stability value were calculated by NormFinder.
genes selected by the program, ACTB and SDHA, im-proved the stability value to 0.089, indicating a more reliable normalization.
Assessment of Suitable RGs for Normalization
GSN is an actin depolymerizing factor acting as the
principal intracellular and extracellular actin-severing protein. Expression of GSN was shown to be undetect-able or greatly reduced in invasive human breast carci-nomas both at the protein and RNA level (46). The pro-gressive loss of GSN from benign mammary tissue through different stages of mammary tumorigenesis has also been demonstrated (47,48). To assess the signifi-cance of the selected RGs for normalization, the expres-sion level of GSN mRNA was measured by qRT-PCR and statistically evaluated in the same set of tumor and matched normal breast tissue samples. Because a gene expression NF could either be based on a single gene or a combination of gene expression values (9), GSN gene expression levels were normalized using the RGs pro-posed by the geNorm or NormFinder calculations (i.e.,
ACTB, SDHA, GUSB, MRPL19, TBP, and PGK1 in
combinations) (Fig. 3). We also tested the performance of IL22RA1, the lowest ranked gene both in the geNorm and NormFinder analyses, for GSN normalization (Fig. 3). The median GSN expression values were below zero,
which indicated downregulation with respect to matched normal GSN expression, independent of the NF used.
Moreover, statistical analyses indicated that the GSN expression was significantly downregulated in tumor samples when compared with that from normal samples with combinational use of the best RGs (ACTB and
SDHA) proposed both by the geNorm or NormFinder
programs (p< 0.05). In contrast, downregulation of the GSN expression was not significant when the least sta-ble gene, IL22RA1, was used as NF (p> 0.05) with on average 39% of the tumor samples being upregulated with respect to their normal counterparts (Fig. 3). In ad-dition, when GSN expression in tumors was not normal-ized with RGs but normalnormal-ized only with the correspond-ing normal GSN expression [∆Ct; Ct(GSN tumor)− Ct(GSN normal)],
the expression difference was not significant between tumor and normal pairs (0.18± 2.2, mean ± SD; p = 0.7, one-sample t-test). Fold change values in GSN expres-sion obtained by using different NFs were significantly correlated with each other, yet the degree of correlation increased when two genes (in combination ACTB and
SDHA) were used as NF. For example, the correlation
coefficient between tumor samples’ GSN expression val-ues normalized with ACTB and those with SDHA (rA vs. S)
was 0.80 whereas the degree of correlation increased when a combination of best two RG was used (rAS vs. A=
0.95 and rAS vs. S0.96, where A and S refer to ACTB and
SDHA, respectively). The addition of the third or the
fourth gene to the best two genes did not change the correlation results more than 1% (rAS vs. ASM= 0.96 and
rAS vs. AST= 0.97, rAST vs. ASTP= 0.97).
Evaluation of 18S rRNA to mRNA Ratio
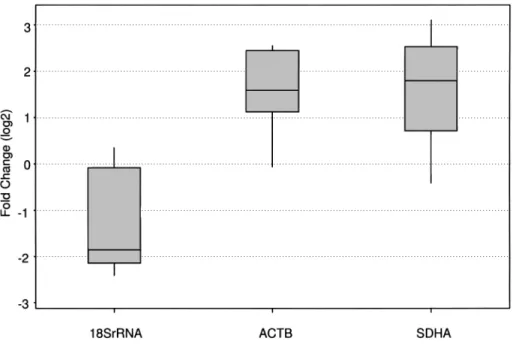
In the present study we quantified 18S rRNA, ACTB, and SDHA mRNA levels in a group of 13 tumor and normal pairs. The mean expression of 18S rRNA was found to be downregulated in tumor samples (9/13) compared to their normal counterparts (log2 difference,
1.16± 1.06; mean ± SD) while the expression of ACTB and SDHA genes were consistently high in tumor sam-ples compared to their normal pairs (log2 difference,
1.9± 1.4 and 1.8 ± 1.5, respectively; mean ± SD). Our results showed that the 18S rRNA to ACTB or SDHA mRNA ratio was approximately eightfold lower in tu-mors than that of normal pairs on average (paired t-test
p= 4.2 × 10⁻⁵and p= 2.2 × 10⁻⁴, respectively) (Fig. 4).
DISCUSSION
To our knowledge this is the first systematic compari-son of frequently used RGs and their utility as internal controls for accurate relative gene quantification in tu-mor and matched normal breast tissue samples for qRT-PCR studies.
REFERENCE GENES FOR NORMAL MATCHED BREAST TUMORS 9
Figure 3. The normalization of GSN gene expression with combinations of candidate reference genes in tumor and matched normal breast samples. The gene expression level of GSN in 23 tumor and normal samples was normalized with respect to an individual RG or combinations of RGs and displayed as a box plot of [(Etarget)∆CtTarget (control-sample)/(Eref)∆CtReference (control-sample)] using matched normal samples as controls. ACTB (A), SDHA (S), GUSB (G), MRPL19 (M), TBP (T), and PGK1 (P) individually or in combina-tions of two or more gene combinacombina-tions of the above RGs are used as NFs. GSN normalization by the lowest ranking RG, IL22RA1 was performed. p-Values were calculated using the paired Student’s t-test (p< 0.05, significant). ACTB, p = 0.003; SDHA, p= 0.009; AS, p = 0.005; ASM, p = 0.008; AST, p = 0.008; ASTP, p = 0.007; ASMG, p = 0.014; ASMGT, p = 0.014; ASTPG, p= 0.010; ASTPGM, p = 0.012; IL22RA1, p = 0.236.
We took the following measures to increase the accu-racy and reliability of our data in this study: 1) matched pairs of normal and tumor breast samples were used for minimization of inter-individual variation and to in-crease the power of data analysis; 2) total RNA was assessed stringently and only the high-quality samples were included in the study; 3) the 18 candidate RGs were simultaneously analyzed with optimized condi-tions; 4) the tumor and normal matched samples were included in the same run in duplicates for a studied gene; and 5) established software combined with statisti-cal analysis was used to rank the candidate RGs for their suitability as NFs. Additionally, we showed that the ex-pression of the RG set in breast tumors did not exhibit differences in terms of grade, ER, or PR status and age of the individuals when normalized to their matched controls. This is important in clinical use because the selected RGs can be used in all malignant samples inde-pendent of the tested clinical parameters.
In this study, we analyzed 15 of the commonly used RGs and 3 newly selected candidates to find out the
most suitable ones as NF for relative gene quantification in paired breast tumor/normal gene expression profiling. The candidate reference genes used in this study have independent functions in cellular maintenance. This is important because the selection of genes that share iden-tical biochemical pathways could bias analysis. To con-stitute the candidate reference gene panel in this study we first searched for the frequently used genes as refer-ences for qRT-PCR studies in breast cancer. While
ACTB, TBP, and GAPDH were commonly used as
nor-malization factor, GUSB, B2M, and PPIA have also been used in breast cancer studies (30–40). As a second ap-proach we identified candidate genes, SDHA, PGK1,
HMBS, HPRT, RPL41, and YWHAZ, as being used in
different studies dealing with the identification of suit-able reference genes for any human tissues in addition to being also recommended by geNorm. We included three more genes, RPLP0, MRPL19, and PUM1, in our study as they were reported to be the stable genes in breast cancers by two other studies that were investigat-ing the endogenous control reference genes for gene
ex-Figure 4. The expression levels of 18S rRNA, ACTB, and SDHA genes in tumor samples compared to their normal pairs. The gene expression levels of 18S rRNA, ACTB, and SDHA in 13 tumor samples were normalized with respect to that of their normal pairs [−∆Ct: −(Ct(Tumor)− Ct(Normal)] and displayed as box plot. The 18S rRNA to ACTB or SDHA mRNA ratio was close to eightfold lower in tumors than that of normals. The significance in this difference was calculated by paired the Student’s t-test. p-Values were found to be 4.2× 10⁻⁵for ACTB versus 18S rRNA and 2.2× 10⁻⁴for SDHA versus 18S rRNA (p< 0.05, significant).
pression normalization in breast cancer (41,42). The genes, TTC22, ZNF224, and IL22RA1, that were se-lected by analyzing the publicly available breast cancer microarray data sets were also included in the panel as new candidate reference genes.
Our findings indicated that raw Ct values obtained from this RG set were highly correlated with each other, although they were not necessarily functionally related. On the other hand, the raw Ct values obtained by using a set of randomly primed cDNA samples showed that although the correlation between two RNA polymerase II transcribed genes, ACTB and SDHA, was still reserved (r= 0.8, p = 0.001), the correlation of expression from either of these two genes with the RNA polymerase I transcribed 18S rRNA gene expression was not signifi-cant (r= 0.034, p = 0.912; r = 0.206, p = 0.499). Con-cordant with these results, the previous studies indicated that a large number of housekeeping genes transcribed by RNA polymerase II behaved similarly among them-selves (29,42), which may explain the possible reason for this correlation.
All the RGs studied here exhibited relatively higher expression in tumors than their normal counterparts. Similarly, it was reported that breast biopsy samples ex-hibited great intra- and interindividual variability and mean expression values of tumors measured in copy
numbers were greater than those of their normal coun-terparts (14). Because of the extensive variability in RG expression, total RNA-based (or mRNA copy numbers when available) normalization was suggested as an NF for tumor samples (1,14). However, because total RNA is represented mostly by rRNA (>90%), even a small decrease in rRNA expression may lead to a dispropor-tional increase in the mRNA pool estimation (49,50). Moreover, studies have shown that rDNA genes were methylated in breast and ovarian cancers when com-pared with those of normal controls (51,52). In fact, our finding of low tumor rRNA to mRNA ratio suggests that normal and tumor samples are heterogeneous in total RNA fractions. We found that 69% of breast tumors (9/ 13) exhibit dramatically lower expression of 18S rRNA compared to their nontumor pairs, while mRNA expres-sion of widely used housekeeping genes ACTB and
SDHA in the same set of tumors was higher (84%, 11/13).
These recent findings suggest that normalization based on a proper set of endogenous RGs obtained from equal amounts of total RNA/input material might be the optimal approach for comparing tumor specimens. Our findings indicated that estimation of mRNA from total RNA represented an important issue requiring further investigation in qRT-PCR studies. Because rDNA hy-permethylation holds considerable possibility in breast
REFERENCE GENES FOR NORMAL MATCHED BREAST TUMORS 11
tumors and total RNA is largely made up of rRNA, the use of poly(A)+ RNA as a starting material may be an-other approach for studying tumor and their matched normal samples.
In order to increase the reliability of the endogenous RG selection process, we analyzed the expression stabil-ity of the 18 selected RGs with two different statistical models: a pair-wise comparison model, geNorm, and an ANOVA-based model, NormFinder. The results ob-tained from the two programs were consistent for the most and least stable gene selection. ACTB and SDHA were found to be the most stable RGs while IL22RA1 was the least stable among the 18 genes selected for these analyses.
Seventeen out of 18 reference genes in our panel dis-played a consistent 1.86± 0.7 (log2, mean± SD) fold
expression difference between breast tumor and normal pairs, suggesting that there might be a more generalized mechanism reflected in the breast samples. One possibil-ity is that all these genes, although with unrelated func-tions and chromosomal locafunc-tions, are upregulated in tu-mors but, considering many of these genes have been reported previously as stable housekeeping genes, such global deregulation is unlikely. Alternatively, tumor and normal samples might consist of heterogeneous rRNA and mRNA compartments affecting estimation of the amount of mRNA from the total RNA pool. In support of this possibility we found that a significant portion of tumors had lower levels of 18S rRNA than normals. Furthermore, recent literature has supported our finding such that RNA hypermethylation has been shown in breast tumors (52).
Recent studies suggested that the variation in the av-erage of multiple genes was smaller than the variation in individual genes. Therefore, it is an optimal approach to use multiple RGs rather than a single gene as NF. Normalization to geometric mean of more than one con-trol gene compensates for outlying values of single RGs in individual samples and may therefore more accurately reflect transcript abundances of target genes (9).
Our results suggested that increasing the number of RGs stabilized the ranks of tumor samples among nor-malized gene expression values yet adding a third gene was not as critical as adding the second gene. This is in accordance with the findings of Vandesomple et al., who state when NFnand NFn+1, where n represents the
num-ber of genes used in normalization, do not significantly differ in their effect, using NFnmight offer a more eco-nomical choice (9). Accordingly, two best genes ACTB and SDHA can be used as NF, and additionally more genes, MRPL19, GUSB, TBP, and PGK1, identified by both programs might be combined with the two best genes to be used as NF.
In the present study, we compared the expression
val-ues of the gelsolin gene by using single or different combinations of the best ranked RGs. When the GSN expression was normalized with ACTB and SDHA alone, the fold change values were significantly correlated with each other, yet the degree of correlation increased when two best performing genes ACTB and SDHA were used as NF. Addition of more best performing RGs (MRPL19,
GUSB, TBP, and PGK1) did not improve the degree of
correlation results more than 1%.
GSN expression is known to decrease in breast
tu-mors when compared with normal breast tissues. The adverse effect of using the least stable RG (IL22RA1) was highly significant, and there was a substantial error associated with the estimation of the relative GSN gene expression in breast tumors compared to their normal counterparts.
Considering that the housekeeping mRNA expression studied here might not actually be unregulated but over-estimated due to a rRNA bias, exclusion of this bias may actually correct the potential underestimation of mRNA amount estimation between tumors and their matched normals. We calculated this possible error as 1.16 (log2
difference) for tumor–nontumor bias from the expres-sion data obtained by using 18S rRNA from randomly primed subset of tumor–nontumor pairs. Seventeen out of 18 RGs in our panel displayed on average, a 1.86-fold expression difference between tumor and normal pairs, of which 1.16-fold might be attributable to rRNA/ mRNA bias. If RG normalization is not performed, then it is likely that GSN expression in tumors would be over-estimated at least 1.16-fold.
Real-time RT-PCR is attractive for clinical use be-cause it can be automated and performed on a variety of tissues, fresh or archived, paired or unpaired. However, accurate quantitative analysis of gene expression levels with qRT-PCR can only be obtained by using appro-priate RGs for normalization procedures. As no uni-versal RG exists, it is inevitable to search for stably expressed genes for normalization purposes in each ex-perimental condition, such as tumor versus normal breast specimens, to get reliable results from relative ex-pression experiments (22,23,27).
The present study focused on identification of RGs for paired tumor/normal breast tissue based on the rank-ing agreement between commonly referred normaliza-tion software, geNorm and NormFinder, and expression results of GSN, a well-known downregulated target gene in breast tumors. Although this panel is highly compre-hensive and consists of frequently used reference genes, they may still not be the best applicable reference genes for breast cancer normalization studies unless there is a bias due to RNA estimation or breast tissue heterogene-ity because all the genes in our panel showed higher expression in tumors than in their normal pairs.
How-ever, ACTB and SDHA were consistently found to be the least variable genes between tumor and normal pairs with two programs, geNorm and NormFinder, in this panel.
In conclusion, our results indicated that normalization of target gene expression levels to a normalization factor consisting of the geometric mean of two best performing genes, ACTB and SDHA, offers increased accuracy and resolution in the relative quantification of gene expres-sion in breast tumors with respect to their matched nor-mal tissues. Future studies are needed to establish the percentage of tumors with such rRNA/mRNA bias and the underlying causes such as methylation patterns of rDNA.
ACKNOWLEDGMENTS: This work was funded by a grant from the Scientific and Technical Research Council of Turkey (SBAG-2355) and supported by Bilkent University.
REFERENCES
1. Bustin, S. A. Quantification of mRNA using real-time re-verse transcription PCR (RT-PCR): Trends and problems. J. Mol. Endocrinol. 29:23–39; 2002.
2. Pfaffl, M. W. A new mathematical model for relative quantification in real-time RT-PCR. Nucleic Acids Res. 29:e45; 2001.
3. Peters, I. R.; Helps, C. R.; Hall, E. J.; Day, M. J. Real-time RT-PCR: Considerations for efficient and sensitive assay design. J. Immunol. Methods 286:203–217; 2004. 4. Bustin, S. A.; Nolan, T. Pitfalls of quantitative real-time
reverse-transcription polymerase chain reaction. J. Bio-mol. Tech. 15:155–166; 2004.
5. Bustin, S. A.; Benes, V.; Nolan, T.; Pfaffl, M. W. Quanti-tative real-time RT-PCR-a perspective. J. Mol. Endocri-nol. 34:597–601; 2005.
6. Stahlberg, A.; Kubista, M.; Pfaffl, M. Comparison of re-verse transcriptases in gene expression analysis. Clin. Chem. 50:1678–1680; 2004.
7. Stahlberg, A.; Hakansson, J.; Xian, X.; Semb, H.; Kubista, M. Properties of the reverse transcription reaction in mRNA quantification. Clin. Chem. 50:509–515; 2004. 8. Livak, K. J.; Schmittgen, T. D. Analysis of relative gene
expression data using real-time quantitative PCR and the 2(-Delta Delta C(T)) method. Methods 24:402–408; 2001. 9. Vandesompele, J.; De Preter, K.; Pattyn, F.; Poppe, B.; Van Roy, N.; De Paepe, A.; Speleman, F. Accurate nor-malization of real-time quantitative RT-PCR data by geo-metric averaging of multiple internal control genes. Ge-nome Biol. 3:0034.1–0034.11; 2002.
10. Schmittgen, T. D.; Zakrajsek, B. A. Effect of experimental treatment on housekeeping gene expression: Validation by real-time, quantitative RT-PCR. J. Biochem. Biophys. Methods 46:69–81; 2000.
11. Zhong, H.; Simons, J. W. Direct comparison of GAPDH, β-actin, cyclophilin, and 28S rRNA as internal standards for quantifying RNA levels under hypoxia. Biochem. Bio-phys. Res. Commun. 259:523–526; 1999.
12. Barber, R. D.; Harmer, D. W.; Coleman, R. A.; Clark, B. J. GAPDH as a housekeeping gene: Analysis of GAPDH mRNA expression in a panel of 72 human tis-sues. Physiol. Genom. 21:389–395; 2005.
13. Selvey, S.; Thompson, E. W.; Matthaei, K.; Lea, R. A.;
Irving, M. G.; Griffiths, L. R. Beta-actin—an unsuitable internal control for RT-PCR. Mol. Cell. Probes 15:307– 311; 2001.
14. Tricarico, C.; Pinzani, P.; Bianchi, S.; Paglierani, M.; Distante, V.; Pazzagli, M.; Bustin, S. A.; Orlando, C. Quantitative real-time reverse transcription polymerase chain reaction: Normalization to rRNA or single house-keeping genes is inappropriate for human tissue biopsies. Anal. Biochem. 309:293–300; 2002.
15. Ke, L. D.; Chen, Z.; Yung, W. K. A reliability test of standard-based quantitative PCR: exogenous vs endoge-nous standards. Mol. Cell Probes 14:127–135; 2000. 16. Valenti, M. T.; Bertoldo, F.; Dalle Carbonare, L.;
Azza-rello, G.; Zenari, S.; Zanatta, M.; Balducci, E.; Vinante, O.; Lo Cascio, V. The effect of bisphosphonates on gene expression: GAPDH as a housekeeping or a new target gene? BMC Cancer 6:49–55; 2006.
17. Chiu, S. T.; Hsieh, F. J.; Chen, S. W.; Chen, C. L.; Shu, H. F.; Li, H. Clinicopathologic correlation of up-regulated genes identified using cDNA microarray and real-time re-verse transcription-PCR in human colorectal cancer. Can-cer Epidemiol. Biomarkers Prev. 14:437–443; 2005. 18. Cerutti, J. M.; Oler, G.; Michaluart, Jr., P.; Delcelo, R.;
Beaty, R. M.; Shoemaker, J.; Riggins, G. J. Molecular profiling of matched samples identifies biomarkers of pap-illary thyroid carcinoma lymph node metastasis. Cancer Res. 67:7885–7892; 2007.
19. Jarzabek, K.; Koda, M.; Kozlowski, L.; Mittre, H.; Sulkowski, S.; Kottler, M. L.; Wolczynski, S. Distinct mRNA, protein expression patterns and distribution of oestrogen receptors alpha and beta in human primary breast cancer: Correlation with proliferation marker Ki-67 and clinicopathological factors. Eur. J. Cancer 41:2924– 2934; 2005.
20. Chao, A.; Wang, T. H.; Lee, Y. S.; Hsueh, S.; Chao, A. S.; Chang, T. C.; Kung, W. H.; Huang, S. L.; Chao, F. Y.; Wei, M. L.; Lai, C. H. Molecular characterization of adenocarcinoma and squamous carcinoma of the uter-ine cervix using microarray analysis of gene expression. Int. J. Cancer 119:91–98; 2006.
21. Nakamura, Y.; Tanaka, F.; Nagahara, H.; Ieta, K.; Hara-guchi, N.; Mimori, K.; Sasaki, A.; Inoue, H.; Yanaga, K.; Mori, M. Opa interacting protein 5 (OIP5) is a novel can-cer-testis specific gene in gastric cancer. Ann. Surg. On-col. 14:885–892; 2007.
22. Jung, M.; Ramankulov, A.; Roigas, J.; Johannsen, M.; Ringsdorf, M.; Kristiansen, G.; Jung, K. In search of suit-able reference genes for gene expression studies of human renal cell carcinoma by real-time PCR. BMC Mol. Biol. 8:47; 2007.
23. Ohl, F.; Jung, M.; Radonic, A.; Sachs, M.; Loening, S. A.; Jung, K. Identification and validation of suitable endoge-nous reference genes for gene expression studies of hu-man bladder cancer. J. Urol. 175:1915–1920; 2006. 24. Ohl, F.; Jung, M.; Xu, C.; Stephan, C.; Rabien, A.;
Burk-hardt, M.; Nitsche, A.; Kristiansen, G.; Loening, S. A.; Radonic, A.; Jung, K. Gene expression studies in prostate cancer tissue: Which reference gene should be selected for normalization? Mol. Med. 83:1014–1024; 2005.
25. Andersen, C. L.; Jensen, J. L.; Orntoft, T. F. Normaliza-tion of real-time quantitative reverse transcripNormaliza-tion-PCR data: A model-based variance estimation approach to identify genes suited for normalization, applied to bladder and colon cancer data sets. Cancer Res. 64:5245–5250; 2004. 26. Fischer, M.; Skowron, M.; Berthold, F. Reliable transcript
REFERENCE GENES FOR NORMAL MATCHED BREAST TUMORS 13
quantification by real-time reverse transcriptase-polymer-ase chain reaction in primary neuroblastoma using nor-malization to averaged expression levels of the control genes HPRT1 and SDHA. J. Mol. Diagn. 7:89–96; 2005. 27. Saviozzi, S.; Cordero, F.; Lo,acono, M.; Novello, S.; Scagliotti, G. V.; Calogero, R. A. Selection of suitable reference genes for accurate normalization of gene expres-sion profile studies in non-small cell lung cancer. BMC Cancer 6:200–209; 2006.
28. Liu, D. W.; Chen, S. T.; Liu, H. P. Choice of endogenous control for gene expression in nonsmall cell lung cancer. Eur. Respir. J. 26:1002–1008; 2005.
29. de Kok, J. B.; Roelofs, R. W.; Giesendorf, B. A.; Pennings, J. L.; Waas, E. T.; Feuth, T.; Swinkels, D. W.; Span, P. N. Normalization of gene expression measure-ments in tumor tissues: Comparison of 13 endogenous control genes. Lab. Invest. 8:154–159; 2005.
30. Folgueira, M. A.; Brentani, H.; Katayama, M. L.; Patrao, D. F.; Carraro, D. M.; Mourao Netto, M.; Barbosa, E. M.; Caldeira, J. R.; Abreu, A. P.; Lyra, E. C.; Kaiano, J. H.; Mota, L. D.; Campos, A. H.; Maciel, M. S.; Dellamano, M.; Caballero, O. L.; Brentani, M. M. Gene expression profiling of clinical stages II and III breast cancer. Braz. J. Med. Biol. Res. 39:1101–1113; 2006.
31. Parr, C.; Gan, C. H.; Watkins, G.; Jiang, W. G. Reduced vascular endothelial growth inhibitor (VEGI) expression is associated with poor prognosis in breast cancer patients. Angiogenesis 9:73–81; 2006.
32. Wu, G.; Xing, M.; Mambo, E.; Huang, X.; Liu, J.; Guo, Z.; Chatterjee, A.; Goldenberg, D.; Gollin, S. M.; Suku-mar, S.; Trink, B.; Sidransky, D. Somatic mutation and gain of copy number of PIK3CA in human breast cancer. Breast Cancer Res. 7:609–616; 2005.
33. Shim, H.; Lau, S. K.; Devi, S.; Yoon, Y.; Cho, H. T.; Liang, Z. Lower expression of CXCR4 in lymph node me-tastases than in primary breast cancers: Potential regula-tion by ligand-dependent degradaregula-tion and HIF-1alpha. Biochem. Biophys. Res. Commun. 346:252–258; 2006. 34. Morse, D. L.; Carroll, D.; Weberg, L.; Borgstrom, M. C.;
Ranger-Moore, J.; Gillies, R. J. Determining suitable in-ternal standards for mRNA quantification of increasing cancer progression in human breast cells by real-time re-verse transcriptase polymerase chain reaction. Anal. Bio-chem. 342:69–77; 2005.
35. Kroupis, C.; Stathopoulou, A.; Zygalaki, E.; Ferekidou, L.; Talieri, M.; Lianidou, E. S. Development and applica-tions of a real-time quantitative RT-PCR method (QRT-PCR) for BRCA1 mRNA. Clin. Biochem. 38:50–57; 2005. 36. de Cremoux, P.; Bieche, I.; Tran-Perennou, C.; Vignaud, S.; Boudou, E.; Asselain, B.; Lidereau, R.; Magdele´nat, H.; Becette, V.; Sigal-Zafrani, B.; Spyratos, F. Inter-labo-ratory quality control for hormone-dependent gene expres-sion in human breast tumors using real-time reverse tran-scription-polymerase chain reaction. Endocr. Relat. Cancer 11:489–495; 2000.
37. Potemski, P.; Pluciennik, E.; Bednarek, A. K.; Kusinska, R.; Kubiak, R.; Jesionek-Kupnicka, D.; Watala, C.; Kordek, R. Ki-67 expression in operable breast cancer: A comparative study of immunostaining and a real-time RT-PCR assay. Pathol. Res. Pract. 202:491–495; 2006. 38. Iwao, K.; Miyoshi, Y.; Egawa, C.; Ikeda, N.; Tsukamoto,
F.; Noguchi, S. Quantitative analysis of estrogen receptor-alpha and -beta messenger RNA expression in breast car-cinoma by real-time polymerase chain reaction. Cancer 89:1732–1738; 2000.
39. Oshiro, M. M.; Kim, C. J.; Wozniak, R. J.; Junk, D. J.; Munoz-Rodriguez, J. L.; Burr, J. A.; Fitzgerald, M.; Pawar, S. C.; Cress, A. E.; Domann, F. E.; Futscher, B. W. Epigenetic silencing of DSC3 is a common event in human breast cancer. Breast Cancer Res. 7:669–680; 2005.
40. Zhang, Z.; Yamashita, H.; Toyama, T.; Sugiura, H.; Ando, Y.; Mita, K.; Hamaguchi, M.; Hara, Y.; Kobayashi, S.; Iwase, H. Quantitation of HDAC1 mRNA expression in invasive carcinoma of the breast. Breast Cancer Res. Treat. 94:11–16; 2005.
41. McNeill, R. E.; Miller, N.; Kerin, M. J. Evaluation and validation of candidate endogenous control genes for real-time quantitative PCR studies of breast cancer. BMC Mol. Biol. 8:107; 2007.
42. Lyng, M. B.; Laenkholm, A. V.; Pallisgaard, N.; Ditzel, H. J. Identification of genes for normalization of real-time RT-PCR data in breast carcinomas. BMC Cancer 8:20; 2008.
43. Turashvili, G.; Bouchal, J.; Baumforth, K.; Wei, W.; Dziechciarkova, M.; Ehrmann, J.; Klein, J.; Fridman, E.; Skarda, J.; Srovnal, J.; Hajduch, M.; Murray, P.; Kolar, Z. Novel markers for differentiation of lobular and ductal invasive breast carcinomas by laser microdissection and microarray analysis. BMC Cancer 7:55; 2007.
44. Richardson, A. L.; Wang, Z. C.; De Nicolo, A.; Lu, X.; Brown, M.; Miron, A.; Liao, X.; Iglehart, J. D.; Living-ston, D. M.; Ganesan, S. X chromosomal abnormalities in basal-like human breast cancer. Cancer Cell 9:121–132; 2006.
45. Rasmussen, R. Quantification on the LightCycler. In: Meuer, S.; Witter, C.; Nakagawara, K., eds. Rapid cycle real-time PCR, methods and applications. Berlin: Springer; 2001:21–34.
46. Asch, H. L.; Head, K.; Dong, Y.; Natoli, F.; Winston, J. S.; Connolly, J. L.; Asch, B. B. Widespread loss of gel-solin in breast cancers of humans, mice, and rats. Cancer Res. 56:4841–4845; 1996.
47. Dong, Y.; Asch, H. L.; Ying, A.; Asch, B. B. Molecular mechanism of transcriptional repression of gelsolin in hu-man breast cancer cells. Exp. Cell Res. 276:328–336; 2002.
48. Winston, J. S.; Asch, H. L.; Zhang, P. J.; Edge, S. B.; Hyland, A.; Asch, B. B. Downregulation of gelsolin cor-relates with the progression to breast carcinoma. Breast Cancer Res. Treat. 65:11–21; 2001.
49. Elberg, G.; Elberg, D.; Logan, C. J.; Chen, L.; Turman, M. A. Limitations of commonly used internal controls for real-time RT-PCR analysis of renal epithelial-mesenchy-mal cell transition. Nephron Exp. Nephrol. 102:113–122; 2006.
50. Spanakis, E. Problems related to the interpretation of auto-radiographic data on gene expression using common con-stitutive transcripts as controls. Nucleic Acids Res. 21: 3809–3819; 1993.
51. Chan, M. W.; Wei, S. H.; Wen, P.; Wang, Z.; Matei, D. E.; Liu, J. C.; Liyanarachchi, S.; Brown, R.; Nephew, K. P.; Yan, P. S.; Huang, T. H. Hypermethylation of 18S and 28S ribosomal DNAs predicts progression-free sur-vival in patients with ovarian cancer. Clin. Cancer Res. 11:7376–7383; 2005.
52. Yan, P. S.; Rodriguez, F. J.; Laux, D. E.; Perry, M. R.; Standiford, S. B.; Huang, T. H. Hypermethylation of ribo-somal DNA in human breast carcinoma. Br. J. Cancer 82: 514–517; 2000.