• Sonuç bulunamadı

Incorporating the surfing behavior of web users into PageRank

N/A
N/A
Protected

Academic year: 2021

Share "Incorporating the surfing behavior of web users into PageRank"

Copied!
85
0
0

Yükleniyor.... (view fulltext now)

Tam metin

(1)

INCORPORATING THE SURFING

BEHAVIOR OF WEB USERS INTO

PAGERANK

a thesis

submitted to the department of computer engineering

and the graduate school of engineering and science

of bilkent university

in partial fulfillment of the requirements

for the degree of

master of science

By

Shatlyk Ashyralyyev

August, 2013

(2)

I certify that I have read this thesis and that in my opinion it is fully adequate, in scope and in quality, as a thesis for the degree of Master of Science.

Prof. Dr. Cevdet Aykanat (Advisor)

I certify that I have read this thesis and that in my opinion it is fully adequate, in scope and in quality, as a thesis for the degree of Master of Science.

Prof. Dr. Fazlı Can

I certify that I have read this thesis and that in my opinion it is fully adequate, in scope and in quality, as a thesis for the degree of Master of Science.

Assoc. Prof. Dr. Pınar Karag¨oz

Approved for the Graduate School of Engineering and Science:

Prof. Dr. Levent Onural Director of the Graduate School

(3)

ABSTRACT

INCORPORATING THE SURFING BEHAVIOR OF

WEB USERS INTO PAGERANK

Shatlyk Ashyralyyev M.S. in Computer Engineering Supervisor: Prof. Dr. Cevdet Aykanat

August, 2013

One of the most crucial factors that determines the effectiveness of a large-scale commercial web search engine is the ranking (i.e., order) in which web search results are presented to the end user. In modern web search engines, the skeleton for the ranking of web search results is constructed using a combination of the global (i.e., query independent) importance of web pages and their relevance to the given search query. In this thesis, we are concerned with the estimation of global importance of web pages. So far, to estimate the importance of web pages, two different types of data sources have been taken into account, independent of each other: hyperlink structure of the web (e.g., PageRank) or surfing behavior of web users (e.g., BrowseRank). Unfortunately, both types of data sources have certain limitations. The hyperlink structure of the web is not very reliable and is vulnerable to bad intent (e.g., web spam), because hyperlinks can be easily edited by the web content creators. On the other hand, the browsing behavior of web users has limitations such as, sparsity and low web coverage.

In this thesis, we combine these two types of feedback under a hybrid page im-portance estimation model in order to alleviate the above-mentioned drawbacks. Our experimental results indicate that the proposed hybrid model leads to better estimation of page importance according to an evaluation metric that uses the user click information obtained from Yahoo! web search engine’s query logs as ground-truth ranking. We conduct all of our experiments in a realistic setting, using a very large scale web page collection (around 6.5 billion web pages) and web browsing data (around two billion web page visits) collected through the Yahoo! toolbar.

(4)

¨

OZET

WEB KULLANICILARIN TARAMA B˙ILG˙ILER˙IN˙IN

PAGERANK ˙ILE B˙IRLES

¸T˙IR˙ILMES˙I

Shatlyk Ashyralyyev

Bilgisayar M¨uhendisli˘gi, Y¨uksek Lisans Tez Y¨oneticisi: Prof. Dr. Cevdet Aykanat

A˘gustos, 2013

B¨uy¨uk ¨ol¸cekli ticari web arama motorunun kalitesini belirleyen en ¨onemli fakt¨orlerden biri arama motorunun buldu˘gu web arama sonu¸clarının kullanıcıya sunuldu˘gu sıralamadır. Modern web arama motorlarında, web arama sonu¸clarının sıralamasının iskeleti sonu¸c sayfaların ¨onemi ve sonu¸c sayfalarının verilen arama sorgusuyla ili¸ski bilgileri bir arada kullanılarak olu¸sturulmaktadır. Bu tez web sayfalarının k¨uresel ¨oneminin tahmin edilmesi ile ilgilidir. S¸imdiye kadar, web say-falarının ¨onemini tahmin etmek i¸cin, iki farklı veri kayna˘gı birbirinden ba˘gımsız bir ¸sekilde ele alınmı¸stır: web sayfalarının arasındaki k¨opr¨u bilgisi (PageRank) ve web kullanıcıların tarama bilgileri (BrowseRank). Ne yazık ki, her iki veri kayna˘gının da bazı sınırlamaları vardır. Web sayfalarının arasındaki k¨opr¨u bilgisi pek g¨uvenilir de˘gildir, ¸c¨unk¨u bu k¨opr¨u bilgisi web i¸ceri˘gi yaratıcıları tarafından kolayca d¨uzenlenebilmektedir ve k¨ot¨u niyete kar¸sı savunmasızdır. ¨Ote yandan, web kullanıcıların tarama bilgilerinin en ¨onemli sınırlamaları seyreklik ve d¨u¸s¨uk web kapsamasıdır.

Bu tezde, yukarıda belirtilen sınırlamaları kaldırmak i¸cin yukarıda bahsedilen iki t¨ur veri kayna˘gının karı¸sımını kullanarak web sayfalarının k¨uresel ¨oneminin tahmin eden model tasarlanmı¸stır. Yahoo! web arama motorunun sorgu g¨unl¨uklerinden elde edilen kullanıcı tıklama bilgilerini ger¸cek sıralama olarak kul-lanan bir de˘gerlendirme metri˘gine g¨ore iki farklı veri kayna˘gının bir arada kul-lanılması sayfa ¨oneminin daha iyi tahmin edilebildi˘gini g¨ostermektdir. Deneyler sırasında ¸cok b¨uy¨uk ¨ol¸cekli web sayfa veri seti (yakla¸sıl 6.5 milyar web sayfası) ve Yahoo! ara¸c ¸cubu˘gu ¨uzerinden toplanan web tarama veri seti (iki milyar web sayfa ziyareti) kullanılmı¸stır.

Anahtar s¨ozc¨ukler : Web sayfa kalitesi, web araması, sıralama, PageRank, BrowseRank.

(5)

Acknowledgement

I would like to express my gratitude to my supervisor Prof. Dr. Cevdet Aykanat for his guidance and insightful suggestions during the past two years. He was patient and tolerant all the time, even when I was on the verge of dropout.

I am also more than thankful to Dr. Barla Berkant Cambazo˘glu for his great contribution and guidance throughout the every step of this thesis. Thanks to him, my vision towards research has completely changed and I have decided to pursue PhD studies.

I am also thankful to Prof. Dr. Fazlı Can and Assoc. Prof. Dr. Pınar Karag¨oz for reading and commenting on this thesis.

Of course, my family: my mom Govherjan Ashyraliyeva and my dad Prof. Dr. Allaberen Ashyralyev, my siblings Assist. Prof. Dr. Maksat Ashyraliyev, Mahri Ashyraliyeva, Merjen Ashyraliyeva, Maral Ashyraliyeva and Gulruh Ashyraliyeva. Without their moral support and the motivating questions they used to ask (e.g., “When are your graduating?” and “How is your research going?”), it would be extremely hard to finish these studies. Moreover, I would like to mention my nephews and nieces: Annageldi, Akmuhammet, Hatyja and Davud. I am also grateful to my ancestors for choosing such a long surname and helping me to extend this thesis with few more lines.

I would like to thank all of my friends, especially Cansu, Eje, Fahrettin, Halil, Sema, Serkan, Tarı and Utku + Can, for simply being great friends.

The last but not the least, I had great colleagues. Special thanks to Salim for drawing funny comics, to permanent high schooler Etkin Barı¸s, to devoted haxball teammates Alper, Sel¸cuk Onur and Erdem, to my “thesis mates” Elif and Beng¨u, to my “cubic mate” Seher and to all members of the secret EA525 group.

(6)

Contents

1 Introduction 1

2 Related Work 5

3 PageRank 8

3.1 Random surfer on a sample Web graph . . . 8 3.2 PageRank definition . . . 11

4 BrowseRank 14

4.1 User Browsing Graph . . . 15 4.2 Continuous-time Markov Model . . . 18 4.3 Stationary probability distribution of P(t) . . . 20

5 PBRank 22

6 Evaluation Metrics 25

6.1 Ground-truth Ranking . . . 26 6.2 Coverage Quality . . . 27

(7)

CONTENTS vii

6.3 Ranking Quality . . . 28

6.3.1 Rank Correlation . . . 28

6.3.2 Query-Dependent Evaluation . . . 31

6.3.3 Our Ranking Quality Metric . . . 33

7 Data and Setup 39 7.1 Computing platform . . . 39

7.2 Handling of URLs . . . 41

7.3 Web page collection . . . 42

7.4 Browsing data . . . 42

7.5 Click data . . . 44

8 Experiments 47 8.1 Optimizing β . . . 47

8.2 In-link versus visit counts . . . 49

8.3 Overlap among data sources . . . 50

8.4 Coverage . . . 51

8.5 Optimizing λ . . . 53

8.6 Comparison of rankings . . . 56

8.7 Contribution of data sources to top k ranks . . . 57

8.8 Spatio-temporal user context . . . 58

(8)

CONTENTS viii

8.10 Largest rank variations . . . 64

(9)

List of Figures

3.1 The hyperlink structure of a sample Web . . . 9

3.2 Removing dangling pages . . . 9

3.3 Jump from a dangling page . . . 10

3.4 Random jumps in PageRank . . . 11

4.1 Session Segmentation in BrowseRank . . . 16

4.2 User Browsing Graph in BrowseRank . . . 17

6.1 Two-dimensional graph and points for the R obtained using sample ρ1. . . 37

6.2 Two-dimensional graph and curve for the R obtained using sample ρ1. . . 37

6.3 φR calculation for sample ρ1 . . . 37

6.4 φR calculation for sample ρ2 . . . 37

6.5 φR calculation for sample ρ3 . . . 38

6.6 φR∗ calculation for sample oracle ranker . . . 38

(10)

LIST OF FIGURES x

7.1 Number of power iterations before convergence for varying values of λ . . . 40 7.2 Distribution of URLs’ clicks counts in web search results . . . 45 7.3 Visit count of a URL in the browsing data versus its click count in

search results . . . 46

8.1 Number of times a URL is visited by following a link versus typing in the navigation bar . . . 48 8.2 Distribution of URL visit counts in toolbar data . . . 49 8.3 Number of times a URL is visited by a user versus it is linked by

another URL . . . 50 8.4 Distribution of all URLs . . . 51 8.5 Distribution of URLs in web data, browsing data and click data . 52 8.6 Φ for different values of λ . . . 53 8.7 Φ for λ near 0 when the unit page importance is used . . . 55 8.8 Φ for λ near 0 when the weighted page importance is used . . . . 56 8.9 Distribution of URL importance scores . . . 57 8.10 Top k URLs in PBRank with λ = 0.01 . . . 59

(11)

List of Tables

4.1 An example user browsing history used by BrowseRank . . . 15

6.1 Rankings of four different rankers and their evaluations . . . 37

7.1 URL Normalization examples . . . 41

7.2 Size of the browsing data . . . 42

7.3 Sample user browsing history used by PBRank . . . 43

7.4 Sample query log . . . 44

7.5 Ground-truth ranking obtained from sample query log . . . 44

8.1 Coverage of URLs . . . 51

8.2 Φ for varying values of λ . . . 54

8.3 Contribution of different data sources to the top k URLs in PBRank 58 8.4 Ranking quality when the ranking model uses browsing data be-longing to users in different countries (United States and United Kingdom) . . . 60

(12)

LIST OF TABLES xii

8.6 The top 40 web hosts for λ = 0.01 . . . 62 8.7 The top 40 web hosts for λ = 1 . . . 63 8.8 The change in the rankings of selected web hosts that are important

according to the browsing data, but not the web data . . . 64 8.9 The change in the rankings of selected web hosts that are important

(13)

Chapter 1

Introduction

With the tremendous expansion of the Internet, searching for an information on the World Wide Web (WWW) became an important topic. To this purpose, hundreds of web search engines have been developed in the last few decades1.

Most of them have failed to survive in the web search engine war because of the high quality search services served by their powerful opponents. The quality of search engines depends on many factors including the speed of the search process and the quality of the returned content. In this thesis, we are concerned with the latter issue, i.e., the quality of the search results returned by the engine for the given search queries.

The quality of search results usually depends on how the user is satisfied with the results. Here, the user satisfaction has various dimensions. One of them is the query-result relevance. User simply expects the results to be relevant to the query as much as possible. The problem of determining the most relevant pages can be resolved using query-dependent features, such as BM25, which are usually used to estimate the degree of relevance between a given query and a document. However, in the context of large-scale web search engines, quantifying only the relevance is not enough because of the following example. Consider a simple web page containing a single word: “Barack Obama”. This page would have a

(14)

perfect relevance with the search query “Barack Obama”. However, if this page is returned as a top result for the search query “Barack Obama”, the end user would not be satisfied with it. This is because there are much better options to be ranked as a top result, such as the Wikipedia page of Barack Obama or latest news about Barack Obama. Therefore, the large size of the Web and high variation in content quality necessitate distinguishing the importance of web pages independent of the query. In our example, since the query-independent importance of the Wikipedia page would be higher than the importance of the simple web page, final results would rank the Wikipedia page in higher ranks than the simple page. To this end, most web search engines incorporate query-independent page importance scores into their ranking algorithms, either as separate features used in machine-learned ranking models [1] or as a linear combination with a query-dependent relevance score [2].

PageRank [3] is perhaps the most well-known and widely used technique for computing web page importance. This technique uses the hyperlink structure of the Web as a data source. It represents the hyperlink structure as a Markov chain, in which a web surfer is assumed to move across web pages following the hyperlinks or occasionally making random jumps. The stationary distribution of this Markov chain, obtained through an iterative process, provides the final im-portance scores of web pages. The basic idea behind this technique is to compute the importance of a web page based on the quantity of the links received from other pages as well as the quality of those referring pages. The former factor is motivated by the assumption that receiving many links from other pages is an indication of good content quality. The latter factor is due to the assumption that important pages tend to link other important pages.

Although PageRank has found many important use cases, there are two se-rious drawbacks in the application of this technique to estimation of web page importance. First, PageRank solely relies on the hyperlink structure of the Web without incorporating any kind of feedback from the real users surfing the Web. Therefore, all pages are treated equally, ignoring their importance for end users or the likelihood of being visited by a web surfer [4]. Second, since the hyperlink structure is mainly created by the web site owners, it is subject to manipulation.

(15)

As an example, link farms can be created to artificially boost the importance of certain web pages, making PageRank vulnerable to link spam [5].

An interesting alternative to PageRank is to exploit the web surfing behavior of users to assess the importance of web pages (e.g., BrowseRank [6]). In this ap-proach, the existing hyperlink structure is completely omitted. Instead, a virtual link structure is created between web pages based on the web browsing patterns of users, i.e., the transitions they make between different pages when surfing the Web. Such patterns can be obtained by mining navigational user activity that is tracked by the toolbar applications, commonly installed in web browsers. This approach provides better quality feedback about page importance and also solves the previously mentioned spam problem associated with PageRank. However, it is not without any drawbacks. In practice, the web browsing patterns extracted from the toolbar logs are very sparse. Even with a toolbar application deployed at web scale, the obtained web browsing patterns can capture only a small fraction of pages in the Web. Hence, many web pages (especially, the less popular web pages) are not covered and their scores cannot be computed.

One of the main objectives of this thesis is to investigate whether combining web and user feedback (i.e., using both web data and browsing data) improves the quality of page rankings over using only one type of feedback. To this end, we define a discrete-time Markov chain constructed by aggregating web and brows-ing data with properly scaled page transition probabilities. Importance scores of pages are estimated using the standard procedure followed in PageRank compu-tations. We refer to the proposed technique as PBRank (PageBrowseRank) since it can be considered as a mixture between PageRank and a discrete-time variant of BrowseRank. We conduct all of our experiments using a very large scale and realistic setting. In particular, we work with a large host-level graph, containing 230 million vertices obtained by processing a 6.5 billion web page collection. We also use a very large toolbar log containing two billion page visits. This work has been accepted for 22nd ACM International Conference on Information and Knowledge Management (CIKM 2013).

(16)

• We propose a hybrid ranking model that estimates the importance of a page by using a mixture of feedback obtained from the hyperlink structure of the Web as well as the web browsing patterns of users.

• We shed light into the overlap between the web data, browsing data, and web search click data as well as the correlation between the importance values assigned to web hosts by these data sources.

• We experiment in a realistic setting with very large data, orders of magni-tude larger than the data used in earlier works in the same problem context. The following are the selected findings of this thesis:

• Exploiting both web and user feedback at the same time improves the qual-ity of the page ranking compared to using only one type of feedback. • Using the web data increases the coverage (the number of web hosts for

which an importance score can be computed) over using only the browsing data.

• When the web and user feedbacks are optimally combined, the user feedback has 99 times more influence on the quality of page rankings than the web feedback.

• We observe little correlation between web data and browsing data and a relatively stronger correlation between browsing data and click data in terms of the importance values they attribute to web hosts.

• It may be useful to customize page ranking models taking into account the location of users.

The rest of the thesis is organized as follows. Chapter 2 explains the related work done on this topic. Two previously mentioned algorithms, PageRank and BrowseRank, are described in Chapter 3 and Chapter 4, respectively. Our pro-posed solution, PBRank, is explained in Chapter 5. Then, in Chapter 6, we explain the proposed evaluation metric we use for the evaluation of PBRank. In Chapter 7, we provide the characteristics of our data together with our experi-mental setup. All experiexperi-mental results are presented in Chapter 8. Finally, we conclude the thesis in Chapter 9.

(17)

Chapter 2

Related Work

PageRank is originally proposed in [3] and used as the skeleton of Google Search Engine1. The technique finds application in a variety of problems from different

domains including bibliometrics [7], web crawling [8], spam detection [9], and NLP [10], besides web search result ranking [1]. HITS [11] and SALSA [12] are two techniques closely related to PageRank. Graph-theoretic techniques are employed in [13] to approximate the PageRank scores. So far, considerable research effort is spent to speed up PageRank computations, either by algorithmic improvements that aim to accelerate convergence [14, 15, 16, 17] or via distributed processing [18, 19, 20]. Interested reader may refer to [21] and [22] for a survey of further issues. A large effort is spent to customize PageRank computations depending on the interests of users. This is mainly achieved by either adjusting the α con-stant, which shows the probability of following a link in the current page, or by customizing the page-specific jump probabilities in the teleportation vector v (see Eq. 3.3). Regarding the first possibility (customizing the random jump probability), several works investigated the effect of α on the quality of the final rankings [4, 23, 24, 25]. The order of pages in the final PageRank vector is found to be heavily affected by the α constant used [25]. The results reported in [24] show that α values close to 1 do not yield accurate rankings. Two latter works

(18)

suggest using α values around 0.5 [23] or in the 0.6–0.725 range [4]. The approach proposed in [4] is relevant to ours in that it relies on the web browsing data to set the α constant.

Regarding the second possibility (customizing the teleportation vector), sev-eral attempts were made [15, 26, 27]. A comparison of three alternative techniques using PageRank for customization is available in [28]. In topic-sensitive PageR-ank [26], in an offline phase, the topics of the pages are determined and separate PageRank vectors are computed for a fixed number of topics. The PageRank computation is biased to yield higher scores for pages belonging to a certain topic by simply adjusting the jump probabilities in the teleportation vector. In the of-fline phase, a user query is mapped to a topic and the value in the corresponding PageRank vector is used in the score computations. In [15], a similar idea is de-scribed, restricting personalization preferences to blocks of web domains instead of topics. This approach is considerably more efficient than using the standard PageRank model for personalization. Nevertheless, the performance is far from generating query-time personalized rankings. In [27], a scalable personalization approach is presented. In this approach, an approximate personalized PageR-ank vector is computed based on precomputed basis vectors. The BrowseRPageR-ank approach [6] relies on web browsing data to customize the teleportation vector.

Our work goes beyond these works in three different aspects. First, in the proposed ranking model, we use web browsing data of users to customize the probabilities in the transition matrix, instead of adapting only the α constant as in [4] or adjusting the probabilities in the teleportation vector as in [6]. In this respect, our model can accurately capture the variation in the quality of the links within web pages, unlike the above-mentioned two works, which assume a uniform probability for following a link in a page. Second, we show the spatio-temporal variation in user browsing behavior and apply our model to this scenario. Finally, we conduct our experiments in a very large setting, orders of magnitude larger than the settings in most previous work.

Previous work on web browsing data. Web browsing data obtained from toolbar applications is used for various other purposes, besides improving

(19)

PageRank. In [29], URLs in the browsing data are used to increase the web coverage of a commercial crawler and the impact of this on the search result quality is demonstrated. Web content change is investigated in [30], restricting the attention to URLs in browsing data. URL revisitation of toolbar users is analyzed in [31]. The concurrent web browsing behavior of users is investigated in [32]. A high-level taxonomy for online browsing behavior of users is presented in [33].

(20)

Chapter 3

PageRank

PageRank is first introduced in [3] and is motivated by the academic citation lit-erature. It exploits the hyperlink structure of the Web to estimate the importance of web pages. PageRank first constructs a link graph using the hyperlink struc-ture of the crawled web pages. Then, it represents the random surfing behavior of web users using a discrete-time Markov chain. Finally, the stationary prob-ability distribution of the above-defined Markov chain becomes the importance of web pages. We would like to explain the basics of the random surfer model using examples and then mathematically describe the PageRank algorithm. Note that, we present PageRank in detail since some of the notation introduced in this Chapter is reused in Chapter 5, where we explain our proposed solution.

3.1

Random surfer on a sample Web graph

WWW is composed of web pages, where a web page is composed of HTML content including hyperlinks to other web pages. A sample Web composed of 5 web pages is given in Fig. 3.1. Now, consider a web user who randomly surfs on the Web by clicking on the hyperlinks. In the rest of this thesis, we call this web user as a random surfer and the clicking process as transportation. Here, we assume that all hyperlinks in a particular web page have same probabilities to be clicked by

(21)

A

D

B

E

C

Figure 3.1: A sample Web composed of 5 web pages: A, B, C, D and E. There are links among web pages, such that, page A links to pages B, D and E; page D links to page E; and pages B and C have mutual links. Dangling page E is highlighted with red.

A

D

B C

Figure 3.2: The solution for dangling pages.

the random surfer. Fig. 3.1 shows the clicking probabilities of all hyperlinks. An obvious problem occurs on the pages containing zero hyperlinks (called as dangling pages). Random surfer stops when reaches a dangling page, because there are no available options for the next step. There is only one dangling page in the sample Web, which is page E and highlighted with red color in Fig. 3.1. One solution for this problem is to remove all dangling pages from the web before then random surfer starts surfing. This is shown in Fig. 3.2. Unfortunately, removing dangling pages from the Web may introduce other dangling pages (i.e., page D). Of course, one may continue removing dangling pages until no dangling page left on the Web, but we do not consider this solution. Instead, we describe another solution for the dangling page problem. We assume that when the random surfer

(22)

A

D

B

E

C

Figure 3.3: The solution for dangling pages.

reaches a dangling page, surfer jumps to any other page on the Web. Moreover, we assume that all pages on the Web have same probabilities to be jumped to. Fig. 3.3 shows how the random surfers jumps to other pages when reaches the page E. In the rest of this thesis, we the jumping process as teleportation.

Although this model seem to serve a perfect environment for the random surfer, there is one last problem. For the sample Web in Fig. 3.3, assume that the random surfer reaches either page B or page C. After that point, the surfer enters a loop and never goes back to pages A, D or E. This is called as a loop problem. In order to overcome loops, we extend the jumping process (defined for dangling pages) to all pages as follows. We assume that when the surfer is on a particular page, the probability that the surfer will click on a hyperlink is α and the probability that the surfer will jump to other pages is (1 − α), where α is in the [0, 1] range. This introduces a possibility of jumping from any page to any other page. Fig. 3.4 shows the jumping probability from the page C.

The model in Fig. 3.4 serves a perfect environment for the random surfer. After fixing the problems in the hyperlink structure of the Web, PageRank de-fines the importance of a particular web page as the probability that the random surfer will be at that page after infinite steps of clicks and jumps. In particular, for α = 0.85 the probability that the random surfer will be at that page A, B, C,

(23)

A

D

B

E

C

α * α * α * α * 1.00 α * 1.00 α * 1.00 (1-α) * 0.2 (1-α) * 0.2 (1-α) * 0.2 (1-α) * 0.2 (1-α) * 0.2

Figure 3.4: Random jumps in PageRank.

D or E after infinite steps of clicks and jumps is 0.05, 0.39, 0.38, 0.07 and 0.12, re-spectively. This means, the importance ranking of the pages is <B, C, E, D, A>, where the page B is the most important page and the page A is the least impor-tant page.

3.2

PageRank definition

As explained in previous section, in PageRank, the computation of scores relies on a probabilistic model known as the random surfer model, where the score of a page is defined by the stationary probability that the surfer will be at that particular page at some time step in the future. This model consists of a Markov chain induced by a random walk on a web graph having n vertices. Each state of the chain corresponds to a different vertex in the web graph. A transition matrix P = (pij) is associated with this chain such that

pij=

(

1/|Li|, |Li| > 0;

(24)

where |Li| denotes the set of out-links of page i. This transition matrix stands

for the probabilities of hyperlinks to be clicked (see Fig. 3.1). Given this transi-tion matrix, the PageRank vector p = (pi), where pi indicates the score of page

i, can be computed by finding the Markov chain’s stationary distribution that satisfies p = PTp, i.e., the principal eigenvector of the chain. The solution can be obtained through a series of iterations of the form pk+1= PTpk using the power method [34]. The existence of a solution, i.e., the convergence of iterations, re-quires the P matrix to be stochastic, irreducible, and aperiodic, neither of which are guaranteed for P.

The reason behind matrix P not being stochastic is the presence of dangling pages with no out-links. Although there are other possibilities [15, 27, 35], the common solution [3, 36] to this problem is to add artificial links from such pages to every other page in the Web. This is exactly the same solution we presented for dangling nodes in Fig. 3.3 and it results in a stochastic transition matrix P0, computed as

P0 = P + dvT, (3.2) where d = (di) is a dangling page vector (if i is a dangling page, di= 1; otherwise,

di= 0) and v = (vi) is a vector, where vi indicates the transition probability from

dangling pages to a specific page i. Typically, the transition probabilities are set equal for all pages, i.e., vi= (1/n), but there are other alternatives as well [37].

The resulting matrix P0 is stochastic, but not irreducible. Applying a similar technique on P0, an irreducible stochastic transition matrix P00 can be obtained, also guaranteeing aperiodicity as

P00 = αP0+ (1 − α)entT. (3.3)

Here, enis a vector of size n containing all ones. α denotes the probability that the

surfer will follow one of the links in the current page while (1−α) is the probability that the surfer will jump to a page that is not necessarily linked by the current page. Again, this is the mathematical representation of the solution presented in Fig. 3.4. In practice, α values between 0.85 and 0.9 are used although this value can be further tuned using feedback obtained from external sources [4, 23]. The

(25)

t = (ti) vector is referred to as the teleportation vector, where ti indicates the

probability of jumping to page i. Typically, this probability is set to 1/n for all pages. In case of personalized or topical teleportation vectors, non-uniform jump probabilities can also be used [26].

(26)

Chapter 4

BrowseRank

In this section we briefly summarize the BrowseRank algorithm presented in [6]. BrowseRank differs from PageRank in two main ways. First, instead of using a link graph based on the hyperlink structure of the Web, BrowseRank mines the user behavior data collected from users and constructs a “user browsing graph”. Second, rather than using a discrete-time Markov process on the link graph, the random walk on the user browsing graph is represented as a continuous-time Markov process and the staying times of users on the pages are taken into account. Moreover, [6] presents an efficient algorithm (i.e., BrowseRank) for computing the stationary probability distribution of this process.

Now, we briefly explain the construction of a user browsing graph, the rep-resentation of a random walk as a continuous-time Markov process, and finally the computation of the stationary probability distribution of this process. For further details of the BrowseRank we refer the reader to [6, 38].

(27)

Table 4.1: An example user browsing history used by BrowseRank.

URL TIME TYPE

http://www.aaa.com/ 2013-01-05, 17:30:05 INPUT http://www.bbb.com/ 2013-01-05, 17:35:56 CLICK http://www.ccc.com/ 2013-01-05, 17:40:45 CLICK

4.1

User Browsing Graph

A user browsing graph constructed by BrowseRank is a weighted graph where vertices represent web pages, directed edges between the vertices represent transi-tions between web pages by users and the edge weights stand for the total number of transitions between corresponding two pages by all users. Additionally, ver-tices are associated with staying times of web users on respective pages and reset probabilities1 (i.e., teleportation probabilities) of those pages.

Web Browsing History. The user browsing data needed for the construc-tion of a user browsing graph is extracted from web browsing history of a user recorded by Internet browsers at web clients. In the web browsing history of a user, each page visit is recorded in triples: URL, TIME and TYPE. Here, URL is the URL of the visited web page, TIME is the timestamp of the page visit, and TYPE is either “CLICK” or “INPUT” depending how user has arrived to the visited page. “CLICK” type occurs when the user clicks on a hyperlink from the previous page and it stands for transportation in PageRank. On the other hand, the page visit type is “INPUT” when the user arrives at the page by manually typing the URL or by clicking a bookmark link. Similarly, the “INPUT” type represents the teleportation in PageRank. An example browsing history of a web user is given in Table 4.1. Note that the rows in the browsing history are sorted in chronological order.

Session segmentation. An obvious problem with this data is the absence of the referring URLs for the records with “CLICK” types, i.e., the page from which a user clicked on a hyperlink is unknown. This problem is resolved by

1The BrowseRank paper uses the term “reset probability” instead of the term “teleportation

probability”. In this chapter, in order to stay consistent with the original paper, we use the term “reset probability”.

(28)

17:30:05 17:35:56 17:40:45

User 1 User 2 User 3

aaa.com bbb.com ccc.com INPUT CLICK CLICK bbb.com eee.com bbb.com ccc.com 18:05:43 18:05:44 18:35:45 18:35:55 INPUT CLICK CLICK CLICK aaa.com ccc.com eee.com fff.com 13:29:10 13:35:40 13:40:45 13:50:46 INPUT CLICK INPUT CLICK aaa.com bbb.com ccc.com bbb.com eee.com bbb.com aaa.com ccc.com eee.com fff.com Session 1 Session 1 Session 2 Session 1 Session 2 ccc.com 05:51 04:49 05:51 00:01 00:01 00:10 00:10 06:30 05:05 10:01 10:01

Figure 4.1: Session Segmentation in BrowseRank.

segmenting the browsing logs of an individual user into sessions. A session is a sequence of consecutive records in the browsing history of an individual user. Records in a browsing history are segmented into sessions using two rules. Type rule: any record with an “INPUT” type is accepted as a start of a new session. Time rule: if there is a 30 minute gap before a record with a “CLICK” type, then the corresponding record is also assumed to be the start of a new session [39].

Staying times. After session segmentation, the staying time on a page is calculated for every page visit. The staying time on a page is defined as the difference between the visit time of the next record within the same session and the visit time of the current record. Obviously, last record of a session needs a special handling. Let p denote the last record of a session. If the session of the

(29)

1

2

Stay time: 12:21 Reset prob.: 0.5 Stay time: 05:00 Reset prob.: 0.25 Stay time: 10:02 Reset prob.: 0.25 Stay time: 11:06 Reset prob.: 0 Stay time: 10:01 Reset prob.: 0

1

1

1

fff.com eee.com bbb.com ccc.com aaa.com

Figure 4.2: User Browsing Graph in BrowseRank.

record that comes after p in the browsing history is segmented because of the time rule, then the staying time on p is randomly sampled from the staying times of the other records in p’s session. Otherwise, the staying time on p is simply the difference between the visit time of a record that comes after p and the visit time of p. Fig. 4.1 shows the session segmentation process and the calculated staying times on the web pages.

Reset Probabilities. One more interesting observation is that the reset probabilities of web pages can be estimated using the browsing records with “INPUT” types. In [6], web pages visited in such records are called as green traffic, because a web page visited by typing its URL is assumed to be safe and important. Moreover, such records perfectly represent the “random jump” (i.e., teleportation) process in the random surfer model. Therefore, frequencies of URLs that appear in records with “INPUT” types are normalized to get the reset probabilities of the corresponding web pages. Fig. 4.1 shows the green traffic using green vertices and Fig. 4.2 shows the reset probabilities of web pages.

(30)

Finally, all sessions extracted from browsing histories of extremely large num-ber of users are aggregated into the final “user browsing graph”. Fig. 4.2 shows the user browsing graph obtained from sample browsing histories of 3 web users given in Fig. 4.1. Here, vertices are associated with total staying times of users on respective pages and the reset probabilities of those pages. Formally, user browsing graph is denoted as G =< V, W, T, σ >, where V = {vi} denotes

ver-tices (i.e., web pages), W = {wij} denotes edge weights (i.e., transition between

web pages), T = {Ti} denotes the staying times on the web pages, and σ = {σi}

denotes the reset probabilities of the web pages (i, j = 1, ..., n). n is the total number of vertices, i.e., |V |.

4.2

Continuous-time Markov Model

Given a web browsing graph, assume that there is a random web surfer surfing on this graph. Let Xs denote the page that the surfer is visiting at time s (s ≥ 0)

and pij(s, t) denote the probability of the following event:

- the transition of the surfer at page i at time s, to the page j at time t (t ≥ s). Consequently, the transition matrix is defined as P(s, t) = (pij(s, t)). Now,

con-sider the following two assumptions based on the notation given above:

(i) Given the current state Xs, then the state after Xs depends only on Xs and

does not depend on any state visited before Xs. This can be clarified as

P (Xt= c | Xs= a, Xu = b) = P (Xt= c | Xs= a) (4.1)

where s, t, u can be any time series satisfying 0 ≤ u ≤ s ≤ t < +∞.

(ii) Surfing behavior does not depend on time points. That is, if the state at time s is Xs and at time s + s0 is Xs+s0 (s0 ≥ 0), then for any t (t 6= s) if

(31)

pij(s, t) = P (Xt = b | Xs = a) = P (Xt−s = b | X0 = a) = pij(0, t − s) (4.2)

which means that the transition probability depends only on the length of the transition period. Therefore, we can use pij(t) (instead of pij(s, t)) to

denote the transition probability from state i to state j with a transition period of time t. Similarly, the transition matrix P(s, t) can be denoted as P(t) = (pij(t)).

While, the first assumption is known as a Markov property, the latter one emphasizes the time-homogeneity property of the process. Given that these two assumptions hold, the web surfing process on the user browsing graph can be represented as a continuous-time time-homogenous Markov process X = (Xs,s ≥ 0).

For a given continuous-time time-homogenous Markov process, one may ob-tain a unique stationary probability distribution π, that does not depend on t, such that for any t > 0,

π = πP or π = PTπ

(4.3)

where PT is the transpose of P and π = (π

i) is a dense vector of size n [40].

The importance of the stationary probability distribution π can be explained as follows. πi stands for the time spent by the surfer on page i (normalized with

the total surfing time), when the total surfing time goes to ∞. Hence, π can be perfectly used as a page importance measure.

(32)

4.3

Stationary probability distribution of P(t)

The question now is, how to compute the stationary probability distribution of P(t)? Before that, we need to obtain the transition matrix P(t) itself. Unfortu-nately, it is a nontrivial job to obtain such information for all possible transition periods. Therefore, BrowseRank algorithm applies the following steps to calculate π:

1. Consider a transition rate matrix Q = (qij) where Q =dPdt|t=0, i.e., Q = P0(0).

In [40], it has been proven that P is differentiable with respect to t and there is a one-to-one correspondence between Q and P, if P’s state space is finite, which is true in our case (i.e, n is finite). Therefore, one may use the Q-process to represent the original continuous-time Markov process X. Here, Q = (qij) and qij= p0ij(0) (1 ≤ i, j ≤ n). Moreover, it is known

that −∞ < qii< 0, and −qii = Pi6=jqij. Detailed analysis of Q-process is

available in [40].

2. Consider an embedded Markov chain (EMC) [41], a discrete-time Markov process, using the matrix Q defined above. EMC is obtained using Q by setting the diagonal positions with 0 values, and non-diagonal positions with the values −qij

qii.

3. According to Theorem 1 in [6], if the stationary probability distribution the EMC (denoted as ˜π) and the entries of the matrix Q are available, then the stationary probability distribution of the Q-process (can be denoted as π due to one-to-one correspondence) can be easily computed as

πi = ˜ πi qii Pn j=1 ˜ πj qjj (4.4) Proof is available in [41].

4. Since, EMC is a discrete-time Markov process, one can calculate its station-ary probability distribution using power method [34]. The only unknown

(33)

part is the entries of Q. An effective method for the estimation of those entries is proposed in [6].

5. To sum up,

- The entries of Q are estimated using the methods proposed in [6].

- A discrete-time Markov process, an EMC, is defined based on those esti-mated values.

- The stationary probability distribution of the above-defined EMC is com-puted using power method.

- The stationary probability distribution of the Q-process is calculated using the entries in Q and the stationary probability distribution of EMC.

Although, BrowseRank employs a sophisticated continuous-time Markov model, the basic idea is that the continuous-time Markov model is converted into a discrete-time model and the conventional methods for the computation of the stationary probability distribution of the discrete-time Markov model are used.

(34)

Chapter 5

PBRank

The main idea behind PBRank is to combine two different types of feedback, i.e., those provided by the web data and browsing data in a meaningful way. Our goal is to come up with a simple extension to the standard procedure summarized in Section 3, leaving the theoretical foundations unchanged. To this end, we use a transition matrix X corresponding to the pages in the union of the web and browsing data. X is a square matrix of size m×m and is expressed as a linear combination of two other matrices of the same size:

X = λP00+ (1 − λ)B00. (5.1)

Here, P00 is an m × m version of the final PageRank matrix used in the power method iterations (see Eq. 3.3), i.e., this matrix is created based on the web feedback. In addition, using the user feedback, we define another matrix B00, which we will describe next. λ is a constant in the [0, 1] range and is used to adjust the influence of one type of feedback over the other. The page importance scores can be obtained by finding the principal eigenvector of X using the power method as usual.

In Eq. 5.1, we form the B00 matrix in a similar fashion to Eq. 3.3:

(35)

where β and r = (ri) are the counterparts of the α constant and the t vector

in Eq. 3.3, respectively. We use biased teleportation probabilities in r, instead of uniformly setting them to 1/n as in t. The teleportation probability ri of a

particular page i is computed as ri=

1 + Ti

m +Pm j=1Tj

, (5.3)

where Ti denotes the number of visits to page i by means other than following

a link in a page. This way, the jumping behavior of the surfer is biased towards more popular pages. Here, we add one to visit counts for smoothing purposes.

Following the idea in [4], β can be computed as β = Pm j=1(Vj− Tj) Pm j=1Vj , (5.4)

where Vj denotes the total visit count of page j. The β constant reflects the users’

tendency to reach a page by following the hyperlinks in web pages. The B0 matrix is computed by the following equation:

B0 = B + dvT, (5.5)

where d and v are defined as before (see Eq. 3.2). The probabilities in the page transition matrix B = (bij) are set depending on the likelihood of a hyperlink

being followed by users. Therefore, the links within a page are not treated equally as in Eq. 3.1. Instead, the transition probability from page i to page j is computed in a biased manner by taking into account the share of the click volume of page j in the overall click volume observed on page i as

bij=

Vij

P

k∈LiVik

, (5.6)

where Vij is the click volume from page i towards page j.

PBRank can be considered as a variant of BrowseRank since both techniques use page visit probabilities extracted from browsing data. In practice, one may

(36)

prefer PBRank to BrowseRank because of the following reasons. First, as we will show later in Section 8, PBRank achieves a better coverage of web pages than BrowseRank due to the use of web data in scoring computations, i.e., a larger number of pages receive non-zero scores. Second, PBRank is a relatively straightforward extension to PageRank. Hence, its implementation is easier than BrowseRank, which employs a relatively more sophisticated continuous-time Markov model. Finally, the transition probabilities computed in PBRank are accurate values computed over actual user clicks on links. The transition probabilities computed in BrowseRank, however, are only approximations be-cause they are computed based on a timestamp-sorted sequence of page visits in user sessions, not the links that are actually followed by users. Given that many users browse the Web by opening multiple browser tabs [32] and concurrently following links in different tabs, a time-ordered sequence of page visits may not be sufficient to obtain the actual transitions between pages. Hence, the transition probabilities computed in BrowseRank may not reflect the true surfing patterns of users.

We note that the existence of a solution is guaranteed since the X matrix is irreducible and aperiodic because both summation terms in Eq. 5.1 already have these properties. When λ = 0 or λ = 1, X may not be row-stochastic, but this does not prevent the convergence of iterations. If λ is set to zero or one in Eq. 5.1, PBRank reduces to a discrete-time variant of BrowseRank or PageRank, respectively. As we will see in Section 8, the best ranking quality will be obtained for λ values close to zero.

(37)

Chapter 6

Evaluation Metrics

One can obtain different ranking techniques using our hybrid ranking model by setting the λ parameter with values in the [0, 1] range (see Eq. 5.1). However, two of those ranking techniques obtained using corner values of the range (i.e., 0 and 1) can be treated as special cases. While the λ = 0 case produces a ranking method that exploits only browsing behavior of web users, the ranking method for λ = 1 case uses only hyperlink information. For any other λ value (0 < λ < 1), our hybrid ranking model generates a ranking technique that uses both types of feedback.

In order to show the effectiveness of combining two types of feedback, we eval-uate our hybrid ranking model by comparing the quality of the ranking techniques for λ in the (0, 1) range with the quality of two ranking techniques for λ = 0 and λ = 1. Thus, if ranking methods for λ in the (0, 1) range perform better than the ranking techniques for λ = 0 and λ = 1, we can argue that combining data sources leads to a better importance ranking. Here, “comparison of the qualities of ranking techniques” needs more detailed explanation.

Our initial motivation to design a hybrid ranking model was to overcome the limitations of using single type of feedback. While the main limitation of exploit-ing only browsexploit-ing data is the low page coverage, the main problem of the hyperlink structure is its vulnerability to malicious intent (i.e., link farms). Therefore, we

(38)

quantify two different aspects of the hybrid ranking model: coverage quality and ranking quality. The former aspect refers to the ability of the hybrid model to compute a non-zero score for many pages. The second aspect refers to the abil-ity of the hybrid model to rank “important” pages at higher ranks. Herein, the actual importance of a web page is taken from the ground-truth ranking which is explained in next Section.

Next three sections describe the ground-truth ranking, the coverage quality metric and the ranking quality metric, respectively.

6.1

Ground-truth Ranking

We define two quality metrics for evaluation purposes of the hybrid ranking model. Both of the metrics rely on a ground-truth ranking of the web pages. We assume that this ground-truth ranking represents the actual importance ranking of the web pages.

The question now is, how to construct a ground-truth ranking? It is a non-trivial job to obtain a reliable ground-truth data for ranking problems. Even so, in our context at least, ground-truth ranking can be generated from several data sources including search result click logs, web browsing logs and web traffic analytics.

(i) Search result click logs. One of the reliable sources for the ground-truth ranking is the click logs of web search results. Here, the click amount of a page in search results stands for page’s importance, i.e., the more a page is clicked in search results, the greater its importance. Although, the click probability of a page in search results depends on the relevance of the page to the search query, the click information, when aggregated over many different queries, gives a notion of fair page importance ranking.

(ii) Web browsing logs. Another ground-truth importance ranking of web pages can be obtained by sorting the pages according to their visit counts

(39)

in the browsing data. The more a page is visited in browsing logs, the greater its importance. Again, note that, the variety of visited pages is highly relevant to the interests of an individual web user. However, as the browsing information is aggregated over many different users, the visit count of a page becomes a reasonable importance measure of the page.

(iii) Web traffic analytics. There are services that monitor the browsing activ-ities of millions of worldwide internet users using different types of toolbars and add-ons for modern internet browsers. Two well-known examples are Quantcast1 and Alexa2. They provide a daily updated ranking of top one

million most popular web sites according to the network traffic. In some sense, this ranking is similar to the ranking obtained from web browsing logs, but it has much larger user community.

Among three options mentioned above, in our context, ground-truth rankings obtained from sources (ii) and (iii) create an unfair bias towards the rankers that directly exploit the browsing behavior of the web users (i.e., rankers for λ < 1). In this work we focus on the impact of the generated page rankings on web search. Therefore, ranking obtained from (i) forms a more natural basis.

6.2

Coverage Quality

In order to evaluate the coverage quality aspect of a given ranking technique we define a page coverage metric χ. A simple motivation behind this coverage metric is to find out the fraction of ground-truth pages which are accessible (i.e., can be positively scored) by the given ranking technique. This fraction can be calculated in a straightforward way. First we introduce some notation, then we formally define the above-explained page coverage metric.

Let ρ denote the page ranking technique and Rρdenote the set of pages which are positively scored by this technique. Similarly, let ρ∗ be an oracle ranker that

1

Quantcast.com homepage, https://www.quantcast.com/

2

(40)

has an access to ground-truth importance values for a set R∗ of pages. Here, R∗ is the set of ground-truth pages and we assume that the oracle ranker computes positive scores for every page in R∗.

Given these definitions, the page coverage χρ of a ranking technique ρ is

defined as

χρ= |R

ρ∩ R|

|R∗| . (6.1)

For example, let ρ1 and ρ2be two ranking methods that rank the following sets of

pages: Rρ1 = {a, b, d} and Rρ2 = {a, e}. Assume that the ground-truth pages are

R∗ = {a, b, c}. Then, we have χρ1 = 2

3 and χ ρ2 = 1

3. Obviously, higher coverage

values indicate better coverage.

6.3

Ranking Quality

Our second evaluation metric quantifies the ranking quality aspect of the hybrid model. Given a page ranking technique ρ and the importance ranking Rρ

pro-duced by ρ. There are several ways to evaluate the quality of Rρ. One approach is to calculate the rank correlation between Rρand the ground-truth importance ranking. Another approach is to combine Rρwith a separate query-dependent

rel-evance ranking (e.g., BM25 [42])and use query-dependent evaluation techniques based on human relevance judgements.

First, we briefly explain well-known evaluation techniques. Then, we state the drawbacks of existing methods and devise our ranking quality metric.

6.3.1

Rank Correlation

Kendall’s tau. Kendall’s τ is a rank correlation coefficient that was first in-troduced by M. G. Kendall in 1938 [43]. It was originally addressed to solve

(41)

the problem of comparing two different rankings (produced by two separate ob-servers) of the same set of individuals. Since significant part of the research in Information Retrieval is concerned with ranked lists of items, τ is widely used in IR as a rank correlation statistic [44].

The correlation coefficient τ varies in the [−1, 1] range. The higher (lower) is the value of τ , the stronger (weaker) is the relevance between two rankings. Thus, τ = 1 occurs when two rankings are exactly same, and τ = −1 occurs when two rankings are exactly inverted.

Correlation is calculated as follows. Let N be the number of individuals, C be the number of pairs of individuals that are in the same order in both rankings, and D be the number of pairs of individuals that are in the reverse order in both rankings. Then, Kendall’s τ is defined as

τ = C − D C + D = C − D N 2  = 2(C − D) N (N − 1)

where the denominator C + D (i.e., the total number of all possible pairs) is used for normalization. As alluded to earlier, when all pairs are in the same (reverse) order in both rankings, D (C) equals to 0, and τ equals to 1 (−1).

As an example, consider a set of four individuals, numbered from 1 to 4, and three arbitrary rankings of those individuals: σ1 = <1, 2, 3, 4>, σ2 = <2, 1, 3, 4>

and σ3 = <4, 1, 3, 2>. It is clear that the distance between σ1 and σ2 would be

much less than the distance between σ1 and σ3. Indeed, τ values reports the same

results: while τ between σ1 and σ2 is 0.66, τ between σ1 and σ3 is −0.33.

Spearman’s footrule distance. Denoted as rs, Spearman’s footrule

dis-tance is simply the l1 distance between two rankings [45, 46]

rs= N

X

i=1

|σ1(i) − σ2(i)|

(42)

rankings, respectively. Unlike τ , the lower (higher) is the value of rs, the stronger

(weaker) is the relevance between two rankings. In order to be consistent with τ , rs can be normalized into the [−1, 1] range.

As an example consider three rankings described for τ ’s explanation. While rs

between σ1 and σ2 is 2, rs between σ1 and σ3 is 6. As expected, distance between

σ1 and σ2 is less than the distance between σ1 and σ3.

Comparing partial rankings. Both of τ and rs operate on fully ranked

lists. Unfortunately, there are cases where comparison techniques for partially ranked lists are required, simply because the full ranking is not available due to ties or because it is very expensive to construct one. In [46], τ and rsare extended

for comparing partially ranked lists.

A partial ranking σ is composed of ordered buckets, where bucket is a set of tied items. σ becomes fully ranked when every bucket contains exactly one item, otherwise it is a partial ranking. In a given partial ranking σ, if a bucket Bi is

ranked higher than some other bucket Bj, then, it is safe to assume that all items

in Bi are ranked higher than all items in Bj.

Let σ1 and σ2 be two partial rankings. For any (x, y) pair of items, consider

the following three cases in which x and y can appear:

(i) x and y are in different buckets in both rankings. (ii) x and y are in same buckets in both rankings.

(iii) x and y are in same buckets in one of the rankings and are in different buckets in the other ranking.

All three cases are penalized with some pre-defined penalties. Penalties are de-fined similar to those which are implicitly used in Kendall’s τ . Let B1(x), B1(y),

B2(x) and B2(y) denote the bucket of x in σ

1, bucket of y in σ1, bucket of x in σ2

and the bucket of y in σ2, respectively. Then, for case (i), τxy0 = 0 (τ 0

xy denotes

(43)

and B2(y), otherwise τ0

xy = 1. For case (ii), τ 0

xy = 0, because x and y are tied in

both rankings. For case (iii), τxy0 = p, where p (0 ≤ p ≤ 1) is a fixed parameter. Finally, total distance between two partial rankings is the sum of all possible τxy0 penalties.

To clarify, consider the following two sample partial rankings σ1 =

<{1, 4}, {2, 5}, {3}>, σ2 = <{2}, {3, 5}, {1, 4}> and take p = 1/2. Pairs that

suit the case (i) are {(1, 2), (1, 3), (1, 5), (2, 3), (2, 4), (3, 4), (4, 5)}, and accumu-late a penalty of 6 in total. There is only one pair that suits the case (ii): (1, 4). Remaining two pairs suit the case (iii): {(2, 5), (3, 5)}. Last two pairs have a penalty of 2 ∗ p = 2 ∗ 1/2 = 1 in total. Total penalty is 6 + 0 + 1 = 7, which is the distance between σ1 and σ2.

6.3.2

Query-Dependent Evaluation

Second evaluation approach simulates the behavior of search engines by combining Rρ with a query-dependent relevance ranking (e.g., BM25 [42]). Then, for a

given set of search queries, search engine’s ability to retrieve highly relevant and important pages is measured. Well-known techniques for such measurements are, but not limited with: Precision at n (P@n) [47], Mean Average Precision (MAP) [47] and Discounted cumulative gain (DCG) [48]. Indeed, BrowseRank is evaluated using these measures.

P@n and MAP. Consider a ranked list of search results for a given query and assume that relevance judgements for all query-result pairs are available. Then, P@n is defined as

P @n = r n

where r is the number of relevant pages ranked among top n pages of the search result list.

(44)

(AP). For a given search query and its ranked search result list, AP is the average of P@n’s computed after retrieval of every relevant page. Then, MAP is the mean of APs of all queries.

DCG. Main property of DCG measure is that it devaluates high-ranked pages (i.e., less valuable pages) by applying discount factors to their relevance scores. DCG is computed as follows. Given a ranked list of N pages and their relevance scores (i.e., gain values). Relevance scores vary from 0 to 3 (3 denotes high relevance, 0 denotes no relevance).

First, ranked list is converted into a gain vector, G0, where each page is re-placed with its relevance score. For example, consider a 5-page search result list in which first page has a relevance score of 3, third page has a relevance score of 2, second and fifth pages have relevance scores of 1, and fourth page is irrelevant (i.e., has relevance score of 0). Then, G0 = <3, 1, 2, 0, 1>.

Next, cumulative gain vector, CG0, is defined as

CG[i] = (

G[1], if i = 1 CG[i − 1] + G[i], otherwise. For the sample G0 given above, CG0 will be <3, 4, 6, 6, 7>.

Finally, we define discounted cumulative gain vector, DCG0, as

DCG[i] =    CG[i], if i<b DCG[i − 1] + G[i] logbi, if i ≥ b.

where the base of the logarithm, b, controls how much a page appearing at a lower rank is penalized. Let b = 2. From sample G0 given above, we obtain DCG0 = <3, 4, 5.26, 5.26, 5.76>.

Normalized-DCG (i.e., NDCG) measure is obtained by dividing DCG0 by DCG0I, where DCG0Iis the discounted cumulative gain vector of the ideal ranking.

(45)

Here, ideal ranking is the ranking where pages with relevance score of 3 are ranked higher than all other pages, pages with relevance score of 2 are ranked higher than all pages with relevance scores of 1 or 0, and pages with relevance scores of 1 are ranked higher than the pages with relevance scores of 0. Ideal ranking of the sample G0 is G0I = <3, 2, 1, 1, 0>.

6.3.3

Our Ranking Quality Metric

Both τ and rs metrics have two important drawbacks. First problem is that

they operate on fully ranked lists. In our case, we have partial rankings (i.e., some pages in ground-truth ranking are not ranked by ρ and vice versa). Second limitation is that these two metrics penalize the ranking errors made in the upper part and lower part of the ranking with the same penalty. In our problem, the correctness of the ranking’s head (i.e., top pages) is much more important than the correctness of its tail. Methods presented in [46] for comparing partially ranked lists also fail to handle the second problem. One more important reason we do not use τ is because of its computational time complexity. A naive algorithm that checks every possible pair of pages has a time complexity of O(N2), where N is the number of pages in the data set. This is is unacceptable in our case where N is around 200 millions. In [49], an efficient method for the calculation of τ is presented. It is based on the Merge Sort algorithm and has O(N log N ) time complexity. Unfortunately, it’s implementation is not straightforward. Therefore, in our evaluations, we prefer not to use τ , rsor their extended versions for partially

ranked lists.

Although P@n, MAP and DCG (or NDCG) metrics that obey the second query-dependent evaluation approach are commonly used in IR, they necessitate user studies to obtain the relevance judgements among search queries and web pages. Instead of using metrics that rely on relevance judgements, we prefer to use fully automated evaluation methods because of the following reason. We conduct our experiments using data sets in the scale of hundreds of millions of web pages (details of the data sets are explained in Chapter 6). In order to satisfy the needs of the experiments on such large data sets, one should perform large

(46)

scale user studies for big variety of search queries. Performing such user studies is very challenging simply because of the human factor. One more reason we do not use DCG (or NDCG) is that it heavily weights the top pages of the ranking and highly devaluates the later retrieved pages. In our case, this is not very meaningful because our rankings are very long and tail pages should not be ruled out. Therefore, in our evaluations, we prefer not to use P@n, MAP or DCG (or NDCG).

Due to above-mentioned reasons we devise our own quality metric that care-fully takes into account the following aspects;

(i) Weight of the penalties given for the errors made in the upper part of the ranking should be higher than those which are given for the errors made in the lower part.

(ii) Popularity of a page (i.e., click count of a page) in the ground-truth ranking should be taken into account.

(iii) Meaningful results should be produced for the rankings with a large number of tail pages (in the scale of hundreds of millions of pages).

(iv) The last but not the least: implementation should not be too complicated and the computational time complexity should be acceptable when the met-ric is used for large scale data sets.

Now, we define a ranking quality metric. Let ρ denote the page ranking technique and Rρ denote the ranking it produces (all pages in Rρ are positively

scored by ρ). Let ρ∗ be an oracle ranker that ranks all pages in Rρ in the best

possible way (“the best possible way” will be explained later). Let R∗ denote the ground-truth ranking, where every page has a positive visit count, i.e., R∗ is a list of pages sorted in descending order of their visit counts.

First, we define a metric CR using recursive function

CR(k) =        0, if k = 0; CR(k − 1) + I(R k), if 1 ≤ k ≤ |R|; CR(|R|), if k > |R|. , (6.2)

(47)

where Rk denotes the k-th ranked page in a given ranking R of pages and I(p)

denotes the page p’s visit count in the ground-truth ranking. We assume that I(p) = 0 if p 6∈ R∗. Here, CR(k) calculates the sum of visit counts of top k pages in R. Moreover, it gives us some hints about the following question: how important are those top k pages in the ground-truth ranking?

Although CR(k) gives us a useful information about the quality of top k pages, it does not report anything about the quality of their rankings. This is explained with the following example. Top k pages in CR(k) can be ordered in k! different ways (i.e., it has k! permutations). CR(k) values for all those orders are equal. Therefore, for a given CR(k) value, it is impossible to make any assumptions about the quality of the ranking of top k pages, just by looking at CR(k). To this end, we devise another quality metric φR that uses CR and is able to quantitatively report both the ranking quality and the importances of the top k pages in R:

φR(k) =        0, if k = 0; φR(k − 1) + CR(k − 1) +I(Rk) 2 , if 1 ≤ k ≤ |R|; φR(k − 1) + CR(k − 1), if k > |R|. , (6.3)

In order to explain the idea behind the φR metric, we visualize it in a two-dimensional graph.

For a given ranking R, we define a two-dimensional graph in which k is plotted on the X axis and CR(k) is plotted on the Y axis. For every possible k (0 ≤ k ≤ |R|), <k, CR(k)> pair corresponds to a single point (denoted as p

k) in the

two-dimensional graph. Here, if I(Rk) = 0, then the point pk is to the east of the

point pk−1, because CR(k) = CR(k − 1). Similarly, if I(Rk) 6= 0, then the point pk

is to the northeast of the point pk−1, because CR(k) > CR(k − 1). Fig. 6.1 shows

the two-dimensional graph and corresponding points for the R obtained using the sample ranker ρ1 given in Table 6.1. Next, for every k (1 ≤ k ≤ |R|), we connect

two points pk−1 and pk with straight line. As a result, we obtain a curve that

starts at p0 and ends at p|R|. This is visualized in Fig. 6.2. Finally, φR(k) equals

(48)

from p0 and finishing at pk.

We note that, the best possible curve (which yields the largest φR value) can be obtained from the ground-truth ranking R∗. Therefore, we assume that the oracle ranker produces a ranking identical to R∗. In the rest of this work, R∗ stands for both ground-truth ranking and the ranking obtained from the oracle ranker.

Before analyzing the effectiveness of this metric, we define the relative quality Φρ(k) of a given ranking Rρ at rank k with respect to the best possible ranking

R∗ as

Φρ(k) = φ

(k)

φR∗(k). (6.4) Here, Φρ is the normalized version of φρ. This is necessary, because it is more convenient to produce numerical evaluation results in the [0, 1] range.

Next, we briefly explain how Φ handles all of the four aspects stated above. The devised Φ metric emphasizes the discovery of important pages (i.e., with high click counts) at early ranks, as the CR(k) continues to contribute to the value of the metric at all ranks following k. This property handles the aspect (i). The aspect (ii) is already handled by CR. The problem (iii) of handling long tails of rankings is also resolved by φ, because the curve of the shorter ranking is extended in the horizontal direction in order to catch the longer rankings’s size. Regarding the last aspect about the implementation simplicity and the computational time complexity, calculation of φ requires a simple linear pass over the ranking R and simple computations. The functioning of φ resembles the ROC analysis and the area under the curve metric [50].

Fig. 6.3, 6.4, 6.5 and 6.6 visualize the φR calculations for the rankings given in Table 6.1. Fig. 6.7 plots the φR calculations of all four rankings on the same plot.

(49)

Table 6.1: Rankings of four different rankers and their evaluations. The ground-truth ranking use is R∗= <a, b, c, d, g>, where ground-truth importances of pages a, b, c, d and g are 100, 60, 30, 5 and 2, respectively.

ρ Rρ φR ρ1 Rρ1= R1= <a, b, e, f, c, d> φR1= 867.5 ΦR1= 0.925 ρ2 Rρ2= R2= <a, d, b, f, e, c> φR2= 797.5 ΦR2= 0.851 ρ3 Rρ3= R3= <e, f, d, c, b, a> φR3= 232.5 ΦR3= 0.248 ρ∗ R∗= <a, b, c, d, e, f > φR∗ = 937.5 ΦR∗= 1.000 0 1 2 3 4 5 6 k 0 100 160 195 C R (k) p6=(6,195) p5=(5,190) p4=(4,160) p3=(3,160) p2=(2,160) p1=(1,100) p0=(0,0)

Figure 6.1: Two-dimensional graph and points for the R obtained using ρ1.

0 1 2 3 4 5 6 k 0 100 160 195 C R (k) p6=(6,195) p5=(5,190) p4=(4,160) p3=(3,160) p2=(2,160) p1=(1,100) p0=(0,0)

Figure 6.2: Two-dimensional graph and curve for the R obtained using ρ1

0 1 2 3 4 5 6 k 0 100 160 195 C R (k) φR(6) = area = 867.5

Figure 6.3: φR calculation for ρ1.

0 1 2 3 4 5 6 k 0 105 165 195 C R (k) φR(6) = area = 797.5

(50)

0 1 2 3 4 5 6 k 0 35 95 195 C R (k) φR (6) = area = 232.5

Figure 6.5: φR calculation for ρ3.

0 1 2 3 4 5 6 k 0 100 160 195 C R * (k) φR* (6) = area = 937.5

Figure 6.6: φR∗ calculation for the oracle ranker. 0 1 2 3 4 5 6

k

0 5 35 95 100105 160165 190195

C

R

(k)

oracle ranker 1st ranker 2nd ranker 3rd ranker

Şekil

Figure 3.1: A sample Web composed of 5 web pages: A, B, C, D and E. There are links among web pages, such that, page A links to pages B, D and E; page D links to page E; and pages B and C have mutual links
Figure 3.3: The solution for dangling pages.
Figure 3.4: Random jumps in PageRank.
Figure 4.1: Session Segmentation in BrowseRank.
+7

Referanslar

Benzer Belgeler

This paper presents a data-centric analysis of commercial on-shore wind turbines and provides actionable insights through analytical benchmarking through Data

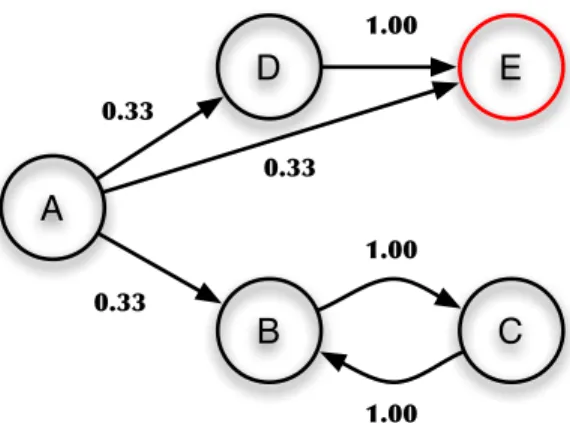
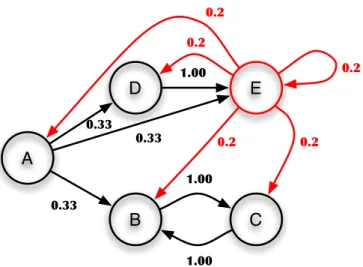
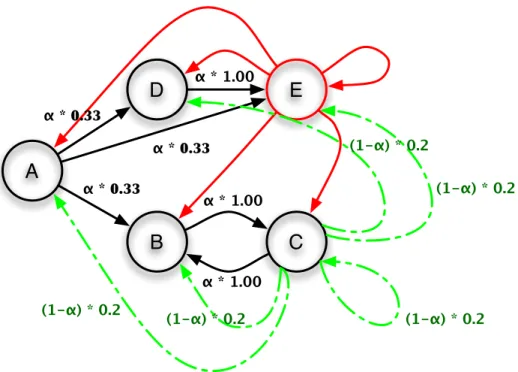
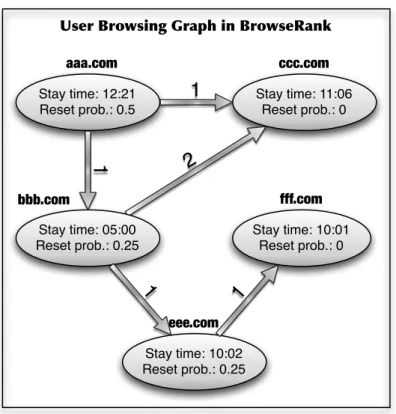
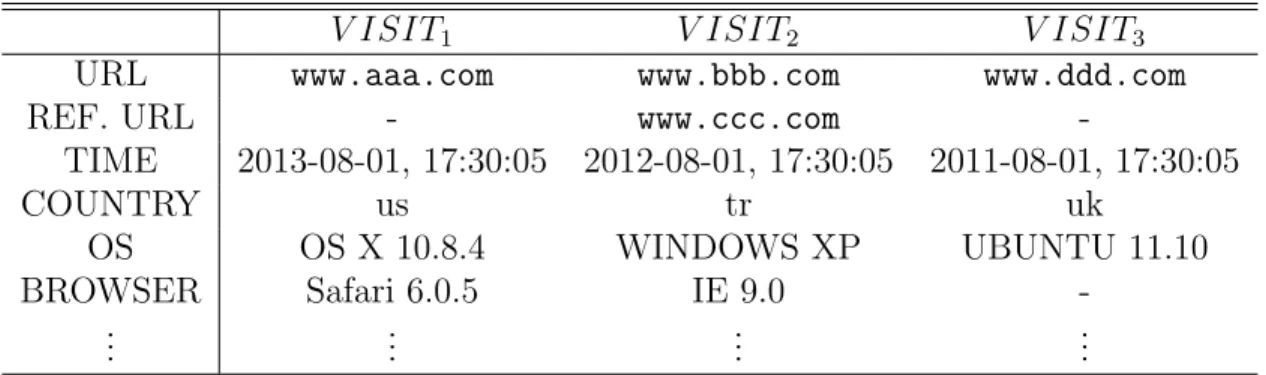
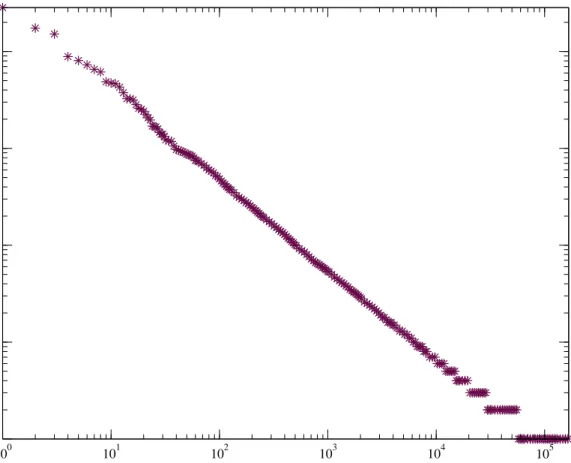
We proposed a novel model for computing web page im- portance scores by using a mixture of the feedback extracted from the hyperlink structure of the Web and the feedback obtained

In the methods we have applied so far in order to determine the relation between the atmospheric temperature and the pressure by using the annual average and amplitude

As far as the method and procedure of the present study is concerned, the present investigator conducted a critical, interpretative and evaluative scanning of the select original

To create the graphs of the existing variables, go to the graph drop-down menu and choose bar option and click simple option in the bar chart box (See Figure 6) and then

yaşgünü mutluluğunu Başbakan Ozal, ken­ disini salon girişinde karşılayan gazetemiz sahibi Erol Si- mavi’yi öpüp, ‘Kutlarım.... Buruk gece,

Beyaza boyanan Karadeniz yolcu gemisi İstanbul’dan ayrıldık­ tan sonra önemli limanlara uğraya­ rak Akdeniz’i aşacak, sonra da Ce­ belitarık’tan Atlantik’e

CBT’s Interest Rate Announcements – Original EDDS Access Counts Upper: Difference between Pre-event – Post-event Levels.. Lower: Difference between Pre-event –