59
Dokuz Eylül Üniversitesi Denizcilik Fakültesi Dergisi
Cilt:3 Sayı:2 2011 CENTENNIAL DECLINE OF SHIPPING FREIGHT RATES AND LIFE
CYCLE EFFECT: THEORY OF LONG TERM CYCLES♣♣♣♣
Okan DURU1 Shigeru YOSHIDA2
ABSTRACT
This paper reviews theories on centennial decline of the shipping freight market in the nineteenth century period and investigates the causes of great downturn. In the history of maritime transportation, the nineteenth century has a particular importance since the cost of shipping service collapsed to a historical depth in the 300 year horizon. Many scholars investigated this phenomenon and proposed theories to clarify possible reasons for the long term decreasing trend in shipping freights. Most of the propositions are based on technological improvements and their secondary influences. However, the twentieth century was a scientific and technological boom in the history of mankind and productivity gains on shipping service have not been deducted, as it is indicated in theories for the previous century. This paper extends the literature by investigating previous works and discusses the long term effects of life cycles.
Keywords: Freight rates, life expectancy, economic history. ÖZET
Bu çalışma dünya deniz ticaretinde navlun fiyatlarının 19. yüzyılda yaşamış olduğu yüzyıllık düşüşün sebeblerini incelemektedir. Son 300 yıl içerisinde deniz ticaretinde en derin ve tarihi bir daralmanın gerçekleşmiş olması nedeniyle, 19.yüzyıl deniz ulaştırma tarihinde hususi bir yere sahiptir. Bir çok araştırmacı bu dönemi incelemiş ve uzun dönem düşüşün muhtemel nedenleri hakkında çeşitli teoriler ortaya atılmıştır. Değerlendirmelerin büyük çoğunluğu teknolojik gelişmeler ve onların ikincil etkileri üzerine yoğunlaşmaktadır. Ancak, 20. yüzyıl insanlık tarihinde teknolojik gelişmeler noktasında 19. yüzyıla nazaran çok daha geniş kapsamlı bir dönem olup, bir önceki yüzyılda deniz ticaretine olan etkileri yönündeki değerlendirmelere karşın, navlun fiyatları tarihi bir çıkış trendi yakalamıştır. Bu çalışma önceki tespitleri incelemekte ve özgün olarak ‘yaşam döngüsü’ teorisinin bu çerçevedeki uzun dönem etkilerini değerlendirmektedir.
Anahtar kelimeler: Navlun fiyatları, ortalama yaşam süresi, ekonomi tarihi.
♣
An earlier version of this paper is presented at IAME 2010 Conference (July 7-9, 2010) held in Lisbon, Portugal.
1
Research Fellow, ITU Maritime Faculty, Department of Maritime Transportation and Management Engineering, [email protected].
2
Professor, Kobe University, Graduate School of Maritime Sciences, Maritime Logistics Science, [email protected].
60
INTRODUCTIONThe importance of seaborne trade is indicated by several studies (Metaxas, 1971; North, 1958; Jacks, Meissner and Novy, 2009 among others). The value of seaborne trade is calculated by how much cargo is transported in how much distance between two seaports. Productivity of shipment will depend on quantity of cargo and navigating distance. These two main items are affected by various factors including economics, politics, geographical boundaries, warfare, weather conditions etc. Increasing stability on global politics triggers trading activities until the shipping industry steps up to enhance facilities and capacities. On the other hand, seasonal factors may change direction and boost wider navigating durations and distances (i.e. hurricanes, tsunami). However, productivity changes in the long run are based on more extensive elements of world merchandise trade. Such an analysis should be performed by a broader perspective which is enriched by all economic, political, technological and historical domains.
One of the critical instruments of this analysis is proper and quality statistics on seaborne trade. In literature of economic history, statistics for shipping volume and transportation costs are presented and investigated by various studies (Isserlis, 1938; North, 1958; Harley, 1988 among others). By the presentation of proper data, we concluded that shipping played a key role in economic development. The reasons for freight rate fluctuations are discussed in order to understand such economic interactions and results.
Foreign trade balance is generally based on import and export activities. However, there is an unaccounted item, which is the service of overseas transportation (Isserlis, 1938). There is no doubt that shipping is a key indicator in international trade and its cost is a part of retail prices. Fluctuations on shipping freights still influence prices on finished goods as they did previously. The structure and terms of shipping freights are classified into two main divisions, which are voyage domain pricing and time domain pricing. Voyage domain pricing – named voyage charter – includes all fixed and variable costs of shipment such as operation costs, port dues, agency fees, brokerage commissions, financing costs etc. On the other hand, a time domain pricing – named time charter – only consists of fixed costs such as financing costs, daily mandatory expenses (i.e. manning, victualling) and so on. If a trading price of a product is declared as CIF (cost, insurance, freight), it also reflects transport cost factor to some degree.
Various shipping companies, exchanges and governmental institutions keep freight rate records and also several freight indices are published for average of the market and for a specific ship size. History of freight rate is investigated by many scholars and the theories on shipping productivity are indicated according to several hypotheses (Harley, 1988; North, 1958; Mohammed and Williamson, 2004). Particularly on long distance transportation, shipping cost is as crucial as it was in the 18th and 19th century. However, capacity of shipment was highly limited,
61
speed of service tied to proper seasonal winds and cargo traffic single way took longer than both directions do today (i.e. Atlantic trades). Under the conditions of these various factors, shipping service evolved. Freight rates are broadly affected from the particulars of maritime transportation characteristics.
The present research discusses shipping productivity and compares economic thinkers based on their inferences and contributions. Furthermore, the effect of life expectancy on shipping freight rates is discussed.
SEMINAL WORKS AND THEIR CORRESPONDING THEORIES Preliminary works of Leon Isserlis
In 1938, Leon Isserlis published his outstanding study “Tramp shipping cargoes and freights” and provided one of the noteworthy sources of freight market fluctuations. As an important statistician, he served the Chamber of Shipping, UK and compiled several freight rate data which mainly benefited Angier (1920). His assessments pointed out cycles of warfare in the Franco-German War, the African War and World War I. Although Isserlis supplied freight rate index for a critical turning point of the world, these indices are criticised by many scholars due to the lack of suitable number of fixtures and unnecessarily overweighting of some routes (Mohammed and Williamson, 2004; Veenstra and Dalen, 2008 among others). Gathering this information with previous records and inferring reasons of longer term fluctuations remained for contemporary researchers such as North (1958) and Harley (1988).
Institutional improvement thought of Douglass North
Douglass North (1958) attempted to extend the recent freight market knowledge by superimposing freight rate of British Import and American Export data. According to Douglass North, the decline of freight rates in the nineteenth century was formed by three main factors of shipping productivity: Increasing
efficiency of freight markets, Technological innovations and Development of external economies.
The nineteenth century is crucial in terms of communication technology. Increasing availability and speed of telegraphy facilities ensured proper and timely communication between ship-owners, charterers and also masters of ships. Imperfect market condition (Fama, 1970) was mitigated and uniformity in the movement of rates was partly maintained by increasing availability of overseas negotiations.
Another indication is reported with respect to technological improvements. Both steam power usage and metallurgical revolution improved stability for higher carrying capacity ships and rapid service even in the lack of winds for sail
62
propulsion. Resistance for stronger sea conditions is obtained. Hull and engine technologies led to safer navigation and prevented loss of property (i.e. due to piracy attacks).
North (1958) also concluded an important aspect of the post-discovery term for the world, which is the presence of cargoes for returning to homeports named backhaul cargoes. After the industrial revolution, both in North American and Asian destinations, exporting products were supplied and backhaul cargoes could be carried on a highly competitive price as compared with ballast voyages of empty cargo holds. New regions expand in population and income with new export trades and further export products were implemented.
North (1958) extended our knowledge about the long term decline of freight rates in the nineteenth century and the freight rate data stretches until the beginning of the twentieth century. Later these data are judged by Harley (1988) because of the technical particulars of cotton loads.
Technological improvement thought of C. Knick Harley
C. Knick Harley (1988) pointed out that the main source of increasing productivity is metallurgical development, which was broadly improved by industrial revolution. His argument concludes that technological improvements provided stronger hull designs (i.e. metal ships), increasing capacity of ships and service speeds (i.e. steamship technology). Therefore sea transport ensured productivity gains due to technical performance.
Harley (1988) indicates that North’s freight rate data for cotton trades has an important shortcoming since the packaging technique of cotton bags has changed. Compressing cotton into the bags provides additional transport volume and the cost of carriage is lesser per tons of cargo. In this way, capacity decreases from 20-25 pounds per cubic foot to 8-12 pounds per cubic foot. It is almost twice that of previous measures. North’s evidence for the sharp decline at the beginning of the nineteenth century arose mainly by such technical metamorphosis. In spite of a long term moderate decline in the rates, it was not expected to deepen – as indicated for the first half of the 1800s.
Harley (1988) summarises reasons of freight rate decline on six items: • Innovation of steamships against the sailing ships.
• Opening of Suez Canal and superiority of steamers on Asia-Europe transport. Larger sailing ships are usually not suitable for Red Sea navigation because of lack of proper winds.
• Metallurgical technology provided safer ship design, decreasing number of crew, lessening loss of ships, and increasing capacity of cargo space. • Increasing productivity on steel industry reinforced the shipbuilding industry
63
• Packaging technology ensured increasing use of transport volume. • Presence of tugs supported manoeuvrings of larger steamers in the port.
Furthermore, there is the unavoidable factor of warfare. The eighteenth century witnessed substantial warfare including the War of the Austrian Succession (1740-1748), the Seven Years War (1756-1763), the War of American Independence (1776-1783), and the Wars of the French Revolution and Napoleon (1793-1815). Compared with the nineteenth century, the eighteenth century had a stronger effect of warfare on international trade. Therefore, it was not safe for navigation, and increments for war risks were incurred on the rates of shipping transport.
Recent contributions
Kaukiainen (2001) reported research about the transmission of information and influences of electric telegraph. After the 1820s, information transfer speed and coverage are broadly developed and communication has been available for intercontinental transmissions as well. Increasing distribution of information ensured efficient use of commercial news, meteorological records and port facilities. Thus, circulation of freight rates and nominated cargoes is easily performed in several locations including both sides of Atlantic and Indian trades. “Communication technology” is noted once more as one of the critical reasons for freight rate decline.
O’Rourke and Williamson (2002) examined the “Globalisation” issue including a long history of international trade. About the freight market, they pointed out the globalisation effect and increase in international trade. By the establishment of free trade and commercial collaboration between various trading routes, efficiency of markets was increased markets, providing competitiveness in shipping service.
Jacks (2005) investigated international commodity market integration in the Atlantic economy under the global developments of 19th century. He reported issues concerning price fluctuations and trade costs. An important indication is presented about the freight market. Freight rates slackened in the 19th century because of the increasing bilateral trades among the America and Europe-Asia routes as well as technological developments. During several centuries, trade flows are characterised by the single direction transport and ballast voyages (empty cargo holds) are steered for backing to product sources. The industrial revolution influenced many countries including developing continents such as Americas and Asia. Manufacturing facilities are developed and products are available for exporting. Merchant ships are loaded on both directions and free spaces are utilised well. “Bilateral utilisation” provided reduction on cost of shipping.
64
OVERVIEW OF CONTRIBUTIONSOne of the most cited issue in economic history is the decline of freight rates in the 19th century and its influences on global trade. Although wholesale prices increased in the same period, shipping costs distinctly exposed a long term decline. Many economic philosophers developed theories about the decline of freight rates and they mainly indicated rise of shipping productivity for several reasons. In order to build a wide perspective, I want to summarise and extend these theories.
First of all, the political, economic and structural differences between the 1700s and the 1800s should be defined. Analysis is based on investigation of ‘efficiency of freight markets’ and ’technological capability of shipping service facilities’. Although concentration is on two main issues, one more item should be expressed, which is the opening of Suez Canal.
Efficiency of Freight Markets
Concerning the condition of free trade, Navigation Acts (1660 and 1696) of the British Empire have critical importance. Navigation Acts regulate shipping from and to British states. According to the Acts;
• Only British ships could transport imported and exported goods from the colonies.
• The only people who were allowed to trade with the colonies were British citizens.
• Commodities such as sugar, tobacco, and cotton wool which were produced in the colonies could be exported only to British ports.
These regulations restricted flexibility of the fleet and discriminated other countries’ fleets. Therefore, the available shipping fleet term is different than today. Although probably there is suitable number of tonnages, supply of shipping service is partly regulated. The case of Navigation Acts continues till the end of 1700s. In the second half of 18th century, the British had fallen in several wars and the Navigation Acts are loosened. In spite of the official declaration of free trade in 1849, shipping service gained its freedom by the revolutions.
When passing from 18th century to 19th century, one of the critical discriminations of sea trade is collapsed. The effect of Navigation Acts presumably can not be avoided. Notably, the Napoleonic Wars dissolved the discrimination and both Atlantic and Levant trades gained competitiveness. The downturn of the Ottoman Empire also contributed by releasing Levant trading routes.Another important improvement arose from the ’Bilateral Trading Pattern’. Particularly in the Atlantic case, shipping service is mainly employed on single-way trades from Europe to Americas before the 19th century. However, the Industrial Revolution
65
brought several opportunities for Americas to improve manufacturing activities, while external economies contributed to transportation industry. The technological improvements of the Industrial Revolution (which will be discussed in the next section) ensured the production of some backhaul cargoes from the Americas to Europe and from Indies to European trades. Ships have chosen to be loaded for backing routes at a competitive price. Freight rates would be balanced on both directions day by day. Marginal discounts existed on long distance shipments. Technological Capability of Shipping Service Facilities
By the Industrial Revolution, shipping industry had gained productivity through three main tracks: the first was the development of steam power on merchant ships, the second was the development of steam power on manufacturing industries, and the third was metallurgical innovations.
Steam power provided an exclusive superiority, and ships were available to navigate more safely, rapidly and with increasing cargo capacity. It was very valuable for both Atlantic and Indian routes. By the steam powered industries on both sides of Atlantic, ships were loaded for both directions. Manufacturing and export products have been raised in Americas and empty spaces of ships could be loaded with reasonable low costs. Metallurgical improvement of hulls provided larger, stronger and higher capacity merchant fleets. These ships were also less costly in the manning. Rather than a highly specialised sail ship operation, metal steam ships are easy to operate and crew size declined. Communication technology is another critical improvement which develops efficiency of freight markets by exchanging commercial information. By the 1800s, port and shipping news were distributed more quickly and intercontinental telegraph communication increased competitiveness of negotiations. Also, both ports and fleet were better utilised.
One of the most fascinating geographical technologies should be the opening of the Suez Canal. In 1869, the Suez Canal had begun service for merchant shipping and the canal provided shorter voyages to Indies. However, in the time of opening and later during the closure issues of the 20th century, effects of Suez canal was not larger than a regular freight rate cycle. Quantitative measures of this issue will be discussed in the next section.
LIFE CYCLE AND INFLUENCES
A recent study of Duru and Yoshida (2010) provided a long term freight rate index (here-after LFI) through combination of unweighted average growths of several freight rate data (See appendix). LFI is based on dry cargo and general cargo (before 1950s); shipping records which are mainly derived from various cited papers. Table 1 presents the source of time series data for establishment of LFI. LFI series has long term data (267 years) starting from 1741 and ending in recent records. Combination of several dataset is performed by using
66
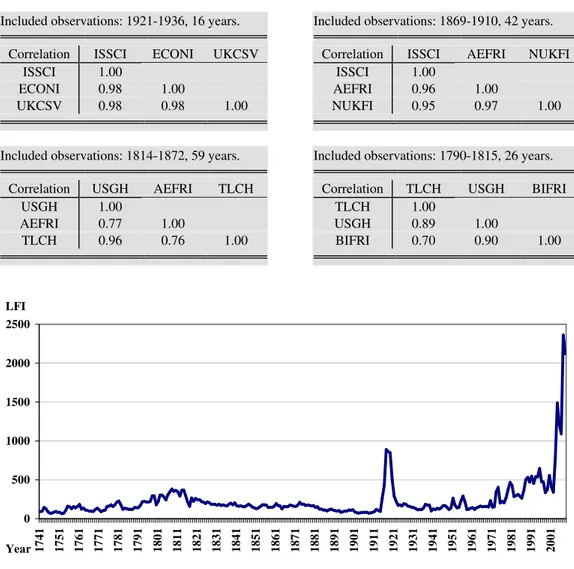
interconnected periods of data. Table 2 shows correlation indices among the various datasets and results indicate that the dataset has a high correlation in most areas. Therefore, it is possible to connect a series by averaging ratio-to-change fluctuations and applying them to an initial value, 100.Such a long term record ensures comparative analysis between several centuries. Fig. 1 indicates the LFI dataset and it is clear that there is a two-century cycle in the 1700s and 1800s. A hundred-year upturn follows the previous cycle. The supercycle of WWI is well noted.
Table 1. Description of data used in LFI.
Term Description Code
Source Freight rates & indices
1741-1872 Tyne - London Coal route freight rate series. TLCH Harley (1988)
1741-1872 U.S. - British Grain route freight rate series. USGH
Harley (1988)
1790-1815 British Import Freight Rate Index series. BIFRI
North (1958)
1814-1910 American Export Freight Rate Index series. AEFRI
North (1958)
1869-1936 Isserlis Composite Index series. ISSCI
Isserlis (1938)
1869-1913 New UK Index series. NUKFI
Klovland (2002)
1898-1913 Economist’s Freight Index series. ECONI
Yoshimura (1942)
1921-1939 Economist’s Freight Index series. ECONI
Yoshimura (1942)
1920-1969 UK Chamber of Shipping Index series. UKCSV
Isserlis (1938), Hummels (1999
1948-1997 Norwegian Shipping News Voyage Freight Index series. NSNVI Hummels (1999)
1948-1990 Norwegian Shipping News Time Charter Index series. NSNTI Hummels (1999)
1952-1989 UK Chamber of Shipping Time Charter Index series. UKCST Hummels (1999)
1986-2008 Baltic Freight Index / Baltic Dry Index series. BFI/BDI Baltic Exchange Co., London; Hummels (1999).
1988-1996 German Ministry of Transport Time Charter Index series. GMTTI Hummels (1999)
1991-2007 Lloyd’s Shipping Economist (LSE) Tramp Index series. LSEFI LSE Magazine various issues.
Deflator series
1741-1954 Price of Composite Unit of Consumables. PUCON
Brown & Hopkins (1956)
1954-2008 RPI: Retail Price Index of U.K. RPIUK
67
Table 2. Correlation matrix for consequent freight rates/ indices.
Included observations: 1991-2007, 17 years.
Correlation LSEFI BDI
LSEFI 1.00
BDI 0.99 1.00
Included observations: 1986-1997, 12 years.
Correlation NSNVI BDI
NSNVI 1.00
BDI 0.98 1.00
Included observations: 1952-1989, 38 years. Correlation NSNVI NSNTI UKCST
NSNVI 1.00
NSNTI 0.94 1.00
UKCST 0.88 0.95 1.00
Included observations: 1948-1969, 22 years. Correlation NSNVI NSNTI UKCSV
NSNVI 1.00
NSNTI 0.97 1.00
UKCSV 0.96 0.99 1.00
Included observations: 1921-1936, 16 years. Correlation ISSCI ECONI UKCSV
ISSCI 1.00
ECONI 0.98 1.00
UKCSV 0.98 0.98 1.00
Included observations: 1869-1910, 42 years. Correlation ISSCI AEFRI NUKFI
ISSCI 1.00
AEFRI 0.96 1.00
NUKFI 0.95 0.97 1.00
Included observations: 1814-1872, 59 years.
Correlation USGH AEFRI TLCH
USGH 1.00
AEFRI 0.77 1.00
TLCH 0.96 0.76 1.00
Included observations: 1790-1815, 26 years.
Correlation TLCH USGH BIFRI
TLCH 1.00 USGH 0.89 1.00 BIFRI 0.70 0.90 1.00 0 500 1000 1500 2000 2500 17 41 17 51 17 61 17 71 17 81 17 91 18 01 18 11 18 21 18 31 18 41 18 51 18 61 18 71 18 81 18 91 19 01 19 11 19 21 19 31 19 41 19 51 19 61 19 71 19 81 19 91 20 01 Year LFI
68
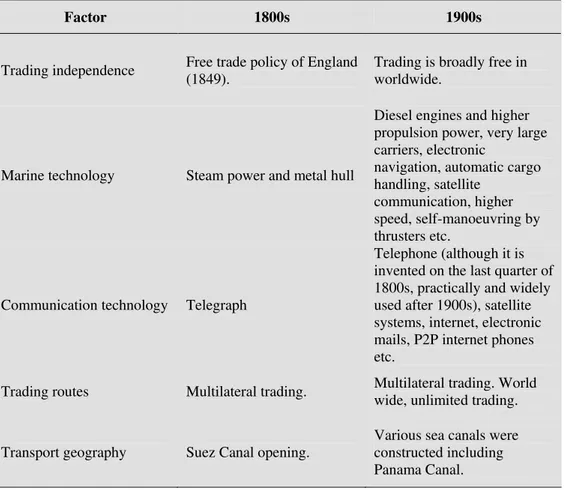
The 18th century has a long term increasing trend and higher volatility relative to the 19th century. In the 19th century, a long term decline exists and volatility is broadly dampened. Finally, the 20th century brings a long term upturn with highly volatile rates. The main concentration of comparative analysis will be between the 19th and 20th centuries. We listed several reasons for the decline of freight rates. However, many similar cases exist in the 20th century and their results are the major emphasis. Table 3 point out some important particulars of the two centuries. The 19th century is the long term downturn period and the 20th century is the long term upturn period. The concern is whether conditions are really changed. One of the most noted particulars of the 19th century are the technological improvements. Nevertheless, the 20th century recorded innovations boom such as was never previously seen. Steam power was displaced by diesel engine; both the size and speed of merchant ships are exponentially increased3.Port technologies have also ensured high speed operations.
Table 3. Comparison of leading factors between centuries.
Factor 1800s 1900s
Trading independence Free trade policy of England (1849).
Trading is broadly free in worldwide.
Marine technology Steam power and metal hull
Diesel engines and higher propulsion power, very large carriers, electronic
navigation, automatic cargo handling, satellite
communication, higher speed, self-manoeuvring by thrusters etc.
Communication technology Telegraph
Telephone (although it is invented on the last quarter of 1800s, practically and widely used after 1900s), satellite systems, internet, electronic mails, P2P internet phones etc.
Trading routes Multilateral trading. Multilateral trading. World wide, unlimited trading.
Transport geography Suez Canal opening.
Various sea canals were constructed including Panama Canal.
3
For a detailed information about shipping technology development, please refer to Stopford (2009).
69
As it is indicated in table 3, the 20th century ensured several technological improvements and also freedom of trade was extended in world wide circumstances. Even these contributions are quite more than in the previous century. However, a possible decline of freight rates was not recorded in the long term. These indications lead us to review the great recession phenomenon with other evidences. The following section points to this issue and introduces life cycle theory and its inferences.
Life cycles and shipping trade
The number of consumers is a key factor in production industry and it influences price of goods and service accordingly. Shipping freights represent a considerable proportion of the price of finished goods, so shipping freights and wholesale prices have a strong relationship in the global economy (Metaxas, 1971). The effect of population is somewhat complicated since many high population countries can not contribute to developing wealth of nation. The definition of consuming population is crucial. Consuming particulars of population depend on wealth and quality of life among the whole members of community. Increasing life quality is followed by increasing life expectancy on every level of age. Particularly, its impacts are expected to be long term.
Life expectancy is used for many econometric models and it defines several economic dynamics. Fogel (1994) pointed out effects of decreasing mortality and increasing life expectancy on economic growth. Life expectancy is frequently used for long term modeling and analysis of economic growth (Barro, 1996; Sachs and Warner, 1997; Bloom and Sachs, 1998; Bloom, Canning and Sevilla, 2004 among others). Bloom, Canning and Sevilla (2004) presented a model of economic growth and it is reported that life expectancy is a statistically significant driver of increase in production output among 104 countries.Bloom and Canning (1999) express four main reasons for defining life expectancy as an economic indicator:
“Productivity. Healthier populations tend to have higher labor productivity,
because their workers are physically more energetic and mentally more robust. They suffer fewer lost workdays due to illness or the need to care for other family members who have fallen ill.Education. Healthier people who live longer have stronger incentives to invest in developing their skills, because they expect to reap the benefits of such investments over longer periods. Increased schooling promotes greater productivity and, in turn, higher income. Good health also promotes school attendance and enhances cognitive function.
Investment in physical capital. Improvements in longevity create a greater need for people to save for their retirement. Insofar as increased savings
70
lead to increased investment, workers will have access to more capital and their incomes will rise. In addition, a healthy and educated workforce acts as a strong magnet for foreign direct investment.
Demographic dividend. The transition from high to low rates of both mortality and fertility has been dramatic and rapid in many developing countries in recent decades. Mortality declines concentrated among infants and children typically initiate the transition and trigger subsequent declines in fertility. An initial surge in the numbers of young dependents gradually gives way to an increase in the proportion of the population that is of working age. As this happens, income per capita can rise dramatically, provided the broader policy environment permits the new workers to be absorbed into productive employment.“
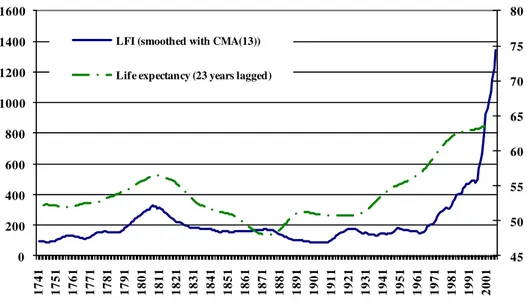
Figure 2 presents life expectancy data and LFI. Life expectancy data is based on U.S. population and at age 10. Since it is available for such long term, U.S. data is preferred. For proper visualisation, LFI data is smoothed and WWI effects are interpolated. Life expectancy data is also smoothed with same particulars, centred on a moving average of 13 years. Finally, life expectancy data lagged 23 years to clarify co-movement. Correlation coefficient between these two series is defined positive at 0.75 levels. Indications of theories and visual results explicitly expose a possible long term co-movement between two indicators.
45 50 55 60 65 70 75 80 0 200 400 600 800 1000 1200 1400 1600 1 7 4 1 1 7 5 1 1 7 6 1 1 7 7 1 1 7 8 1 1 7 9 1 1 8 0 1 1 8 1 1 1 8 2 1 1 8 3 1 1 8 4 1 1 8 5 1 1 8 6 1 1 8 7 1 1 8 8 1 1 8 9 1 1 9 0 1 1 9 1 1 1 9 2 1 1 9 3 1 1 9 4 1 1 9 5 1 1 9 6 1 1 9 7 1 1 9 8 1 1 9 9 1 2 0 0 1
LFI (smoothed with CMA(13)) Life expectancy (23 years lagged)
Source: LFI is a composite index that calculated by Duru and Yoshida (2010). Life expectancy data is by Fogel (1986) and U.N. statistics.
Figure 2. LFI (left scale) and Life expectancy (right scale; 23 years lagged)(at age 10, U.S.) between 1741 and 2008.
71
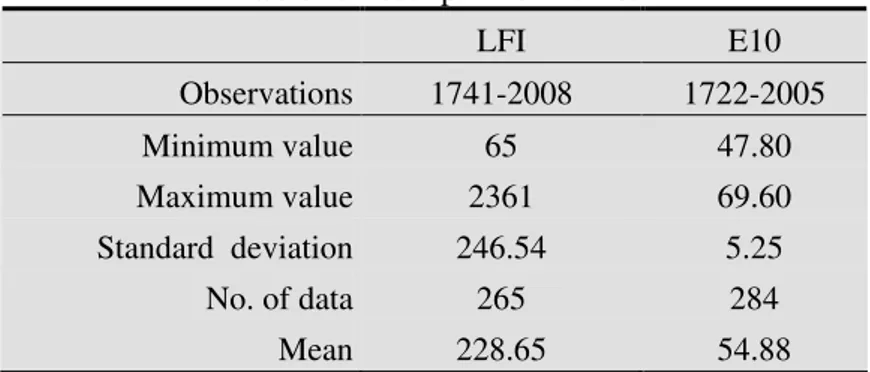
Testing for leading effectFor testing the influences of life expectancy data, a classical linear regression model is estimated and coefficient of leading indicator is tested for significance. Table 4 presents descriptive statistics for both dataset. Number of data for life expectation (E10) is more than LFI and it is possible to apply long time lags to E10 for modeling the beginning period of LFI. Although, E10 data is terminated in 2005, the recent data is unnecessary in case of long time lags.
Table 4. Descriptive statistics.
LFI E10 Observations 1741-2008 1722-2005 Minimum value 65 47.80 Maximum value 2361 69.60 Standard deviation 246.54 5.25 No. of data 265 284 Mean 228.65 54.88
Tables 5 and 6 indicate Ng-Perron (2001) unit root-stationarity test results. According to assumptions of classical linear regression model, we expect the data has no unit roots. Rather than the conventional unit root tests, Ng-Perron M-tests are developed to improve its power to several conditions. Before testing stationarity, both dataset are smoothed with centred moving average at 13 years length (sLFI and sE10). Ng-Perron test is based on intercept and trend for sE10 and intercept for sLFI. Spectral estimation is performed with autoregressive generalised least squares method. Lag lengths are based on Schwarz information criterion selection (maximum lags:15). Both test results indicate that series have no unit roots (due to higher rates of MZa and MZt) and they are stationary (due to higher rates of MSB and MPT).
Table 5. Ng-Perron (2001) test results for sE10 data.
MZa MZt MSB MPT
Ng-Perron test statistics -2.08 -0.75 0.36 30.49 Asymptotic critical values* 1% -23.80 -3.42 0.14 4.03
5% -17.30 -2.91 0.16 5.48
10% -14.20 -2.62 0.18 6.67
72
Table 6. Ng-Perron (2001) test results for sLFI data.
MZa MZt MSB MPT
Ng-Perron test statistics 18.44 4.83 0.26 28.03 Asymptotic critical values* 1% -13.80 -2.58 0.17 1.78
5% -8.10 -1.98 0.23 3.17
10% -5.70 -1.62 0.27 4.45
*Ng-Perron (2001, Table 1)
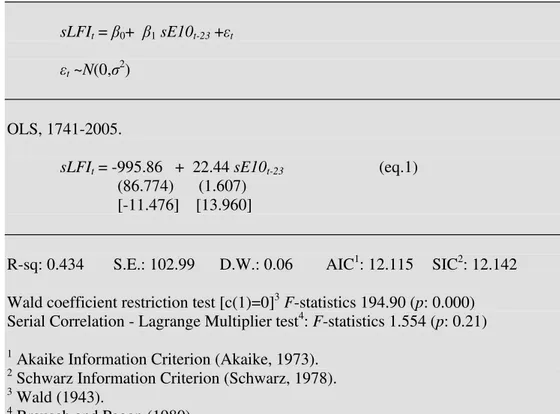
Since both dataset are stationary, the leading effect is tested for 23 years. The leading period is selected according to distance between two peaks of data. However, an extended simulation may provide the most significant time lag due to existing period of data. Table 7 presents results of testing equation. Constant and coefficient of life expectancy are quite significant. Durbin-Watson (D.W.) statistics are very low, which indicates that autocorrelation on residuals and additional explanatory terms may improve it. This paper does not deal with modeling LFI and just looks for leading effect. Wald coefficient restriction test shows that the significance of life expectancy is very high. Zero coefficient hypothesis is rejected. According to statistical evidences, life expectancy is recorded as one of the major drivers of long term freight rates in centennial cycles.
Table 7. Testing model for sLFI and sE10. sLFIt = β0+ β1 sE10t-23 +εt
εt ~N(0,σ2)
OLS, 1741-2005.
sLFIt = -995.86 + 22.44 sE10t-23 (eq.1)
(86.774) (1.607) [-11.476] [13.960]
R-sq: 0.434 S.E.: 102.99 D.W.: 0.06 AIC1: 12.115 SIC2: 12.142 Wald coefficient restriction test [c(1)=0]3 F-statistics 194.90 (p: 0.000) Serial Correlation - Lagrange Multiplier test4: F-statistics 1.554 (p: 0.21) 1
Akaike Information Criterion (Akaike, 1973). 2
Schwarz Information Criterion (Schwarz, 1978). 3
Wald (1943). 4
73
CONCLUSIONThis paper reviews main theoretical ideas on shipping and productivity of sea service. The long term decline of the 19th century is a noteworthy issue, so many scholars investigated the term of decline. Nobel Prize awarded economic historian Douglass North particularly focused on efficiency issue, but several studies also focused towards technology improvements. The 20th century was a unique period of technological improvements. However, these improvements are not priced in freight rates, nor do they have broader influence. Conditions of 19th century and 20th century are quite different. Technology may have had particular importance for the 19th century. However, we should consider that technology is not limited to shipping; it is also one of the drivers of the industrial revolution and increasing trade. Both technological improvements and increasing trade depend on healthy people and their reasonably long life duration. As is indicated in the macroeconomic models, life expectancy is observed as a leading factor for shipping service.
REFERENCES
Akaike, H. (1973). Information theory and an extension of the maximum likelihood principal. In: Petrov, B.N., Csaki, F. (eds.), the 2nd International Symposium on
Information Theory, Akademia Kiado, Budapest, pp. 267–281.
Angier, E. A. V. (1920). Fifty Years’ Freights, 1869-1919, Fairplay, London. Barro, R. J. (1996). Democracy and growth, Journal of Economic Growth, Vol. 1(1), pp. 1-27.
Bloom, D. E. and Sachs, J. D. (1998). Geography, demography, and economic growth in Africa, Brookings Papers on Economic Activity: Part 2, pp. 207-273. Bloom, D. E. and Canning, D. (1999). The health and wealth of nations, Workshop of the U.K. Department for International Development and the World Health Organisation.
Bloom, D. E., Canning, D. and Sevilla J. (2004). The Effect of health on economic growth: a production function approach, World Development, Vol. 32, pp. 1–13. Brown, P.H. and Hopkins, S.V. (1956). Seven centuries of the prices of consumables, compared with builders’ wage-rates, Economica, Vol. 23, pp. 296– 315.
Durbin, J., and Watson, G. S. (1950). Testing for serial correlation in least squares regression, I., Biometrika, Vol. 37, pp. 409–428.
74
Durbin, J., and Watson, G. S. (1951). Testing for serial correlation in least squares regression, II.. Biometrika, Vol. 38, pp. 159–179.
Duru, O. and Yoshida, S. (2010). Long term freight market index and inferences,
Journal of Logistics and Shipping Economics, Vol. 44, pp. 39-48.
Fama, E. (1970). Efficient capital markets: a review of theory and empirical work,
Journal of Finance, Vol. 25, pp. 383-417.
Harley, C.K. (1988). Ocean freight rates and productivity, 1740–1913: the primacy of mechanical invention reaffirmed, Journal of Economic History, Vol. 48, pp. 851–876.
Harley, C.K. (1989). Coal exports and British shipping, 1850–1913, Explorations
in Economic History, Vol. 26, pp. 311–338.
Isserlis, L. (1938). Tramp shipping cargoes, and freights, Journal of the Royal
Statistical Society, Vol. 101, pp. 53–134.
Jacks, D. S. (2005), Intra- and International Commodity Market Integration in the Atlantic Economy, 1800-1913. Explorations in Economic History, Vol. 42(3), pp. 381-413.
Jacks, D.S., Meissner, C.M. and Dennis, N. (2009). Trade costs in the first wave of globalization, Explorations in Economic History, Vol. 47(2), pp. 127-141.
Hummels, D. (1999). Have International Transportation Costs Declined?, Working Paper, University of Chicago.
Kaukiainen, Y. (2001). Shrinking the world: Improvements in the speed of information transmission, c. 1820-1870, European Review of Economic History, Vol. 5, pp. 1-28.
Klovland, J.T. (2008). The construction of ocean freight rate indices for the mid-nineteenth century, International Journal of Maritime History, Vol. 20, pp. 1–26. Metaxas, B. (1971). The economics of tramp shipping. London: Athlone Press. Mohammed S.I.S. and Williamson J.G. (2004). Freight rates and productivity gains in British tramp shipping 1869-1950, Explorations in Economic History, Vol. 41, pp. 172-203.
Ng, S., and Perron P. (2001). Lag length selection and the construction of unit root tests with good size and power, Econometrica, Vol. 69, pp. 1519–1554.
75
North D. (1958). Ocean freight rates and economic development 1750–1913,
Journal of Economic History, Vol. 18, pp. 537–555.
O’Rourke K.H. and Williamson J.G. (2002). When did globalisation begin?,
European Review of Economic History, Vol. 6, pp. 23-50.
Sachs, J. and Warner, A. (1997). Sources of slow growth in African economies,
Journal of African Economics, Vol. 6, pp. 335–337.
Schwarz, G.E. (1978). Estimating the dimension of a model, Annals of Statistics, Vol. 6 (2), pp. 461–464.
Stopford M. (2009). Maritime Economics. Routledge, New York.
Wald, A. (1943). Tests of statistical hypotheses concerning several parameters when the number of observations is large, Transactions of the American
Mathematical Society, Vol. 54, pp. 426-482.
Yoshimura, K. (1942). Kaiun Shikyou Hendo Jijou Kanken (A view on causes of
76
APPENDIX.
LONG TERM DRY CARGO FREIGHT RATE INDEX 1741-1900
Year LFI Year LFI Year LFI Year LFI
1741 89.44 1781 226.95 1821 242.72 1861 195.49 1742 95.71 1782 179.59 1822 244.68 1862 169.82 1743 143.76 1783 120.99 1823 220.50 1863 165.22 1744 124.35 1784 134.91 1824 212.90 1864 124.79 1745 88.88 1785 128.44 1825 194.16 1865 156.26 1746 69.73 1786 119.84 1826 216.28 1866 151.96 1747 72.68 1787 120.02 1827 206.85 1867 156.15 1748 83.69 1788 120.71 1828 185.97 1868 175.04 1749 92.18 1789 142.99 1829 182.98 1869 168.08 1750 82.17 1790 141.54 1830 182.68 1870 160.71 1751 80.24 1791 140.78 1831 174.37 1871 157.50 1752 65.52 1792 172.18 1832 185.25 1872 174.05 1753 68.98 1793 218.34 1833 169.36 1873 210.05 1754 105.25 1794 222.47 1834 178.42 1874 185.68 1755 160.68 1795 214.79 1835 169.32 1875 188.07 1756 152.76 1796 213.51 1836 163.23 1876 168.40 1757 127.08 1797 221.60 1837 187.84 1877 175.84 1758 154.80 1798 294.47 1838 199.07 1878 170.51 1759 138.01 1799 295.06 1839 178.40 1879 165.20 1760 158.46 1800 177.91 1840 203.46 1880 168.08 1761 183.96 1801 219.70 1841 167.74 1881 145.87 1762 121.59 1802 302.32 1842 158.64 1882 151.94 1763 137.38 1803 303.04 1843 166.27 1883 123.84 1764 110.39 1804 279.54 1844 154.37 1884 122.36 1765 107.60 1805 240.38 1845 152.87 1885 110.53 1766 98.16 1806 308.73 1846 168.63 1886 111.38 1767 95.63 1807 345.09 1847 187.14 1887 99.47 1768 92.85 1808 383.07 1848 168.23 1888 114.30 1769 118.50 1809 350.87 1849 147.45 1889 121.80 1770 134.25 1810 362.93 1850 138.96 1890 111.93 1771 113.43 1811 344.43 1851 128.44 1891 103.45 1772 89.17 1812 291.81 1852 139.09 1892 96.56 1773 105.06 1813 365.89 1853 155.53 1893 104.12 1774 108.50 1814 369.19 1854 177.66 1894 81.40 1775 158.12 1815 297.23 1855 179.29 1895 89.80 1776 162.98 1816 215.78 1856 175.83 1896 97.62 1777 177.84 1817 159.16 1857 143.15 1897 97.93 1778 155.58 1818 265.53 1858 146.76 1898 110.87 1779 177.87 1819 224.32 1859 145.20 1899 106.99 1780 212.96 1820 260.16 1860 159.72 1900 116.40
77
1901-2008
Year LFI Year LFI Year LFI
1901 87.05 1943 134.48 1989 532.81 1902 77.02 1944 123.25 1990 469.59 1903 72.71 1945 142.23 1991 545.88 1904 75.85 1946 168.97 1992 454.38 1905 80.07 1947 166.50 1993 539.41 1906 80.62 1948 146.92 1994 536.07 1907 82.91 1949 117.47 1995 646.39 1908 71.53 1950 137.36 1996 474.79 1909 73.53 1951 263.86 1997 472.53 1910 82.00 1952 173.26 1998 336.04 1911 93.23 1953 139.62 1999 373.64 1912 120.66 1954 145.61 2000 555.39 1913 104.82 1955 227.99 2001 410.72 1914 92.57 1956 291.82 2002 339.55 1915 267.16 1961 140.93 2003 785.30 1916 428.95 1962 116.97 2004 1488.67 1917 887.86 1963 141.59 2005 1212.41 1918 863.20 1964 149.64 2006 1093.29 1919 847.46 1965 162.91 2007 2360.94 1920 501.34 1966 153.76 2008 2120.39 1921 292.64 1967 156.88 1922 223.60 1968 157.93 1923 170.79 1969 150.67 1924 178.98 1970 231.59 1925 162.92 1971 148.67 1926 193.11 1972 153.13 1927 184.53 1973 347.12 1928 161.55 1974 403.78 1929 156.27 1975 201.94 1930 146.29 1976 222.04 1931 140.38 1977 204.69 1932 130.75 1978 271.21 1933 113.31 1979 374.98 1934 121.32 1980 466.47 1935 116.40 1981 425.56 1936 137.62 1982 285.19 1937 184.11 1983 296.01 1938 173.59 1984 312.36 1939 174.17 1985 289.37 1940 100.11 1986 263.36 1941 124.27 1987 359.82 1942 115.59 1988 500.73