REPUBLIC OF TURKEY SİİRT UNIVERSITY
GRADUATE SCHOOL OF NATURAL AND APPLIED SCIENCES
M.Sc. THESIS
THE EFFECT OF BIOFERTILIZERS ON COTTON DEVELOPMENT, YIELD AND TECHNOLOGICAL PROPERTIES
DILMAN OSMAN ABDULLA 163110011
Department of Field Crops
Supervisor: Assoc. Prof. Dr. Çetin KARADEMİR
July-2018 SİİRT
THESIS NOTIFICATION
I hereby declare under the penalty of perjury that this paper is my unique authorial work, which I have done on my own. All the information, references and literature used or excerpted through explanation of this work are correctly cited and listed in complete reference to the owing cause. .
Signature
Dilman Osman ABDULLA
Note: In this thesis, the use of original and other source notifications, tables, figures and photographs without reference, is subject to provision of law
ACKNOWLEDGEMENTS
First of all, I owe my deepest gratitude to my diligent supervisor Assoc. Prof. Dr. Cetin KARADEMIR. Without his encouragement, support, enthusiasm and continued optimism this thesis would hardly have been completed. I would like to thank Assoc. Prof. Dr. Emine KARADEMIR and Assist. Prof. Dr. Fatih ÇIG for their help and support. I am forever thankful to my colleagues and fellows for their support and help in my experiment tireless in Siirt University. Finally, I wish to thank my family for their support and encouragement throughout my study. My special thanks to my mother, without her continuous support and encouragement I would never have been able to achieve my goals.
Dilman Osman ABDULLA
SİİRT 2018
TABLE OF CONTENTS
Pages
ACKNOWLEDGEMENTS ... iii
TABLE OF CONTENTS ... iv
LIST OF TABLES ... vi
LIST OF FIGURES... viii
ABBREVIATIONS AND SYMBOLS ... ix
ABSTRACT ...x
ÖZET ... xi
1.INTRODUCTION ...1
1.1. Biofertilizer ... 2
1.2. The Advantages of Biofertilizer ... 2
1.3. Mode of Action Plant Promoting Rhizobacteria (PGPR) ... 3
1.3.1. As Biofertilizer ... 3
1.3.2. As Biopesticide ... 3
2. LITERATURE REVIEW ...5
3. MATERIAL AND METHOD ...9
3.1. Materials ... 9
3.1.1. General descrıptıon of experımental area ... 9
3.1.2. Soil properties of subject area ... 9
3.1.3. Climatic data of subject area ... 9
3.1.4. Plantal material of research ... 11
3.1.5. Biofertilizers used in study ... 11
3.1.5.1. Coton-plus ... 11
3.1.5.2. Mega-flu ... 12
3.2. Method ... 13
3.2.1. Experimental design and agricultural cultivation practices: ... 13
3.2.2. Treatments ... 13
3.2.3. The observation taken; ... 15
3.2.3.1. Seed cotton yield (kg da-1): After complete picking, seed cotton yield from each plot was weighed and yield was calculated on decare basis. ... 15
3.2.3.2. Fiber yield (kg da-1):... 15
3.2.3.3. Date of first flower (days): ... 15
3.2.3.4. Plant height (cm): ... 15
3.2.3.5. Number of monopodial branches (number/ per plant): ... 16
3.2.3.6. Number of sympodial branches (number/ per plant): ... 16
3.2.3.7. Number of nodes for first fruiting branch (number/ per plant): ... 16
3.2.3.8. Number of bolls per plant (number/ per plant): ... 16
3.2.3.10. Single boll seed cotton weight (g): ... 17
3.2.3.11. Ginning out turn (%): ... 17
3.2.3.12. First picking percentage (%): ... 17
3.2.4. Fiber (Lint) Technological Properties ... 18
3.2.4.1. Fiber fineness (micronaire):... 18
3.2.4.2. Fiber length (mm): ... 18
3.2.4.3. Fiber strength (gr/tex): ... 18
3.2.4.4. Short fiber Index (SFI) (%): ... 18
3.2.4.5. Uniformity index (%): ... 18
3.2.4.6. Fiber elongation (%): ... 18
3.2.4.7. Maturity (%): ... 18
3.2.4.8. Moisture (%): ... 18
3.2.4.9. Spinaning conceinty index (SCI): ... 18
4. FINDINGS AND DISCUSSION ... 19
4.1. Yield Components and Morphological Characteristics ... 19
4.1.1. Seed cotton yield (kg da-1) ... 19
4.1.2. Fiber yield (kg da-1)... 20
4.1.3. First flowering (day) ... 21
4.1.4. Plant height (cm) ... 22
4.1.5. The number of monopodial branches (number / per plant) ... 24
4.1.6. The number of sympodial branches (number / per plant) ... 25
4.1.7. Node number of first fruiting branches (number / per plant) ... 27
4.1.8. Number of boll per plant (number / per plant) ... 28
4.1.9. Boll weight (g) ... 29
4.1.10. Single boll seed cotton weight (g) ... 31
4.1.11. Ginning percentage (%)... 32
4.1.12. First picking percentage (%)... 33
4.2 Technological Characteristics ... 34
4.2.1. Fiber fineness (micronaire)... 34
4.2.2 Fiber length (mm) ... 36
4.2.3. Fiber strength (g/tex) ... 37
4.2.5. Uniformity index ... 39
4.2.6. Fiber elongation (%) ... 40
4.2.8. Moisture ( %) ... 43
4.2.9. Spinning consistency index (SCI) ... 44
5. RESULTS AND RECCOMMENDATIONS ... 46
5.1. Results ... 46
5.2. Reccomendation ... 46
6.REFERENCES ... 48
LIST OF TABLES
Pages
Table 3. 1 Soil Analysis Result of Experimental Area ... 9
Table 3. 2 Characteristic of used material Stoneville 468 ... 11
Table 4. 1 Analysis of Variance for seed cotton yield ... 19
Table 4. 2. Average values and statistical groups of seed cotton Yield ... 19
Table 4. 3 Analysis of Variance for Fiber/Lint Yield ... 20
Table 4. 4 Average values and statistical groups of Fiber/Lint Yield ... 21
Table 4. 5 Analysis of Variance for First Flowering Date ... 22
Table 4. 6 Average values and statistical groups of First Flowering Date ... 22
Table 4. 7 Analysis of Variance for Plant Height ... 23
Table 4. 8 Average values and statistical groups of Plant Height by Treatment ... 23
Table 4. 9 Analysis of Variance for Number of Monopodial Branches ... 24
Table 4. 10 Average values and statistical groups of number of Monopodial Branches by Treatment ... 25
Table 4. 11 Analysis of Variance for Number of Sympodial Branches ... 26
Table 4. 12 Average values and statistical groups of number of Sympodial Branches by Treatment ... 26
Table 4. 13 Analysis of Variance for Node Number of First Fruiting Branches ... 27
Table 4. 14 Average values and statistical groups of node number of First Fruiting Branches By Treatment ... 28
Table 4. 15 Analysis of Variance for number of boll per plant ... 28
Table 4. 16 Average values and statistical groups of number of boll per plant by treatment ... 29
Table 4. 17. Analysis of Variance for boll weight ... 30
Table 4. 18 Average values and statistical groups of Variance for boll weight by treatment ... 30
Table 4. 19 Analysis Variance for single boll seed cotton weight ... 31
Table 4. 20 Average values and statistical groups of single boll seed cotton weight by treatment ... 31
Table 4. 21 Analysis of Variance for Ginning Percentage ... 32
Table 4. 22 Average values and statistical groups of Ginning Percentage by Treatment ... 32
Table 4. 23 Analysis of Variance for first picking percentage ... 33
Table 4. 24 Average values and statistical groups of First Picking Percentage by Treatment ... 34
Table 4. 25 Analysis of Variance for fiber fineness (Micronaire) ... 35
Table 4. 26 Average values and statistical groups of fiber fineness (Micronaire) by Treatment ... 35
Table 4. 27Analysis of Variance for Fiber Length (mm) ... 36
Table 4. 28 Average values and statistical groups of Fiber Length By Treatment ... 36
Table 4. 29 Analysis of Variance for Fiber Strength ... 37
Table 4. 30 Average values and statistical groups of Fiber Strength By Treatment ... 37
Table 4. 31 Analysis of Variance for Short Fiber Index (SFI) ... 38
Table 4. 32 Average values and statistical groups of Short Fiber Index (SFI) By Treatment ... 39
Table 4. 33 Analysis of Variance for Uniformity Index (UI) ... 39
Table 4. 35 Analysis of Variance for Fiber Elongation ... 40 Table 4. 36. Average values and statistical groups of fiber Elongation By Treatment ... 41 Table 4. 37 Analysis of Variance for Fiber Maturity ... 42 Table 4. 38. Average Values and Statistical Groups of Fiber Maturity by Treatment .... 42 Table 4. 39 Analysis of Variance for Moisture... 43 Table 4. 40 Average values and statistical groups of Moisture By Treatment ... 43 Table 4. 41 Analysis of Variance for Spinning Consistency Index (SCI) ... 44 Table 4. 42 Average values and statistical groups of spinning consistency index (SCI)
LIST OF FIGURES
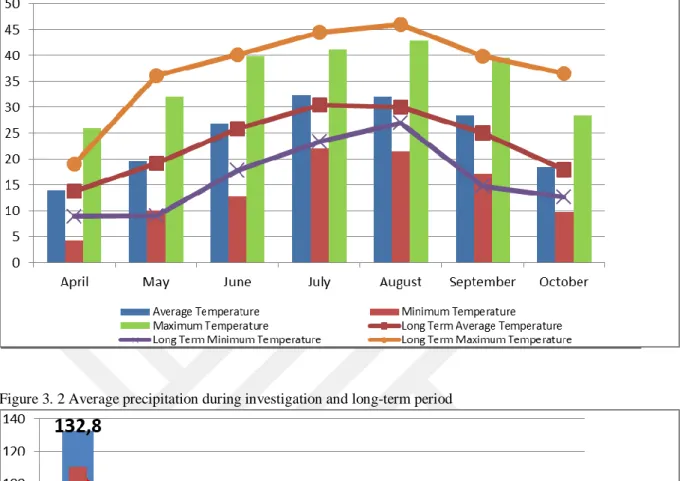
Figure 3. 1. Minimum, Maximum and Average Temperature During
and Long-Term Period ... 10
Figure 3. 2. Average precipitation during investigation and long term period ... 10
Figure 3. 3. Dressing seed cotton with COTON-PLUS and MEGA-FLU ... 14
Figure 3. 4. The application of cotton plant with biofertilizers ... 14
Figure 3. 5. Flowering stage ... 15
Figure 3. 6. Measurement of plant height ... 16
Figure 3. 7. Weighting bolls with calyx. ... 17
ABBREVIATIONS AND SYMBOLS
Abbreviations Description
SCI : Spinning Consistency Index
MST : Moisture
MIC : Micronaire
MAT : Maturity
UHML : Upper Half Mean Length
UI : Uniformity
SFI : Short Fiber Index
STR : Strength
ELG : Elongation
NAWF : Nodes Above White Flower
GMP : Good Management Practices
HNR : Height / Node Rate HVI : High Volume Instrument
ABSTRACT
The Degree of Master of Science
THE EFFECT OF BIOFERTILIZERS ON COTTON DEVELOPMENT, YIELD AND TECHNOLOGICAL PROPERTIES
DILMAN OSMAN ABDULLA
The Graduate School of Natural and Applied Science of Siirt University Department of Field Crops
Supervisior : Assoc. Prof. Dr. Cetın KARADEMIR
July 2018, 51 pages
The aim of this study was to determine the effect of biofertilizer application on cotton yield, cotton growth and fiber technological properties. This study was carried out at faculty of agriculture, department of field crops, Siirt University, Turkey during 2017 cotton growing season. The experiment was conducted in randomized complete block design with four replications. Stoneville 468 cotton cultivar was used as plant material. In this experiment Coton Plus and Mega Flu have been used as biofertilizers to increase cotton yield and technological properties as opposed to the utilization of chemical fertilizer. Further, Cotton Plus is mixed microbial fertilizer which contains Bacillus subtilis, Paenibacillus
azotofixans while Mega Flu contains three different genera of bacteria Bacillus megaterium, Pantoea agglomerans and Pseudomonas fluorences. The results of study indicated that there were significant
differences between biofertilizers applications in terms of seed cotton yield, lint yield, ginning percentage, the number of monopodial branches, but there were non-significant differences observed in terms of lint quality characteristics except elongation. In addition, there were significant differences for cotton seed yield and lint yield. It can be concluded that the bio fertilizer can be used for increasing yield in cotton.
Keywords: Stoneville 468, biofertilizer, Coton plus, Mega flu, Bacillus subtilis, Paenibacillus
ÖZET
YÜKSEK LİSANS TEZİ
BİYOGÜBRELERİN PAMUK GELİŞİMİ, VERİMİ VE TEKNOLOJİK ÖZELLİKLERE ETKİSİ
DILMAN OSMAN ABDULLA Siirt Üniversitesi
Fen Bilimleri Enstitüsü Tarla Bitkileri Anabilim Dalı
Danışman: Doç. Dr. Çetin KARADEMİR
Temmuz 2018, 51 sayfa
Çalışma biyogübre uygulamalarının pamuğun verimi, gelişimi ve teknolojik özellikleri üzerine olan etkisini belirlemek amacıyla yürütülmüştür. Bu çalışma Siirt Üniversitesi Ziraat Fakültesi deneme alanlarında 2017 yılı yetiştirme sezonunda yürütülmüştür. Araştırma Tesadüf Blokları deneme desenine göre 4 tekrarlamalı olarak kurulmuştur. Bitki materyali olarak Stoneville 468 pamuk çeşidi kullanılmıştır. Çalışmada pamukta verim ve teknolojik özelliklere etkilerini belirlemek amacı ile Coton Plus ve Mega Flu adlı biyo gübreler uygulanmıştır. Coton Plus Bacillus subtilis, Paenibacillus azotofixans içeren bir microbial karışım gübre, Mega Flu ise Bacillus megaterium, Pantoea agglomerans ve Pseudomonas fluorences bakterilerinin üç farklı türünü içermektedir. Araştırmada elde edilen sonuçlara göre kütlü pamuk verimi, lif verimi, çırçır randımanı ve odun dalı sayısı bakımından uygulamalar arasında önemli düzeyde farklılıklar elde edilmiştir. Lif kalite kriterleri bakımından ise lif kopma uzaması hariç diğer özellikler yönünden istatistiksel bir farklılık görülmemiştir. Kütlü pamuk verimi ve lif verimi bakımından önemli farklılıkların elde edilmiş olması biyogübrelerin pamuk tarımında kullanılabileceğini göstermektedir.
Anahtar kelimeler: Stoneville 468, biofertilizer, Coton plus, Megaflu, Bacillus subtilis, Paenibacillus
azotofixans, Bacillus megaterium, pantoea agglomerans, Pseudomonus fluorences .
1.INTRODUCTION
Cotton is one of the most important commercial crops in Turkey. Turkey is one of the major cotton producing countries with a total of 500.000 ha area of cotton cultivated area and 882.000 tons of total fiber production (Anonymous, 2017). However, because of the local cotton lint production is not sufficient to meet the ever-increasing demands of textile industry, Turkey imports about 800.000 tons of cotton lint per year. The cotton is produced in Southeastern Anatolia, Aegean and Mediterranean regions of Turkey. Southeastern Anatolia Region, where more than 50% cotton production provided, has suitable ecology for cotton production.
The demand for and supply of food are evidently the results of double increase of human population in the recent decades, in which plant nutrition played an important role. Commercial artificial fertilizers have led to an enormous increase in crop production.
The increasing use of these chemically produced fertilizers to provide greater plant nutrition has adversely impacted our planet. There are two types of environmental pollution that emerge due to their use, direct and indirect. Direct pollution can be the result of misuse and excessive or poorly managed use of chemical fertilizers which consequently result in leaching, acidification, volatilization and denitrification. On the other hand, the use of fossil fuel in Haber Bosch process for nitrogen fixation in producing fertilizers can be regarded as indirect pollution. The process exhales enormous amounts airborne CO2 as well as nitrogen into the atmosphere which will be eventually deposited
into terrestrial ecosystems.
The tremendous use of chemical fertilizers has caused several problems in the ecological and agricultural system such as the pollution of air, surface water and ground water as well as deterioration of soil quality, the suppressed ecosystem and biodiversity.
Presently, sewage sludge and community waste are used as a source of plant nutrition. The problem of using sewage sludge and community waste lies in the fact that they are in heavy metals, which causes various problem for microorganisms in the rhizosphere of the plant as well as plant growth in different stages.
In general, plants depend on major nutrients for crop growth and development. Nitrogen and phosphorus are essential minerals strictly required to successfully stimulate plant growth. However, the soil may contain a vast amount of either nutrient, but most of the nitrogen and phosphorus are not absorbed by regular uptake process. Naturally, nitrogen can be lost from crop rhizosphere through volatilization, leaching, crop removal, run off, soil erosion and denitrification.
On the other hand, phosphorus can be lost from agricultural lands through certain chemical and ecological processes.
Phosphorus precipitates by combining with aluminum or iron in acidic soils, whereas in alkaline soils it precipitates combining with calcium phosphates. Further, in cultivated fields vast amounts of phosphorus get dissolved in the run off and leachate.
To overcome the environment stresses and to reduce lacking fertilizers in the agricultural lands, biofertilizers can tackle problems despite being an excellent alternative to modify and manipulate agricultural lands.
1.1. Biofertilizer
A substance which contains living microorganisms which when applied to seed, plant surfaces, or soil, colonizes the rhizosphere or the interior of the plant and promote growth by increasing the supply or availability of plant nutrients to the host plant (Vessey, 2003).
Biofertilizer can be briefly defined as a substance prepared to hold living cells like bacteria and fungi, or latent cells of active strains of microorganisms which when applied through seed, soil or other parts of plant can enhance the uptake of nutrients of the subject crop plant by interacting in the rhizosphere.
1.2. The Advantages of Biofertilizer
1. Biofertilizers are an interesting alternative to chemical fertilizers such as nitrogen, phosphorus, and potassium.
2. They reconstruct the soil texture and energize the soil biologically.
3. Most biofertilizers suppress plant pathogens and protect it from soil borne disease.
4. Biofertilizers are harmless and inoffensive substances to ecological system. They improve most of the stresses therefore. This is why they are considered environment-friendly.
5. In order to sustain agricultural practises biofertilizers are relatively low in cost compared to chemical fertilizers.
6. Biofertilizers promote plant growth and produce phytohormones, nonetheless they increase crop yield and quality.
7. Recent discoveries suggest that, biofertilizers are harmless to insects and other microorganisms in ecosystem.
1.3. Mode of Action Plant Promoting Rhizobacteria (PGPR)
1.3.1. As Biofertilizer
1. Increasing N availability through N2 fixation
2. Solubilization of phosphorus (P) 3. Oxidization of Sulphur (s) 4. Chelation of Ferric Iron 5. Phytohormone production 6. Solubilizing of potassium
1.3.2. As Biopesticide
1. Competition 2. Antibiosis
3. Induced systemic resistance (ISR) 4. Siderophores production
5. Cyanide production 6. Parasitism
Biofertilization is known to help in the expansion of root system and better seed germination. Plant associated rhizobacteria (PGPRs) such as Azotobacter, Azospirillum, Acetobacter, Pseudomonas, etc. are able to colonize roots and can be classified into beneficial, deleterious and neutral groups on the basis of their effects on plant growth. PGPRs also include the
diazotrophs which have the ability to convert atmospheric nitrogen to ammonia which can be used by the plant as a source of nitrogen. Because of their competitive advantages in a carbon rich, nitrogen poor environment, diazotrophs become selectively rich in the rhizosphere putting them in a good position to promote plant growth. These types of bacteria are able to stimulate growth and increase the yield of nonlegumes (Narula et al., 2005)
Therefore, the objective of this study was to determine the effect of biofertilizers on development, yield and fiber technological characteristics of cotton.
2. LITERATURE REVIEW
Howie and Suslow (1991) Pseudomonas fluorescens strain Hv37R2 is used to evaluate the role of antibiotic in the suppression of Pythium ultimum in cotton plant. The results show that, the antibiotic which emerged from this strain inhibited the fungal activity in rhizosphere and spermosphere. Moreover, this bacterium reduced the average infection rate by 70% and increased the average by 50% of emergences in the cotton plant.
Chen et al. (1995) indicated that some endophytes bacteria which associated with cotton plant such as Pseudomonas putida, Bacillus pumilus, Aureobacterium
sapardae and Barkholderia solanacearum suppressed disease severity in Fusarium oxysporum infected cotton.
Fernando et al. (2005) revealed that chemical pesticide and fungicide have caused environmental concerns and pathogen resistance, forcing constants of new agents.
Narula et al. (2005), multiple strains Pseudomonas, Azotobacter, Azospirillum, and Acetobacter have been used as inoculants for cotton under irrigation and reduced level of chemical fertilization. The result was that co-inoculants could promote growth, increase boll number, weight and thus yield, due to their potential and capability of nitrogen fixation, solubilising phosphorus as well as producing indole-3-acetic acid.
Sheng (2005), observed that the potassium-mobilizing bacterium Bacillus
edaphicus promoted the root and shoot growth of seedlings in pot trials of cotton grown
in potassium-deficient soil and increased the N and P concentration in plants through root proliferation.
Yao et al. (2006) demonstrate that, subject to the same conditions in the fields, the treatment of cotton lonely with Bacillus subtilis FZB24 stimulates the growth, increases root system in size and capacity, increases yield and number of bolls based on this strain a high ability to mobilize and uptake nutrients to cotton plant as compared to control.
Anjum et al. (2007) explained that the effect of plant growth promoting rhizobacteria (PGPR) inoculation alone as wells as in combination with three levels of nitrogen fertilizer on cotton separately. The bacterium inoculum significantly increased
plant height by 5%, seed cotton yield by 21% and microbial population in soil by 41% over their respective controls while boll weight.
Doifode (2007) cotton treatment with Azotobacter and Phosphorus Solubilising Bacteria (PSB) alone as well as in combination with (NPK) in recommended dose was tested. The results showed that the water holding capacity increased (3.8 to 12.37%) in biofertilizer treatment. While it decreased by 7.11% in chemical fertilizer. Azotobacter and Phosphorus Solubilising Bacteria were significantly increased in biofertilizer treatment compared to chemical fertilizer.
Gomathy et al. (2008), observed that under drip irrigation, applying a mix of
mythylobacterium, Azospirillum, phosphorus solubilising Bacillus spp. as inoculant with
chemical fertilizer NPK together significantly increased cotton growth and yield.
Erdogan and Benlioglu (2010) four strains of Pseudomonas have been isolated which are Gossypium hirsutum (FP30), Portulaca sp. (FP23), Xanthium strumarium (FP22), and Convolvulus arvensis (FP35). These strains together with the known biocontrol agent Serratia plymuthica (HRO-C48) were tested under greenhouse conditions. The treatment of cottonseed with the Pseudomonas strains and HRO-C48 increased the plant height, NAWF-nodes above white flower, and number of nodes on main stem. Besides, the treatment can help in biocontrol of V. dahliae and growth improvement in cotton field.
Dhale et al. (2010) reported that co-inoculation of fields with Azospirillum sp., P-solubilising bacteria and methylotrops significantly enhances root and shoot growth, fibre yield, and, to some extent, fibre quality when used in combination with fertilizers.
Paul et al. (2011) concluded that producing bacterium Azotobacter
chroococcum, particulary when co-inoculated with arbuscular mycorhizal fungi,
improved seed germination, seedling development, plant height, boll number and boll weight, when applied as seed treatment.
Schoina et al. (2011) observed that under greenhouse conditions the antagonistic bacterium Paenibacillus alvei strain K-165 inhibited Thielaviopsis basicola growth through antibiosis and reduced significantly root discoloration and hypocotyl lesions on cotton seedlings compared to the control treatment. The analysis has shown that a cotton seed dressing treatment with K-165 was the most effective in reducing disease symptoms and increasing plant height and fresh weight.
Haw et al. (2012) showed that strain Bacillus velezensis CAU B946 isolated from rice rhizosphere can produce antibiotics such as lipopeptides, polyketides (PKS),
bacilysin, which act as fungicides to control diseases such as tobacco black shank, rice sheath blight, cotton Fusarium wilt, cotton Verticillium wilt and wheat scab.
Wu et al. (2012) suggested that IIA and ACC deaminase production by the rhizobium Raoultella planticola as well as enhanced uptake of N, P and other nutrients can be regarded as mechanisms for the increased germination rate, height and weight in cotton seedlings observed under salinity stress.
Mansoori et al. (2013) concluded that the pathogenic fungus Verticillium dahlia causes Verticillium wilt, one of the most important cotton diseases, P. fluorescens and
Bacillus spp. strains reduce its incidence applied to cotton seeds before planting in V. dahlia inoculated soil.
Yang et al. (2013) antagonistic bacteria Paenibacillus xylanilyticus YUPP-1,
Paenibacillus polymyxa YUPP-8 and Bacillus subtilis YUPP-2 were isolated from
cotton in the seedling, squaring and boll-setting stages, respectively. The isolation process has been conducted that way because the subject antagonistic bacteria reach their highest population through the latter three stages of growth. These results indicated that the multiple strains of endophytic bacteria can control and suppress Verticillium wilt and soil-borne diseases.
Yasmin et al. (2013), revealed that under reduced fertilizer conditions, cottonseed inoculated with combined microbial fertilizer which contains Bacillus
fusiformis S10 and Pseudomonas aeruginosa Z5 which isolated from cotton in Pakistan.
The results showed that the cotton yield improved by these two bacteria.
Guo et al. (2014) Bacillus subtilis strain NCD-2 is found to be strongly antagonistic toward phytopathogenic fungi. Further, NCD-2 functions as an excellent biocontrol agent for cotton soil-borne diseases. This study indicated that fungycin-type lipopeptides are the major antifungal active compounds produced by Bacillus subtilis NCD-2. These compounds play a main role in restricting the population of Rhizoctonia
solani in the cotton rhizosphere and in suppressing cotton dumping-off disease.
Meena et al. (2014), the solubilisation of silica by fungi and bacteria is considered as source of supply for several crops such as cotton, wheat, potato and tomatoes.
Pindi et al. (2014), phylogenetic and phenotypic analysis have been conducted for eight cotton cultivars. Among all the eight cultivars, Mahyco manifested lowest levels of proline. However, Mahyco manifested high levels of sugar, IAA, proteins and chlorophyll. Under field conditions in four different cotton grown agricultural soils, the
strains yielded maximum plant growth by increasing level of phytohormone production as well as other biochemical process in the deep black soil. Shallow black soil was second after deep black soil in manifesting high plant growth.
Wu et al. (2014), strains of Klebseilla oxytoca have been used as encapsulated bacteria to promote growth and colonization in pot experiments. The results demonstrate that, under salinity stress the encapsulated treatment increased germinat ion rate by 8.34%, whereas the treatment of cottonseed by unencapsulated bacteria (free bacteria) increased the germination rate by 15.40%. Although, under the encapsulated bacterial inoculation the physiological parameters (soluble sugar, chlorophyll a, malondialdehyde, and proline) of cotton were better than that under uncapsulated bacterial treatments. Therefore, encapsulated bacterial treatment was determined to be more potential having positive effects on cotton seedlings as it reduced the superoxide (SOD), peroxidase (POD), and catalase (CAT) activity on seedlings under salt stress.
Egamberdieva et al. (2015), revealed two bacterial strains Pseudomonas
chlororaphis R5 and Pseudomonas putida R4 applied to cotton in saline soils, were able
to suppress abiotic stress case change in concentration of phytohormones level in plant. These great potential strains were further able to produce and regulate (IAA) in the plant and they reduced the cotton root rot which is caused by Fusarium Solani.
Rao et al. (2016), experimental treatments have been conducted comprising three drip irrigation levels designated as 1.0 ETc (full irrigation as control), 0.8 ETc and 0.6 ETc (regular deficit irrigation) which receive 80% and 60% of the 1.0 ETc irrigation, were kept in main plot. A mixture of PSB inoculation and Cycocel spray were included as good management practices (GMP) in sub-plots. Furrow irrigation treatment was kept as absolute control. The results revealed that deficit irrigation at 0.8 ETc along with PSB inoculation and Cycocel spray should be considered as useful tool for water saving and higher yield in arid and semi-arid regions where irrigation water supplies are limited.
Perdomo et al. (2017), shows that both strains Azotobacter chroococcum AC1 and AC2 are capable of producing indole component, fixing nitrogen, synthesizing hydrolytic enzymes and solubilizing phosphorus in cotton.
3. MATERIAL AND METHOD
3.1. Materials
3.1.1. General descrıptıon of experımental area
The study was carried out at faculty of agriculture, department of field crops, Siirt University, Turkey during 2017 cotton growing season. The experimental field is located at (37.93'60" N, 41.94'04" E) at 920 m above sea level.
3.1.2. Soil properties of subject area
The soils of the experimental area, on which we conducted our experiment, are zonal soils which are generally red-brown included in the big soil group having a clayish nature, flat or nearly flat, having very small erosion and deep to medium deep. The soil is low in organic material and phosphorus, has adequate potassium, calcium and high clay content in the 0-150 cm profile.
Table 3. 1 Soil Analysis Result of Experimental Area Deep (cm) Body Class PH Lime (CaCo3) (%) Total salt (%) Class Useful P2O5 (kg/da) Useful K2O (kg/da) Organic Matter (%) 0-20 Loamy 7.6 9.5 1. 0.092 Nonsaline 4.00 1.53 1.53 Source: Siirt University Laboratory, 2017, Siirt
3.1.3. Climatic data of subject area
The climatical data was given in Graphic 1 and Graphic 2.
In 2017 both minimum and maximum temperature were lesser than long term period, on the other hand the average temperature were slightly higher than long term period (Graphic 1). From Graphic 2 it can be seen that at April and May, which are the cotton sowing months, the amount of rainfall were higher than that of long term period.
Figure 3. 1 Minimum, Maximum and Average Temperature During Investigation and Long-Term Period
Figure 3. 2 Average precipitation during investigation and long-term period
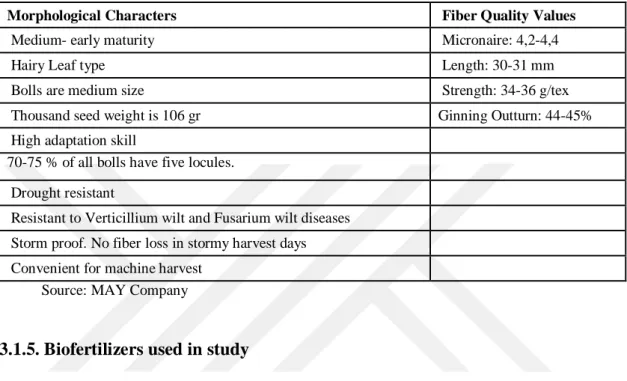
3.1.4. Plantal material of research
Stoneville 468 cotton variety was used as plant material. The characteristics of Stoneville 468 shown in Table 3.2.
Table 3. 2 Characteristic of used material Stoneville 468
Morphological Characters Fiber Quality Values
Medium- early maturity Micronaire: 4,2-4,4
Hairy Leaf type Length: 30-31 mm
Bolls are medium size Strength: 34-36 g/tex
Thousand seed weight is 106 gr Ginning Outturn: 44-45%
High adaptation skill
70-75 % of all bolls have five locules.
Drought resistant
Resistant to Verticillium wilt and Fusarium wilt diseases Storm proof. No fiber loss in stormy harvest days
Convenient for machine harvest
Source: MAY Company
3.1.5. Biofertilizers used in study
Two different types of mixed biofertilizers have been used; Coton-plus which contains two different genera of bacteria Bacillus subtilis and Paenibacillus azotofixans, and Mega-Flu which contains three different genera of bacteria Bacillus megaterium,
Pantoea agglomerans, and Pseudomonas fluorescens.
3.1.5.1. Coton-plus
Coton Plus is a mixed microbial fertilizer which stimulates and increases the production of plant’s own natural hormones in tremendous amounts making it potentially beneficial to plant growth. This increases nitrogen availability through nitrogen fixation. It also suppresses plant diseases and provides the plant with systemic immunity against stress caused by the cold. This type of biofertilizer contains two different bacteria namely Bacillus subtilis and Paenibacillus azotofixans.
Bacillus subtilis: It is present in different mediums such as air, soil and plant waste. It
in extreme environmental conditions. Endospores are resistant to unfavourable environmental situations including extreme PH, salinity, and drought. Bacillus subtilis produces some antifungal substances suppressing fungal pathogens. This bacterium secretes organic acids that can dissolve insoluble phosphorus being present in the soil.
Paenibacillus azotofixans: It is an aerobic gram-positive bacterium. This bacterium
can produce endo-spore which is resistant to different environmental conditions. It can enhance growth through nitrogen fixation, phytohormones production, solubilization of phosphorus, and increase in micronutrient uptake. This strain indirectly supresses and inhibits pathogens through the induction of systemic resistance. Further Paenibacillus
azotofixans can produce antimicrobial substances that prevent pathogen growth directly.
3.1.5.2. Mega-flu
This Biofertilizer contains three different strains of bacteria namely Bacillus
megaterium, Pantoea agglomerans and Pseudomonas fluorescens. This microbial
fertilizer can enhance plant growth via potential efficiency in nitrogen fixation and production of plant hormones such as: Auxins, Jasmonates, Salicylic acid, Cytokinins, Ethylene, and Gibberellins. It supplies some organic acids and dissolutions to dissolve insoluble minerals in favor of the plant in the rhizosphere such as calcium, phosphorus, and sulphur oxide. Bacteria found in Mega-Flu can also provide siderophores that enable iron chelating thus transferring iron to the plant in rhizosphere.
Bacillus megaterium: It is gram-positive, aerobic, endospore forming bacterium that
may remain dormant for a prolonged period of time and germinate in conditions that are favourable to growth. This bacterium has various mechanism of actions including, degradation of root as well as exudation and production of phytohormones. It found in different mediums from soil to seawater, honey, dried food, rice paddies and fish.
Pantoea agglomerans: It is a gram-negative, rod-shaped, non-spore forming bacteria. It
belongs to Entrobacteriaceae family. This bacterium can be isolated from animal or human feces, plant surfaces, seeds and fruits. This strain Pantoea agglomerans PF76/4 increases root and shoot growth and produces the phytohormone auxin.
Pseudomonas fluorescens: It is an obligate aerobic, gram-negative, rod shaped
bacterium. This bacterium can be isolated from various habitats including water surfaces, soils and plants. Its name came from its ability to produce soluble fluorescent pigment pyoverdin. It also protects some plant roots in the rhizosphere from nematodes and parasitic fungi.
3.2. Method
3.2.1. Experimental design and agricultural cultivation practices:
The experimental design was arranged in Completely Randomized Block design with four replications. The planting was performed with Combine Cotton Drilling machine on 12 May 2017. Each plot consisted of 4 rows each of which having 6 m length of planting. The distance between each two rows was 0.70 m while each two plants in the same row were separated by 0.20 m. All plots received 120 kg ha-1 N and 60 kg ha-1 P2O5. Half of the N and all P2O5 were applied during sowing time while the
remaining half of N was given during the square stage in the form of urea. Before sowing, the experiment area was hoed once while during seedling thinning was performed twice. After sowing the experiment area was hoed once again while herbicide was conducted once. Insects were monitored throughout the experiment however our determination was that no insect control was necessary during growing season. Experimental plots were irrigated 11 times by drip irrigation system. For the first-time irrigation was done on June 20, after which we completed the other 10 irrigations on a weekly basis, i.e. there was an interval of 7 days between any two consecutive irrigations. By the maturity was reached, 15 well developed open bolls were cut off by hand randomly from each genotype in each plot to be tested for boll weight and seed cotton weight per boll measurement. Plots were harvested twice by hand on October 4, and November 5 in 2017. The four rows of each plot were harvested to determine lint yield and seed cotton yield. Statistical analysis was performed using JMP 5.0.1 statistical software (SAS Institute Inc. 2002) and the means were grouped with LSD (0.05) test.
3.2.2. Treatments
Totally 9 treatments were performed. The treatments are shown below: T1: CONTROL (Conventional Chemical Fertilization)
T3: BM-COTON-PLUS at seed dressing + first squaring stage
T4: BM-COTON-PLUS at seed dressing + first squaring + first flowering stage T5: BM-COTON-PLUS at seed dressing+ first squ.+ first flow.+ boll formation stage T6: BM-MEGA FLU as seed dressing.
T7: BM- MEGA FLU at seed dressing + first squaring stage
T8: BM- MEGA FLU at seed dressing + first squaring + first flowering stage T9: BM- MEGA FLU at seed dressing+ first squ.+ first flow.+ boll formation stage
Figure 3. 3 Dressing seed cotton with COTON-PLUS and MEGA-FLU
Figure 3. 4 The application of cotton plant by foliar spray with COTON-PLUS and MEGA-FLU in three different stages of growth
Figure 3. 5. Flowering stage
3.2.3. The observation taken;
3.2.3.1. Seed cotton yield (kg da-1): After complete picking, seed cotton yield from
each plot was weighed and yield was calculated on decare basis.
3.2.3.2. Fiber yield (kg da-1): After ginning, cotton lint was weighed and yield was
calculated on decare basis.
3.2.3.3. Date of first flower (days): Number of days from planting to appearance of
first flower.
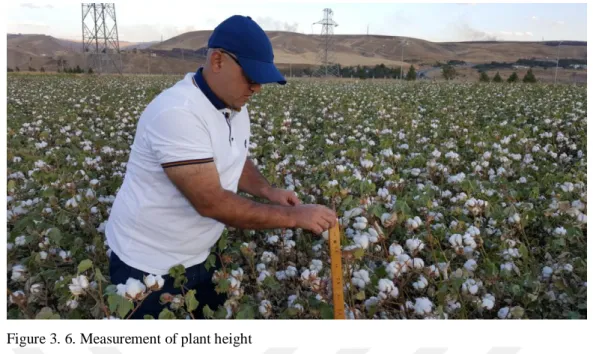
3.2.3.4. Plant height (cm): The plant height is measured from the plant’s cotyledon
leaves to the top of the plant from ten selected plants from each plot and their average was calculated.
Figure 3. 6. Measurement of plant height
3.2.3.5. Number of monopodial branches (number/ per plant): Numbers of
monopodial branches per plant was counted from ten selected plants from each plot and their average was calculated.
3.2.3.6. Number of sympodial branches (number/ per plant): Numbers of sympodial
branches per plant was counted from ten selected plants from each plot and their average was calculated.
3.2.3.7. Number of nodes for first fruiting branch (number/ per plant): Number of nodes for first fruiting branch was measured from ten selected plant from each plot and their average was calculated.
3.2.3.8. Number of bolls per plant (number/ per plant): Ten plants were randomly
selected from each plot and number of bolls per plant was counted and their average was calculated.
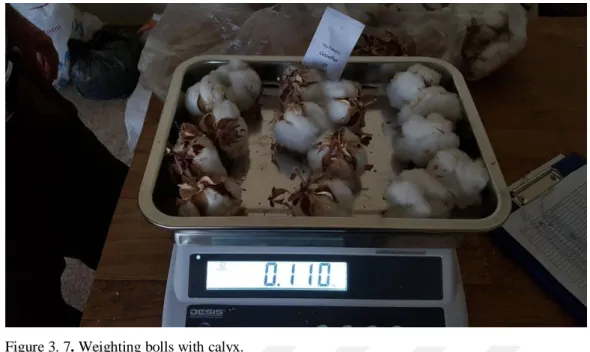
3.2.3.9. Boll weight (g): In field 15 bolls collected randomly for each plot, after that the
Figure 3. 7. Weighting bolls with calyx.
3.2.3.10. Single boll seed cotton weight (g): 15 bolls collected randomly for each plot,
their calyx removed and weighted without calyx and average was calculated.
Figure 3. 8 Weighting bolls without calyx.
3.2.3.11. Ginning out turn (%): After ginning, cotton lint and cotton seed were
weighed separately and ginning out turn (GOT) was calculated by using the following formula.
GOT (%) = Weight of lint / Weight of seed cotton x 100
3.2.3.12. First picking percentage (%): First Picking Percentage was calculated with
Weight of seed cotton from first picking First Picking Percentage (%) = --- x 100 Total seed cotton weight from all picking
3.2.4. Fiber (Lint) Technological Properties
3.2.4.1. Fiber fineness (micronaire): Determined by HVI (High Volume Instrument) 3.2.4.2. Fiber length (mm): Determined by HVI (High Volume Instrument)
3.2.4.3. Fiber strength (gr/tex): Determined by HVI (High Volume Instrument) 3.2.4.4. Short fiber Index (SFI) (%): Determined by HVI (High Volume Instrument) 3.2.4.5. Uniformity index (%): Determined by HVI (High Volume Instrument) 3.2.4.6. Fiber elongation (%): Determined by HVI (High Volume Instrument) 3.2.4.7. Maturity (%): Determined by HVI (High Volume Instrument)
3.2.4.8. Moisture (%): Determined by HVI (High Volume Instrument)
3.2.4.9. Spinning conceinty index (SCI): Determined by (High Volume Instrument)
4. FINDINGS AND DISCUSSION
4.1. Yield Components and Morphological Characteristics 4.1.1. Seed cotton yield (kg da-1)
Result from the analysis of variance of the seed cotton yield in the experiment is presented in Table 4.1.
Table 4. 1 Analysis of Variance for seed cotton yield
Source D.F Sum of Squares Mean Square F Ratio
Treatment 8 66053,05 8256,63 4,27** Replication 3 3731,88 1243,96 0,64 Error 24 46415,65 1933,99 C. Total 35 116200,58 C.V (%) 8.00 LSD (0.05) 64.18
*, ** ; Significant at P: ≤0.05 and P:≤ 0.01, respectively
As shown in the Table 4.1, it can be seen that there were highly significant (p<0.01)
differences between treatments for seed cotton yield.
Table 4. 2. Average values and statistical groups of seed cotton Yield
Treatment Seed Cotton Yield (kg/da-1)
Control 472,86 d (CP)seed 538,27 bc (CP)seed+square 564,05 ab (CP)seed+square+flower 577,56 ab (CP)seed+square+flower+boll 608,07 a (MF)seed 481,63 cd (MF)seed+square 552,38 ab (MF)seed+square+flower 570,66 ab (MF)seed+square+flower+boll 581,49 ab Mean 549,66
The differences between the treatments with respect to seed cotton yield were highly significant (p<0.01). According to the Table 4.2, seed cotton yield ranged between 472,86 - 608,07 kg da-1. The average seed cotton yield of treatments were
549,66 kg da-1. The highest seed cotton yield was obtained from (CP) seed+square+flower+boll (CP-SSFB) as 608,07 kg da-1, and the lowest yield was obtained from Control (472,86 kg da-1) treatment (Tab. 4.2). Phosphate solubilizing bacteria Bacillus sp significantly promoted and increased seed cotton yield and plant height Qureshi, 2012.
In Rudakifields, Phosphorus solubilizing bacterium (PSB) has been used to treatment cotton plant. The results show that this biofertilizer increased average yield significantly Yao et al., 2006.
Phosphorus Solubilizing Bacterium Bacillus megaterium has been used as biofertilizer inoculated to cotton. The results show that this biofertilizer increased seed cotton yield and plant height Akhtar et al., 2010.
Comparing our results to those of Qureshi (2012), Yao et al. 2006 and Akhtar et al. 2010. it is obvious that our obtained yield rate is higher than that all three of them despite using biofertilizers throughout their study.
4.1.2. Fiber yield (kg da-1)
Result from the analysis of variance of the Fiber/Lint Yield in the experiment is presented in Table 4.3.
Table 4. 3 Analysis of Variance for Fiber/Lint Yield
Source D.F Sum of Squares Mean Square F Ratio
Treatment 8 12327,33 1540,92 3,95** Replication 3 792,01 264,00 0,68 Error 24 9356,85 389,87 C. Total 35 22476,19 C.V (%) 8.15 LSD (0.05) 28.82
*, ** ; Significant at P: 0.05 and P: 0.01 , respectively
As shown in the Table 4.3, it can be seen that there were highly significant (p<0.01) differences between treatments for Fiber/Lint Yield.
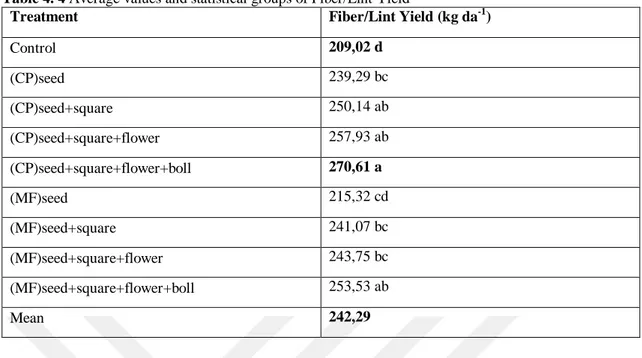
Table 4. 4 Average values and statistical groups of Fiber/Lint Yield
Treatment Fiber/Lint Yield (kg da-1)
Control 209,02 d (CP)seed 239,29 bc (CP)seed+square 250,14 ab (CP)seed+square+flower 257,93 ab (CP)seed+square+flower+boll 270,61 a (MF)seed 215,32 cd (MF)seed+square 241,07 bc (MF)seed+square+flower 243,75 bc (MF)seed+square+flower+boll 253,53 ab Mean 242,29
The differences between the treatments with respect to Fiber/Lint Yield were highly significant (p<0.01). According to the Tab. 4.4, Fiber/Lint Yield ranged between 209,02 – 270,61 kg da-1
. The average Fiber/Lint Yield of treatments were 242,29 kg da-1. The highest Fiber/Lint Yield were obtained from (CP)seed+ square+ flower+ boll (CP-SSFB) as 270,61 kg da-1, and the lowest yield were obtained from Control (209,02 kg da-1) treatment (Tab. 4.4). The combination of bio and chemical fertilizers improved mechanical and physical properties of fiber in cotton plant (Zewail et al. 2015). While in our experiment, we used only biofertilizer which led to the same results as those of the latter. Our outcome was a highly significant increase in the quality of Fiber/Lint likewise.
4.1.3. First flowering (day)
Result from the analysis of variance of First Flowering in the experiment is presented in Table 4.5.
Table 4. 5 Analysis of Variance for First Flowering Date
Source D.F Sum of Squares Mean Square F Ratio
Treatment 8 15,50 1,94 1,38 Replication 3 7,64 2,55 1,82 Error 24 33,61 1,40 C. Total 35 C.V (%) 1.86 LSD (0.05) ns
*, ** ; Significant at P: 0.05 and P: 0.01 , respectively
As shown in the Table 4.5, it can be seen that there were non-significant differences between treatments for First Flowering Date.
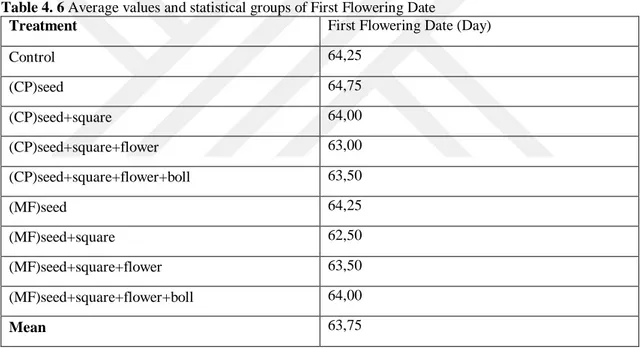
Table 4. 6 Average values and statistical groups of First Flowering Date
Treatment First Flowering Date (Day)
Control 64,25 (CP)seed 64,75 (CP)seed+square 64,00 (CP)seed+square+flower 63,00 (CP)seed+square+flower+boll 63,50 (MF)seed 64,25 (MF)seed+square 62,50 (MF)seed+square+flower 63,50 (MF)seed+square+flower+boll 64,00 Mean 63,75
The differences between the treatments with respect to first flowering date were non-significant. According to the Tab. 4.6, first flowering date ranged between 62,50 – 64,75 days. The average first flowering date of treatments were 63,75. The highest first flowering values were obtained from (CP)seed (CP - S) as 64,75, and the lowest first flowering values were obtained from (MF)seed+square (SS) treatment as 62,50 (Tab. 4.6).
Result from the analysis of variance of plant height in the experiment is presented in Table 4.7.
Table 4. 7 Analysis of Variance for Plant Height
Source D.F Sum of Squares Mean Square F Ratio
Treatment 8 137,81 17,23 0,33 Replication 3 46,89 15,63 0,30 Error 24 1269,03 52,88 C. Total 35 C.V (%) 7.60 LSD (0.05) ns
*, ** ; Significant at P: 0.05 and P: 0.01 , respectively
As shown in the Table 4.7, it can be seen that there were non-significant differences between treatments for plant height.
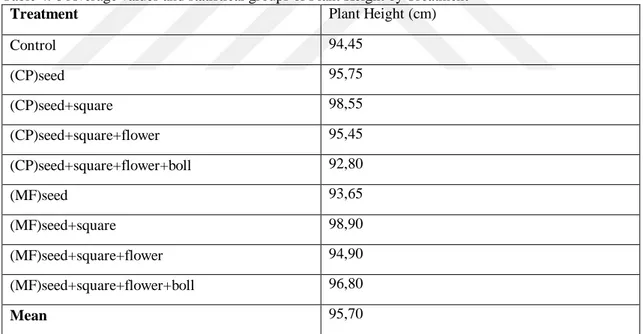
Table 4. 8 Average values and statistical groups of Plant Height by Treatment
Treatment Plant Height (cm)
Control 94,45 (CP)seed 95,75 (CP)seed+square 98,55 (CP)seed+square+flower 95,45 (CP)seed+square+flower+boll 92,80 (MF)seed 93,65 (MF)seed+square 98,90 (MF)seed+square+flower 94,90 (MF)seed+square+flower+boll 96,80 Mean 95,70
The differences between the treatments with respect to plant height were non-significant. According to the Tab. 4.8, plant height ranged between 92,80 – 98,90 %. The average plant height of treatments were 95,70 cm. The highest plant height values were obtained from (MF)seed+square (MF - SS) as 98,90 cm, and the lowest plant height values were obtained from (CP)seed+square+flower+boll treatment as 92,80 cm (Tab. 4.8).
Based on the above results, we can conclude that as to plant height, we did not have any significant increase despite using chemical fertilizer added to soil and biofertilizers by foliar spray in four different stages of growth. While Gomathy et al. (2008). Has obtained significant increase in the plant height by using chemical fertilizers together with biofertilizer (Azophosmet) used through drip irrigation. The difference between our results and those of Gomathy is due to environmental conditions, soil types and features or materials used throughout the study.
4.1.5. The number of monopodial branches (number / per plant)
Result from the analysis of variance of the number of monopodial branches in the experiment is presented in Table 4.9.
Table 4. 9 Analysis of Variance for Number of Monopodial Branches
Source D.F Sum of Squares Mean Square F Ratio
Treatment 8 4,84 0,61 2,32 * Replication 3 2,61 0,87 3,33 Error 24 6,27 0,26 C. Total 35 C.V (%) 65.23 LSD (0.05) 0,75
*, ** ; Significant at P: 0.05 and P: 0.01 , respectively
As shown in the table Table 4.9, it can be seen that there were significant (p<0,05) differences between treatments for number of monopodial branches.
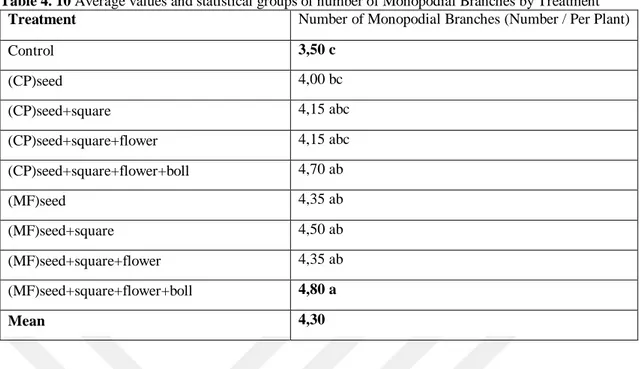
Table 4. 10 Average values and statistical groups of number of Monopodial Branches by Treatment
Treatment Number of Monopodial Branches (Number / Per Plant)
Control 3,50 c (CP)seed 4,00 bc (CP)seed+square 4,15 abc (CP)seed+square+flower 4,15 abc (CP)seed+square+flower+boll 4,70 ab (MF)seed 4,35 ab (MF)seed+square 4,50 ab (MF)seed+square+flower 4,35 ab (MF)seed+square+flower+boll 4,80 a Mean 4,30
The differences between the treatments with respect to number of monopodial branches were significant (p<0.05). According to the Tab. 4.10, number of monopodial mranches ranged between 3,50 – 4,80 per plant-1. The average number of monopodial branches of treatments were 4,30 per plant-1. The highest number of monopodial branches were obtained from (MF)seed+square+flower+boll (MF-SSFB) as 4,80 per plant-1, and the lowest number of monopodial branches were obtained from Control (3,50 per plant-1) treatment (Tab. 4.10).
Combination of plant growth promoting rhizobacteria (PGPR) applied to the soil together with its foliar spray, compost tea and biosol has been tested. On the other hand, PGPR has been used by applying to the underlying soil together with its foliar spray as well as compost tea. Both experiments led to a significant increase in the number of monopodial and sympodial branches as well as plant height (Zewail et al. 2015). In our results the monopodial branches increased significantly. Therefore (Zewail and Ahmed, 2015) corroborates our results.
4.1.6. The number of sympodial branches (number / per plant)
Result from the analysis of variance of the number of sympodial branches in the experiment is presented in Table 4.11.
Table 4. 11 Analysis of Variance for Number of Sympodial Branches
Source D.F Sum of Squares Mean Square F Ratio
Treatment 8 5,70 0,71 1,01 Replication 3 15,77 5,26 7,45 Error 24 16,93 0,71 C. Total 35 C.V (%) 7.93 LSD (0.05) ns
*, ** ; Significant at P: 0.05 and P: 0.01, respectively
As shown in the Table 4.11, it can be seen that there were non-significant differences between treatments for number of sympodial branches.
Table 4. 12 Average values and statistical groups of number of Sympodial Branches by Treatment
Treatment Number of Sympodial Branches (Number / Per Plant)
Control 10,40 (CP)seed 11,05 (CP)seed+square 11,10 (CP)seed+square+flower 10,10 (CP)seed+square+flower+boll 10,00 (MF)seed 10,20 (MF)seed+square 10,90 (MF)seed+square+flower 10,70 (MF)seed+square+flower+boll 10,85 Mean 10,59
The differences between the treatments with respect to number of sympodial branches were non-significant. According to the Tab. 4.12, number of sympodial branches ranged between 10,00 – 11,10 per plant. The average number of sympodial branches of treatments were 10,59. The highest number of sympodial branches values were obtained from (CP)seed+square (CP - SS) as 11,10, and the lowest the number of sympodial branches values were obtained from (CP)seed+square+flower+boll treatment as 10,00 (Tab. 4.12).
Combination of plant growth promoting rhizobacteria (PGPR) applied to the soil together with its foliar spray, compost tea and biosoal has been tested in cotton field. On the other hand, PGPR has been used by applying to the underlying soil together with its
foliar spray as well as compost tea. Both experiments led to a significant increase in the number of monopodial and sympodial branches as well as plant height (Zewail et al. 2015). In our experiment the cotton seed inoculated with COTON PLUS and MEGAFLU except for the control. At the same we sprayed all parts of the plant with foliar spray and applied chemical fertilizers to the underlying soil. Yet no significant results are achieved among treatments. Nonetheless, in (Zewail et al. 2015) sympodial branches were positively affected by all fertilizers.
4.1.7. Node number of first fruiting branches (number / per plant)
Result from the analysis of variance of node number of first fruiting branches in the experiment is presented in Table 4.13.
Table 4. 13 Analysis of Variance for Node Number of First Fruiting Branches
Source D.F Sum of Squares Mean Square F Ratio
Treatment 8 4,11 0,51 1,23 Replication 3 8,55 2,85 6,81 Error 24 10,04 0,42 C. Total 35 C.V (%) 8.31 LSD (0.05) ns
*, **; Significant at P: 0.05 and P: 0.01, respectively
As shown in the Table 4.13, it can be seen that there were non-significant differences between treatments for node number of first fruiting branches
Table 4. 14 Average values and statistical groups of node number of First Fruiting Branches By
Treatment
Treatment Node Number of First Fruiting Branches (Number / Per Plant)
Control 7.20 (CP)seed 7.60 (CP)seed+square 8.00 (CP)seed+square+flower 7.55 (CP)seed+square+flower+boll 7.90 (MF)seed 7.90 (MF)seed+square 7.95 (MF)seed+square+flower 7.55 (MF)seed+square+flower+boll 8.45 Mean 7.79
The differences between the treatments with respect to node number of first fruiting branches were non-significant. According to the Tab. 4.14, node number of first fruiting branches ranged between 7.20 – 8.45. The average value of the node number of first fruiting branches were 7.79. The highest node number of first fruiting branches values were obtained from (MF)seed+square+flower+boll (MF - SSFB) as 8.45, and the lowest values were obtained from control treatment as 7.20 (Tab. 4.14).
4.1.8. Number of boll per plant (number / per plant)
Result from the analysis of variance for number of boll per plant in the experiment is presented in Table 4.15.
Table 4. 15 Analysis of Variance for number of boll per plant
Source D.F Sum of Squares Mean Square F Ratio
Treatment 8 56,90 7,11 1,02 Replication 3 33,94 11,31 1,62 Error 24 166,92 6,95 C. Total 35 257,76 C.V (%) 12.63 LSD (0.05) ns
As shown in the Table 4.15, it can be seen that there were non-significant differences between treatments for number of boll per plant.
Table 4. 16 Average values and statistical groups of number of boll per plant by treatment
Treatment Number of boll per plant (Number / Per Plant)
Control 21,15 (CP)seed 21,20 (CP)seed+square 18,70 (CP)seed+square+flower 23,50 (CP)seed+square+flower+boll 21,35 (MF)seed 20,30 (MF)seed+square 19,60 (MF)seed+square+flower 21,10 (MF)seed+square+flower+boll 20,40 Mean 20,81
The differences between the treatments with respect to number of boll per plant were non-significant. According to the Tab. 4.16, number of boll per plant ranged between 18,70 – 23,50. The average number of boll per plant of treatments were 20,81. The highest number of boll per plant values were obtained from (CP)seed+ square+ flower (CP-SSF) as 23,50, and the lowest number of boll per plant values were obtained from (CP)seed+square (CP-SS) treatment as 18,70 (Tab. 4.16). The results of Patil et al. )2011) indicated that boll weight and number of bolls was significantly increased with inoculation of Azospirillum surat strain. But, our findings did not show any significant differences between treatments. However, the cotton seed inoculated with biofertilizers and applied soil chemical fertilizers.
4.1.9. Boll weight (g)
Result from the analysis of variance for boll weight in the experiment is presented in Table 4.17.
Table 4. 17. Analysis of Variance for boll weight
Source D.F Sum of Squares Mean Square F Ratio
Treatment 8 1,21 0,15 1,00 Replication 3 0,40 0,13 0,87 Error 24 3,62 0,15 C. Total 35 5,23 C.V (%) 5,77 LSD (0.05) ns
*, ** ; Significant at P: 0.05 and P: 0.01, respectively
As shown in the Table 4.17, it can be seen that there were non-significant differences between treatments for boll weight.
Table 4. 18 Average values and statistical groups of Variance for boll weight by treatment
Treatment Boll weight (g)
Control 6,32 (CP)seed 6,58 (CP)seed+square 6,55 (CP)seed+square+flower 6,78 (CP)seed+square+flower+boll 6,45 (MF)seed 6,58 (MF)seed+square 6,35 (MF)seed+square+flower 6,85 (MF)seed+square+flower+boll 6,80 Mean 6,58
The differences between the treatments with respect to boll weight were non-significant. According to the Tab. 4.18, boll weight ranged between 6,32– 6,85 g. The average boll weight of treatments were 6,58 g. The highest boll weight values were obtained from (MF)seed+ square+ flower (MF-SSF) as 6,85 g, and the lowest boll weight values were obtained from Control treatment as 6,32 g (Tab. 4.18).
Sawan, (2016 indicated that, the application of PGPR s) Cycocel and Alar in two stages of cotton growth (square and boll setting stages). The recorded data showed that boll weight increased significantly. However, in our experiment seed cotton dressed with biofertilizers and they applied as foliar spray in four different stages of growth
along with chemical fertilizers added to soil but, our findings did not show any significant differences between treatments.
4.1.10. Single boll seed cotton weight (g)
Table 4. 19 Analysis Variance for single boll seed cotton weight
Source D.F Sum of Squares Mean Square F Ratio
Treatment 8 0,71 0,09 0,93 Replication 3 0,15 0,05 0,51 Error 24 2,27 0,09 C. Total 35 3,13 C.V (%) 5,77 LSD (0.05) ns
*, ** ; Significant at P: 0.05 and P: 0.01, respectively
As shown in the Table 4.19, it can be seen that there were non-significant differences between treatments for single boll seed cotton weight.
Table 4. 20 Average values and statistical groups of single boll seed cotton weight by treatment
Treatment Single boll seed cotton weight (g)
Control 4,70 (CP)seed 5,02 (CP)seed+square 4,92 (CP)seed+square+flower 5,13 (CP)seed+square+flower+boll 4,82 (MF)seed 4,97 (MF)seed+square 4,90 (MF)seed+square+flower 5,15 (MF)seed+square+flower+boll 5,08 Mean 4,96
The differences between the treatments with respect to single boll seed cotton weight were non-significant. According to the Tab. 4.20, single boll seed cotton weight ranged between 4,70 – 5,15 g. The average single boll seed cotton weight of treatments were 4,96 g The highest single boll seed cotton weight values were obtained from
(MF)seed+square+flower (MF - SSF) as 5,15 g, and the lowest single boll seed cotton weight values were obtained from Control 4,70 g (Tab. 4.20).
4.1.11. Ginning percentage (%)
Result from the analysis of variance for Ginning Percentage in the experiment is presented in Table 4.21.
Table 4. 21 Analysis of Variance for Ginning Percentage
Source D.F Sum of Squares Mean Square F Ratio
Treatment 8 13,72 1,71 38,56 ** Replication 3 0,13 0,04 1,00 Error 24 1,07 0,04 C. Total 35 C.V (%) 0.48 LSD (0.05) 0,31
*, ** ; Significant at P: 0.05 and P: 0.01 , respectively
As shown in the Table 4.21, it can be seen that there were significant differences (p < 0.01) between treatments for Ginning Percentage.
Table 4. 22 Average values and statistical groups of Ginning Percentage by Treatment
Treatment Ginning Percentage (%)
Control 44,20 c (CP)seed 44,45 abc (CP)seed+square 44,35 bc (CP)seed+square+flower 44,65 ab (CP)seed+square+flower+boll 44,50 abc (MF)seed 44,70 a (MF)seed+square 43,65 d (MF)seed+square+flower 42,70 e (MF)seed+square+flower+boll 43,60 d Mean 44.09
The differences between the treatments with respect to ginning percentage were highly significant (p<0.01). According to the Tab. 4.22, ginning percentage ranged
between 42,70 - 44,70 %. The average ginning percentage of treatments was 44.09%. The highest ginning percentage were obtained from (MF)seed (MF - S) as 44,70 %, and the lowest ginning percentage were obtained from (MF)seed+square+flower (42,70 %) treatment (Tab. 4.22).
Combined Biofertilizers and macro elements have been used in cotton field, added to soil together with foliar spray to BT cotton. The results show that Ginning percentage and Lint index (g) were highly significantly increased and positively affected by biofertilizers (Laxman et al. 2017). While, according to our results, ginning percentage was higher than that obtained by (Laxman et al. 2017). The way we conducted our experiment is different from that of (Laxman et al. 2017) in that we performed the inoculation of Stoneville 468 with biofertilizer as foliar spray together with chemical fertilizer applied to soil. In Laxman the experiment has been conducted in a reverse manner, i.e. chemical fertilizer has been applied through foliar spray while biofertilizers have been applied to the underlying soil. However, Laxman yielded higher ginning percentage than that of its predecessors although ours was even more.
4.1.12. First picking percentage (%)
Result from the analysis of variance of the First Picking Percentage in the experiment is presented in Table 4.23.
Table 4. 23 Analysis of Variance for first picking percentage
Source D.F Sum of Squares Mean Square F Ratio
Treatment 8 189,33 23,67 2,22 Replication 3 55,60 18,53 1,74 Error 24 254,76 10,61 C. Total 35 499,69 C.V (%) 3.62 LSD (0.05) ns
*, ** ; Significant at P: 0.05 and P: 0.01 , respectively
As shown in the Table 4.23, it can be seen that there were non-significant differences between treatments for First Picking Percentage.
Table 4. 24 Average values and statistical groups of First Picking Percentage by Treatment
Treatment First Picking Percentage (%)
Control 91,54 (CP)seed 88,29 (CP)seed+square 92,16 (CP)seed+square+flower 93,09 (CP)seed+square+flower+boll 90,44 (MF)seed 90,23 (MF)seed+square 90,95 (MF)seed+square+flower 84,92 (MF)seed+square+flower+boll 88,85 Mean 90,04
The differences between the treatments with respect to first picking percentage were non-significant. According to the Tab. 4.24, first picking percentage ranged between 84,92 - 93,09%. The average first picking percentage of treatments were 90,04%. The highest first picking percentage values were obtained from (CP)seed+ square+ flower (CP-SSF) as 93,09%, and the lowest first picking percentage values were obtained from (MF)seed+ square+ flower (MF-SSF) treatment as 84.92% (Tab. 4.24).
In our experiment we applied two types of PGPR as biofertilizers namely COTON PLUS and MEGA FLU combined with chemical fertilizer. The results did not show any significant increase in the results of first picking percentage most probably because of environmental issues, the type and features of soil its or materials that have been used at work.
4.2 Technological Characteristics 4.2.1. Fiber fineness (micronaire)
Result from the analysis of variance of fiber fineness (mic.) in the experiment is presented in Table 4.25.
Table 4. 25 Analysis of Variance for fiber fineness (Micronaire)
Source D.F Sum of Squares Mean Square F Ratio
Treatment 8 0,38 0,05 1,09 Replication 3 0,26 0,09 2,03 Error 24 1,04 0,04 C. Total 35 C.V (%) 4.88 LSD (0.05) ns
*, ** ; Significant at P: 0.05 and P: 0.01 , respectively
As shown in the Table 4.25, it can be seen that there were non-significant differences between treatments for Micronaire values.
Table 4. 26 Average values and statistical groups of fiber fineness (Micronaire) by Treatment
Treatment Fiber Fineness (Micronaire)
Control 4,32 (CP)seed 4,14 (CP)seed+square 4,17 (CP)seed+square+flower 4,11 (CP)seed+square+flower+boll 4,24 (MF)seed 4,32 (MF)seed+square 4,42 (MF)seed+square+flower 4,38 (MF)seed+square+flower+boll 4,21 Mean 4,26
The differences between the treatments with respect to fiber fineness (micronaire values) were non-significant. According to the Tab. 4.26, Micronaire values ranged between 4,11 – 4,38 micronaire. The average Micronaire values of treatments were 4,26 micronaire. The highest Mic values were obtained from (MF)seed+square+flower (MF - SSF) as 4,38 micronaire., and the lowest Mic values were obtained from (CP)seed+square+flower (CP-SSF) treatment as 4,11 micronaire. (Tab. 4.26). Based on the above results, we do not see any significant improvement in the quality of