THE REPUBLIC OF TURKEY
BAHÇEŞEHİR UNIVERSITY
EFFECTS OF RECENT IVR
APPLICATIONS ON CALL CENTER
PERFORMANCE IN BANKING
SECTOR
M.S. ThesisUmut KÜÇÜKDURMAZ
THE REPUBLIC OF TURKEY
BAHÇEŞEHİR UNIVERSITY
THE GRADUATE SCHOOL OF NATURAL AND
APPLIED SCIENCES
INDUSTRIAL ENGINEERING
EFFECTS OF RECENT IVR
APPLICATIONS ON CALL CENTER
PERFORMANCE IN BANKING
SECTOR
M.S. Thesis
Umut KÜÇÜKDURMAZ
Supervisor: ASST. PROF. DR. DEMET ÖZGÜR ÜNLÜAKIN
THE REPUBLIC OF TURKEY
BAHÇEŞEHİR UNIVERSITY
The Graduate School of Natural and Applied Sciences Industrial Engineering
Title of the Master’s Thesis : Effects of Recent IVR Applications on Call Center Performance in Banking Sector Name/Last Name of the Student : Umut Küçükdurmaz
Date of Thesis Defense : 30.05.2014
The thesis has been approved by the Graduate School of Natural and Applied Sciences. Assoc. Prof. Dr. Tunç Bozbura Graduate School Director Signature
I certify that this thesis meets all the requirements as a thesis for the degree of Master of Science.
Assoc. Prof. Dr. Barış Selçuk Program Coordinator Signature
This is to certify that we have read this thesis and that we find it fully adequate in scope, quality and content, as a thesis for the degree of Master of Science.
Examining Committee Members:
Asst. Prof. Dr. Demet Özgür Ünlüakın (supervisor) :
Asst. Prof. Dr. Ahmet Beşkese :
ACKNOWLEDGEMENTS
First of all I would like to thank my thesis supervisor Asst. Prof. Demet Özgür Ünlüakın, who has given me the opportunity to work on this thesis. I’m very grateful for her support, guidance, encouragements and constructive insight to successful completion of this thesis.
I also would like to thank to my thesis examination committee; Asst. Prof. Dr. Ahmet Beşkese and Asst. Prof. Dr. İbrahim Muter for their time, patience and contributions.
Lastly, I would like to express my love and gratitude to my family and dearest friends; Zehra Saraç, Emre Küçükdurmaz, Ömer Barış Önal, Varol Bilgin and Murat Ulcay for their support, motivation and patience.
iv
ABSTRACT
EFFECTS OF RECENT IVR APPLICATIONS ON CALL CENTER PERFORMANCE IN BANKING SECTOR
Küçükdurmaz, Umut
Industrial Engineering Master Program Supervisor: Asst. Prof. Dr. Demet Özgür Ünlüakın
May 2014, 99 pages
Being efficient in every area of the economy has become increasingly important in order to have competitive advantage. Especially, service sectors’ increasing involvement in the world economy addresses people’s attention to the service sectors. Service sectors are getting much more important in the wealth of countries. Banking sector is one of the major areas in the service industry. As it is known, Call Center activities have a crucial effect on the overall performance of operations. Interactive Voice Response (IVR) System applications are one of the main functions of these activities.
IVR has a main role in the Call Center operations of any business. Thus, Call Center and IVR performance have direct influences in the firms’ success. In this thesis, an IVR and Call Center operation of a bank has directly been worked on. Three new IVR applications; Recognize Caller by ANI, Call Steering and Voice Verification are analyzed and their effect on Call Center performance have been executed.
v
ÖZET
GÜNCEL IVR UYGULAMALARININ BANKACILIK SEKTÖRÜNDE ÇAĞRI MERKEZİ PERFORMANSI ÜZERİNDEKİ ETKİLERİ
Küçükdurmaz, Umut
Endüstri Mühendisliği Yüksek Lisans Programı Tez Danışmanı: Yrd. Doç. Dr. Demet Özgür Ünlüakın
Mayıs 2014, 99 sayfa
Ekonominin her alanında etkin olmak, rekabet avantajı elde etmek için giderek daha önemli hale gelmiştir. Özellikle hizmet sektörlerin dünya ekonomisinde artan katılımı, bu sektörlere dikkat çekmektedir. Hizmet sektörleri ülkelerin güçlenmesi için de büyük önem arz eder. Bankacılık sektörü hizmet sektöründe önemli alanlarından biridir. Bilindiği üzere, Çağrı Merkezi faaliyetleri genel operasyon performansı üzerinde önemli bir etkisi vardır. IVR (Sesli Yanıt Sistemi) uygulamaları bu faaliyetlerin temel işlevlerinden biridir.
IVR’ların tüm sektörlerdeki Çağrı Merkezleri için önemli bir rolü vardır. Bu nedenle Çağrı Merkezi ve IVR performanının firmaların başarısında doğrudan etkileri bulunmaktadır. Bu tezde, bir bankanın IVR ve Çağrı Merkezi operasyonu doğrudan incelenmiştir. Üç yeni IVR uygulaması olan Recognize Caller by ANI, Call Steering ve
Voice Verification analiz edilmiştir. Ayrıca bu uygulamaların Çağrı Merkezi
performansı üzerindeki etkileri incelenmiştir.
Anahtar Kelimeler: Bankacılık Sektörü, Sesli Yanıt Sistemi, Çağrı Merkezi, Simülasyon
vi CONTENTS TABLES ... ix FIGURES ... xii SYMBOLS ... xiv ABBREVIATIONS ... xv 1. INTRODUCTION ... 1 2. LITERATURE REVIEW ... 4
2.1 ANALYTICAL SOLUTION PRACTICES ... 4
2.2 SIMULATION PRACTICES ... 7
3. BACKGROUND ... 10
3.1 QUEUEING SYSTEMS ... 10
3.2 CALL CENTER... 10
3.3 INTERACTIVE VOICE RESPONSE (IVR) ... 11
3.4 DEFINITION OF JARGONS AND PERFORMANCE METRICS... 13
4. PROBLEM DEFINITION ... 16
4.1 CURRENT FLOW ... 16
4.2 IVR MENU TREE ... 17
4.3 CALL CENTER AGENT CLASSIFICATION ... 18
4.4 IMPROVABLE POINTS ... 19
4.4.1 Customer Identification ... 19
4.4.2 Indication of the Functionality Desired... 19
4.4.3 Authorization of the Customer ... 20
4.5 PROPOSED APPLICATIONS ... 20
4.5.1 Recognize Caller by ANI ... 20
4.5.2 Call Steering ... 22
4.5.3 Voice Verification ... 23
5. SIMULATION MODEL FOR CURRENT CALL CENTER WORKFLOW ... 25
5.1 ACQUIRING OF DISTRIBUTION TIMES... 27
5.2 GENERAL OVERVIEW OF IVR ... 28
5.2.1 Configuration ... 28
5.2.2 Contact: Customer ... 31
5.2.3 Pattern: Call Pattern... 31
vii
5.4 PROCESS DISTRIBUTION VALUES FOR EACH IVR MENU... 35
5.5 CUSTOMER’S FINDING IVR MENU ... 36
5.6 CUSTOMER AUTHORIZATION WITH PIN ... 39
5.7 IVR PROCESSES ... 41
5.8 REQUESTS FOR ANOTHER IVR PROCESS OR TALKING TO AN AGENT AFTER AN IVR PROCESS ... 44
5.9 TRANSFER TO AGENT ... 46
5.9.1 Agent Configuration ... 47
5.9.2 Basic Skilled Agents ... 49
5.9.3 Basic+Security Skilled Agents ... 49
6. SIMULATION MODEL FOR CALL CENTER WORKFLOW WITH PROPOSED APPLICATIONS ... 51
6.1 TIME AND PROBABILITY VALUES ... 51
6.2 RECOGNIZE CALLER BY ANI FLOW ... 52
6.3 CALL STEERING FLOW ... 55
6.4 VOICE VERIFICATION FLOW ... 56
6.5 TIME AND PROBABILITY VALUES FOR PESSIMISTIC SCENARIO . 60 7. RESULTS AND DISCUSSION ... 62
7.1 RESULTS FOR CURRENT CALL CENTER MODEL ... 62
7.2 RESULTS FOR MODEL WITH RECOGNIZE CALLER BY ANI ... 65
7.3 RESULTS FOR MODEL WITH CALL STEERING ... 67
7.4 RESULTS FOR MODEL WITH VOICE VERIFICATION ... 69
7.5 RESULTS FOR MODEL WITH ALL THREE APPLICATIONS ... 72
7.6 COMPARISON OF RESULTS ... 75
7.6.1 Agent Utilization Ratios ... 75
7.6.2 Average Agent Counts for Available and Busy Status ... 76
7.6.3 Termination of Customers ... 77
7.6.4 Usage of IVR and Agent Ports ... 78
7.6.5 Average Call Durations ... 79
7.6.6 Customer Recognition Success... 80
7.6.7 Finding IVR Menus ... 81
7.6.8 Successful IVR Processes ... 83
7.6.9 Verification Success ... 85
viii
7.7.1 Agent Utilization Ratios ... 86
7.7.2 Average Agent Counts for Available and Busy Status ... 87
7.7.3 Termination of Customers ... 88
7.7.4 Usage of IVR and Agent Ports ... 89
7.7.5 Average Call Durations ... 90
7.7.6 Customer Recognition Success... 91
7.7.7 Finding IVR Menus ... 92
7.7.8 Successful IVR Processes ... 94
7.7.9 Verification Success ... 96
7.8 DISCUSSION ... 96
8. CONCLUSION ... 98
ix TABLES
Table 3.1: History of IVR systems ... 12
Table 3.2: History of IVR systems in Turkey ... 12
Table 3.3: Definitions of jargons mentioned in this thesis ... 14
Table 3.4: Definitions of performance metrics mentioned in this thesis ... 15
Table 4.1: Menus of Banking IVR ... 17
Table 5.1: Distribution time value results ... 28
Table 5.2: Calculation for required replication count ... 29
Table 5.3: IVR menu actions and inclusion in simulation ... 34
Table 5.4: Process distribution ratios ... 36
Table 5.5: 7 end points which are IVR functionality ... 42
Table 5.6: 2 end points which are directed to agent ... 42
Table 5.7: 3 end points which are excluded in simulation ... 42
Table 5.8: Distribution of ratios for next step after an IVR functionality ... 45
Table 5.9: Agent shifts ... 47
Table 5.10: Schedule of agents with Basic Skill in simulation ... 48
Table 5.11: Schedule of agents with Basic+Security Skill in simulation ... 48
Table 6.1: Probability values for proposed applications ... 52
Table 6.2: Duration values for proposed applications... 52
Table 6.3: Pessimistic probability values for proposed applications ... 61
Table 6.4: Pessimistic duration values for proposed applications ... 61
Table 7.1: Average agent counts for available and busy status for current call center model ... 63
Table 7.2: Percentage values for agent utilization for current call center model ... 63
Table 7.3: Customer counts in terms of ending point of calls for current call center model ... 63
x
Table 7.5: Average IVR port counts for available and busy status for current call center model ... 64 Table 7.6: Customer counts in terms of finding IVR menus for current call center model
... 64 Table 7.7: Customer counts in terms of successful IVR processes for current call center
model ... 64 Table 7.8: Average agent counts for available and busy status for model with Recognize Caller by ANI ... 65 Table 7.9: Percentage values for agent utilization for model with Recognize Caller by
ANI ... 65 Table 7.10: Customer counts in terms of ending points of calls for model with
Recognize Caller by ANI ... 65 Table 7.11: Average durations of a call for model with Recognize Caller by ANI ... 66 Table 7.12: Average IVR port counts for available and busy status for model with
Recognize Caller by ANI ... 66 Table 7.13: Customer counts in terms of finding IVR menus for model with Recognize
Caller by ANI ... 66 Table 7.14: Customer counts in terms of successful IVR processes for model with
Recognize Caller by ANI ... 67 Table 7.15: Customer counts in terms of successful Customer Recognition processes for
model with Recognize Caller by ANI ... 67 Table 7.16: Average agent counts for available and busy status for model with Call
Steering ... 67 Table 7.17: Percentage values for agent utilization for model with Call Steering ... 68 Table 7.18: Customer counts in terms of ending points of calls for model with Call
Steering ... 68 Table 7.19: Average durations of a call for model with Call Steering... 68 Table 7.20: Average IVR port counts for available and busy status for model with Call
Steering ... 68 Table 7.21: Customer counts in terms of finding IVR menus for model with Call
Steering ... 69 Table 7.22: Customer counts in terms of successful IVR processes for model with Call
Steering ... 69 Table 7.23: Average agent counts for available and busy status for model with Voice
xi
Table 7.24: Percentage values for agent utilization for model with Voice Verification . 70 Table 7.25: Customer counts in terms of ending points of calls for model with Voice
Verification ... 70 Table 7.26: Average durations of a call for model with Voice Verification ... 70 Table 7.27: Average IVR port counts for available and busy status for model with Voice Verification ... 71 Table 7.28: Customer counts in terms of finding IVR menus for model with Voice
Verification ... 71 Table 7.29: Customer counts in terms of successful IVR processes for model with Voice Verification ... 71 Table 7.30: Customer counts in terms of successful Customer Authorization processes
for model with Voice Verification ... 72 Table 7.31: Average agent counts for available and busy status for model with all three
proposed applications ... 72 Table 7.32: Percentage values for agent utilization for model with all three proposed
applications ... 72 Table 7.33: Customer counts in terms of ending points of calls for model with all three
proposed applications ... 73 Table 7.34: Average durations of a call for model with all three proposed applications 73 Table 7.35: Average IVR port counts for available and busy status for model with all
three proposed applications ... 73 Table 7.36: Customer counts in terms of finding IVR menus for model with all three
proposed applications ... 74 Table 7.37: Customer counts in terms of successful IVR processes for model with all
three proposed applications ... 74 Table 7.38: Customer counts in terms of successful Customer Recognition processes for
model with all three proposed applications ... 75 Table 7.39: Customer counts in terms of successful Customer Authorization processes
xii FIGURES
Figure 3.1: Incoming call flow of a standard IVR and call center ... 11
Figure 3.2: Schema of a call center with IVR trunk lines, queue and agents ... 13
Figure 4.1: Current IVR process flow ... 17
Figure 4.2: Schema of a call center with IVR trunk lines, queue and agents ... 19
Figure 4.3: Recognize Caller by ANI flow chart: ... 22
Figure 5.1: The whole simulation model ... 26
Figure 5.2: Configuration boxes in the simulation ... 28
Figure 5.3: Details of configuration boxes in the simulation ... 30
Figure 5.4: Warm-up Period criteria entry ... 30
Figure 5.5: Details for customers in the simulation ... 31
Figure 5.6: Call pattern details ... 32
Figure 5.7: Daily arrival pattern ... 32
Figure 5.8: Expected scenario to reach an IVR functionality ... 33
Figure 5.9: Steps of customer recognition in simulation ... 35
Figure 5.10: Decision box for success of recognition process ... 35
Figure 5.11: Steps of customer finding IVR menu in simulation ... 38
Figure 5.12: Decision box for success of customers' finding IVR menu ... 39
Figure 5.13: Steps of customer authorization with PIN in simulation ... 40
Figure 5.14: Decision box for customer’s having a valid PIN ... 41
Figure 5.15: Decision box for probability of customer’s entering PIN successfully ... 41
Figure 5.16: IVR menu flow in simulation ... 43
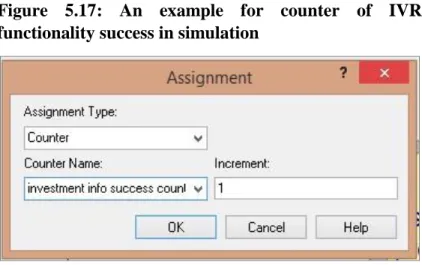
Figure 5.17: An example for counter of IVR functionality success in simulation ... 44
Figure 5.18: Transfer to agent flow in simulation ... 46
Figure 5.19: Decision box for PIN assignment in simulation ... 47
Figure 5.20: Basic skilled agent configuration in simulation... 49
Figure 5.21: Basic+Security skilled agent configuration in simulation ... 50
xiii
Figure 6.2: Decision box for finding GSM number by Recognize Caller by ANI flow . 54
Figure 6.3: Decision box for Recognize Caller by ANI flow in simulation ... 55
Figure 6.4: Call Steering flow in simulation ... 56
Figure 6.5: Decision box for success probability of Call Steering flow ... 56
Figure 6.6: Voice Verification flow in simulation in IVR ... 58
Figure 6.7: Voice Verification flow in simulation after call is diverted to agent ... 59
Figure 6.8: Decision box for having Voice Verification Signature ... 59
Figure 6.9: Decision box for accepting to sign Voice Verification Signature ... 59
Figure 6.10: Decision box for success ratio of Voice Verification process ... 60
Figure 6.11: Decision box for Voice Verification Signature assignment ... 60
Figure 7.1: Comparison of agent utilization ratios ... 76
Figure 7.2: Comparison of average agent counts ... 77
Figure 7.3: Comparison of call terminations ... 78
Figure 7.4: Comparison of usage of IVR and agent ports ... 79
Figure 7.5: Comparison of average durations ... 80
Figure 7.6: Comparison of customer recognition success counts ... 81
Figure 7.7: Comparison of counts of finding IVR menus ... 82
Figure 7.8: Comparison of counts of successful IVR processes ... 84
Figure 7.9: Comparison of authorization success counts ... 86
Figure 7.10: Comparison of agent utilization ratios ... 87
Figure 7.11: Comparison of average agent counts ... 88
Figure 7.12: Comparison of call terminations ... 89
Figure 7.13: Comparison of usage of IVR and agent ports ... 90
Figure 7.14: Comparison of average durations ... 91
Figure 7.15: Comparison of customer recognition success counts ... 92
Figure 7.16: Comparison of counts of finding IVR menus ... 93
Figure 7.17: Comparison of counts of successful IVR processes ... 95
xiv
SYMBOLS
ε : Accuracy level μ : Agent service rate
: Average of utilizations C : Cost
c : Count of servers λ : Customer arrival rate D : Discipline of the queue θ : IVR service rate p : Probability K : Queue capacity S : Size of the jobs α : Significance level N : Staffing level
xv
ABBREVIATIONS
ACD : Automatic Call Distribution
AHT : Average Handling Time
ANI : Automatic Number Identification
ASA : Average Speed of Answer
ATT : Average Talk Time
BMAP : Batch Markovian Arrival Process
CLI : Caller Line Identification
CRM : Customer Relationship Management
CTI : Computer Telephony Integration
DNIS : Dialed Number Identification System
DTMF : Dual-tone Multi-frequency
FCFS : First Come First Served
FIFO : First in First Out
ID : Identification
IVR : Interactive Voice Response
LAN : Local Area Network
LCFS : Last Come First Served
LIFO : Last In First Out
MAP : Markovian Arrival Process
MMPP : Markov Modulated Poisson Process
NOC : Network Operations Center
PH : Phase-type Distribution
PIN : Personal Identification Number
PNPN : Priority Service
PS : Processor Sharing
SIRO : Service In Random Order
VRU : Voice Response Unit
1. INTRODUCTION
Service sectors’ increasing involvement in the world economy addresses people’s attention to the service sectors. Service sectors are getting much more important in the wealth of countries. Banking sector is one of the major areas in the service industry. In last decades, competition between banking companies increasingly raised. Many of these companies service to their customers via Call Centers to increase customer satisfaction. Unfortunately, cost of answering customers directly by call center agents (customer representatives) is fairly high.
ContactBabel, a leading analyst firm for the contact center industry, compared the average costs of an Interactive Voice Response (IVR) session and a live agent call. They revealed that the average cost of an IVR self-service session is 65p, compared to £3.87 for a live agent call. At this point, answering customers by an IVR system and giving service to customers as much as possible with IVR system noticeably decreases service cost.
With this perspective, Call Center managers try to serve customers by IVR systems with numerous IVR services. However 3 main requirements come up for all IVR systems with far-reaching services, as described in Chapter 4 of this thesis;
a. Customers are required to recognize themselves to system,
b. They are required to authorize themselves with a customer specific code as a password,
c. They are required to enter to related IVR menu by dialing menu numbers as commands.
Banking companies have customers with different background and different technical adequacy. IVR requirements may reduce usability of IVR systems for some of these customers. When a customer cannot use IVR for his or her need, this may end up with loss of customer satisfaction or need of an agent for service.
Many of third parties that focus on call center and IVR services, produce new IVR applications to help increasing IVR usage and to reduce the need of an agent indirectly.
2
Three of these IVR applications noticeably come to the forefront; Recognize Caller by ANI, Call Steering and Voice Verification. These applications are mostly used in telecommunication sector and also being popular in banking sector day by day.
Recognize Caller by ANI application searches customer database for customer’s caller ID and tries to authenticate the customer without requesting any customer ID.
Call Steering application requests customer to command IVR by talking instead of dialing IVR menu numbers. Application resolves the voice command and matches the command with an IVR service.
Voice Verification application uses customer’s voice as a password application and authenticates the customer without entering any customer specific password code.
Though there are many articles and theses about IVR systems and call centers, there is no academic resource to reveal how recent IVR applications affect IVR and call center performance. This thesis is written to inform readers about recent IVR applications and their effect on IVR and call center performance.
Customers’ daily arrival pattern, distribution times and customer behavior (usage counts) in call center are taken from database records of a bank which are set in simulations.Five simulation models are built to analyze effect of proposed applications to the recent call center performance. Simulation models in this thesis are;
a. Model for current call center workflow b. Model with Recognize Caller by ANI c. Model with Call Steering
d. Model with Voice Verification
e. Model with Recognize Caller by ANI, Call Steering and Voice Verification
Agent utilization, counts of call ending point, average durations, utilization of IVR and agent ports, counts of successful processes are leading performance criteria which are used for comparison of simulation results.
3
simulation practices. Chapter 3 gives some background information about queueing systems, call center, IVR, definition of jargons and performance metrics, Recognize Caller by ANI, Call Steering and Voice Verification. The problem is defined in Chapter 4. Recent call center workflow is simulated in Chapter 5. Call center workflow with proposed applications are simulated in Chapter 6. Chapter 7 includes results and discussion and Chapter 8 contains conclusion.
4
2. LITERATURE REVIEW
Previous research on call centers has focused on different areas. However, there is a need for research in the area of new IVR applications to improve IVR and total call center performance. This thesis provides a comparison between standard IVR model and IVR with new applications such as Recognize Caller by ANI, Call Steering and Voice Verification with a focus on processes done in IVR.
Previous researches for IVR and call center performance are summarized in sections below. First section contains analytical solution practices and second section contains simulation practices.
2.1 ANALYTICAL SOLUTION PRACTICES
Gans et al. (2003) provide information about call centers that come out with operational problems. Mathematical models for call center management are in focus. Analytical models that support capacity management are also revealed. Models of single type customers and single skill agents, models with busy signals and abandonment, skill based routing, call blending and geographically dispersed call centers are examined.
Khudyakov (2006) analyses the case with homogeneous customers and homogeneous agents. To make the model analytically tractable, it is assumed that arrivals are Poisson, service times are exponential and there are no retrials. With these assumptions, the underlying stochastic processes are one-dimensional Markov processes. As given the present state, it is assumed that the future behavior is independent of the past conditionally.
Borst et al. (2004) produce a framework for a queueing system’s asymptotic optimization. The staffing problem of large call centers is in focus. It is modeled as M/M/N queues with N, the number of agents in a large call center. Optimal staffing level is searched which trades off agents’ costs with service quality. As an alternative to this optimization, an approach for constraint satisfaction is developed which links to a given constraint on waiting cost. In both ways, three regimes of operation are found:
5
a. Service quality is on the focus in quality-driven regime, b. Agents’ costs are emphasized in efficiency-driven regime, c. A rationalized regime which balances and unifies the other two.
The utility of the approach revealed is also demonstrated by revisiting the square-root safety staffing principle.
Salcedo-Sanz et al. (2010) obtained service trees which are near-optimal and figures the structure of the desired call center by presenting an evolutionary algorithm based on Dandelion encoding. To be able to adapt original Dandelion encoding to particular service tree design problem, they modified it. Systematic experiments have been analyzed to show the performance of their approach:
a. Different synthetic instances were analyzed for various aspects of the proposed evolutionary algorithm,
b. A real application was analyzed; the design of an Italian telecommunications company call center.
In all carried out experiments, their approach was compared with a lower bound based on information theory for the problem, and also with Huffman algorithm results.
Johan Joubert du Preez (2008) implemented a model for a call center. The implementation resulted successfully. In the whole model; Workforce Management, staffing model, forecasting model and scheduling model were covered.
Massey et al. (2004) developed formulas and algorithms to find the minimum number of call center agents and telephone lines required to provide a supply the service level needed. They also indicated Erlang C-Formula. Number of agents asymptotically derived and number of spaces waiting in the buffer are found by a fixed point equation which is solved iteratively.
Brandt et al. (1997) focused on finding optimal parameters for automatic call distribution (ACD) systems. An ACD system is a device or system which distributes incoming calls to specific agents. Customer needs, customer types, and agent skill set
6
are in focus, which also usually are a part of computer telephony integration (CTI) system. The model is based on a multi-server combined loss/waiting system with impatient customers. In the ACD model is considered, an announcement is given before entering the service. During the announcement, approximations for all performance characteristics are provided. With a flexible ACD cost model, finding cost optimized ACD system parameters under pre-defined service quality constraints is possible.
Srinivasan et al. (2002) revealed and analyzed a flow controlled network model. Voice Response Unit (VRU) and the agents are involved as resources. Poisson arrivals and exponential processing time at the VRU and exponential talk time are assumed. The number of agents and trunk lines required are simultaneously determined. A second
M|M|S|N queueing model which ignores the role of the VRU, where S is the number of
agents and N is the number of trunk lines, determines the optimal S and N subject to constraints.
Robbins et al. (2006) showed that the arrival rate assumptions highly effect call center staffing models. Call centers with lower volume suffer equal or greater disruption from shifts in call volume. When arrival rates’ variable is high, theoretical models that assume a known arrival rate are suspect.
Robbins et al. (2007) revealed that reducing operating costs by partial pooling depends on different project combinations. In some cases, adding more agents to agent pool allows improvement on efficiency in service level but in other cases pooling causes redundant capacity.
Parwan Electronics Corporation (2009) released a write up about IVR systems. It is mentioned that an IVR only can be as good as how it is designed. A poor design may cause more harm because of decreased customer satisfaction based on an IVR implementation. Three main criteria are highlighted:
a. Scalability: An IVR should be easy to modify to support changing needs.
b. Performance: IVR should be able to handle incoming lines at maximum capacity. c. Customer satisfaction: IVR should be designed considering the customer needs.
7
Raju (2002) mentioned that by using tools such as Voice XML, servlets and Java Speech Grammar Format; he created voice application that supplies efficient speech user interface and user friendly environment. He established improvements in the following aspects;
a. Minimizing fetching delays, b. Grammar development, c. Email reader.
Tezcan et al. (2012) inspected an optimization problem. They focus on minimizing total cost associated with staffing and customer abandonments when the arrival rate is large, the solution method proposed is asymptotically optimal.
Kim et al. (2013) revealed that queue systems which work as tandem systems are utilizable for call centers with IVR systems. There are limited service lines in the first stage while the second stage has a limited buffer and limited service lines. Calculation is done for the main performance measures.
Duder et al. (2001) mentioned that abandonments might be experienced if service level is close to 100 percent and additional agents should be supplied to decrease abandonments to decrease costs originated from losing customers. A linear regression between average speed of answer and percent abandonment (R-squared value > 0.9). In order to approximate the number of agents required to attain different values of average speed of answer, given expected call volumes and average turnaround time for a particular quarter hour, a standard M/M/c queueing model is used in commercial call center staffing systems.
2.2 SIMULATION PRACTICES
Bapat et al. (1998) revealed that the simulation is a very strong tool for call center management. The two main reasons for using simulation tools for call center management are; call centers’ widely complex environment and the need of simulation before integration of technological changes. Simulation technology also extends the
8
capability of existing tools. Simulation brings the ability to study the impact of change in call centers without trial-and-error. The risk of making poor decisions and dissatisfaction of customers are minimized. By simulation, proactive planning gives better results than reactive decision-making. It is more likely to respond to the sudden changes and decrease the level of unpredictability in caller behavior. They also inspected call center entities and resources. The trunk lines, IVR and agents are resources for the customers calling. Customers enter and navigate through the system, seizing available resources when needed, often requiring several resources at once, and eventually releasing the seized resources upon exiting the system.
Kungle (1999) presented that by simulation improves the performance and makes the visualization, analysis and enhancement of call center processes possible. It is a far good approach that prevents many difficulties of analytical models and assumptions.
Franklin (2010) examined Erlang-C based estimation formulas. Number of agent positions and queue parameters are set. However, recent trends such as Skill Based Routing (SBR), electronic channels and interactive call handling demand more sophisticated techniques. He or she revealed that Erlang-based calculations are restrictive and sometimes incapable of analyzing call center business needs. They indicated the advantages of simulation in call center modeling such as simultaneous queueing, customer abandonment patterns, priority in queueing and agent schedules.
Mehrotra et al. (2003) focused on call center simulation and evaluated sixteen scenarios. They emphasized that, with simulation it is possible to produce many detailed statistics and different parameters to examine any number of other cases by simulation modeling of call center. Within the call center industry, it is determined that there are 3 major methods for utilization of simulation:
a. Traditional Simulation Analysis: With inputs obtained from a variety of data sources, a specific operation is analyzed within this model.
b. Embedded Application – ACD/CTI Routing: ACD and CTI applications which contain a routing simulation to provide the impact of different decisions.
c. Embedded Application – Agent Scheduling: Optimal call center agent scheduling which both calls and agents are nonhomogeneous.
9
Kuhl et al. (2006) revealed that, with inputs taken from a variety of data sources, simulation fits to be the most viable option for subsequent decision support and accurate performance measurement. They informed that skill staffing, arrival-rate uncertainty and time dependence, control, performance analysis and skill based routing are main criteria for analytical models.
L’Ecuyer et al. (2014) presented a wider investigation of service times for a call center which has different agent groups and different types for incoming calls. It is seen that for a particular call, competences of agents influences service times. Service times may change by different times. Stochastic models are built which consider these factors.
Macal et al. (2013) introduces Modeling & Simulation Grand Challenges from an Operational Research/Management Science (OR/MS) point of view and negotiates topics including simulation analysis, worthiness of information, data modeling, stochastic modeling and optimization.
10
3. BACKGROUND
This chapter contains background information about this thesis. Sections of this chapter are respectively; Queueing Systems, Call Center, Interactive Voice Response and Definitions of Jargons and Performance Metrics.
3.1 QUEUEING SYSTEMS
Queueing system involves customer’s waiting for service, leaving the queue when the server is ready for him or her, getting the service, and leaving the service his or her service completes.
Kendall (1953) evolved the standard notation throughout the queueing literature. A queueing process is described as x/y/a/b/c, where x represents the arrival-time distribution, y represents the service model, a represents the number of server lines, b represents the restriction on capacity and c represents the discipline of the queue.
Customer impatience can be defined by three conditions; balking, reneging and jockeying. When the queue is full with waiting customers or waiting time is at its highest level possible etc. a task may not be accepted in queue. In this case, that task balks. When task owner leaves the queue before the server is ready for a new customer, the task reneges. In a multiple service line system, the task may switch to another server. In this case, the task is jockeying.
3.2 CALL CENTER
A call center typically is built of telephone trunk lines, a distributor machine known as the Automatic Call Distributor, an IVR and agents to handle the calls.
An inbound call center is a work place used for responding incoming calls. Outbound call centers are operated with agents who call customers for telemarketing, market research or debt collection.
11
Usually, each agent has a telephone set and/or headset which is connected to a corporate network. Mostly calls are managed by a system called Computer Telephony Integration (CTI).
Company’s customer relationship management (CRM) usually directs call center oparations.
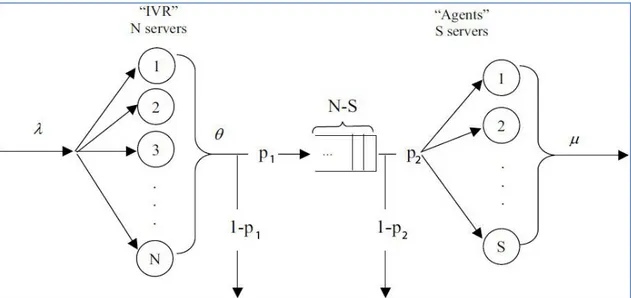
Incoming call flow of a standart IVR and call center is given in Figure 3.1.
Figure 3.1: Incoming call flow of a standard IVR and call center
Source: Polina, K., 2006. Designing a Call Center with an IVR.
Definitions of symbols given in schema: λ: arrival rate
θ: Service rate of IVR μ: Service rate of agent p: Probabilities
N: Number of IVR trunk lines S: Number of agents
3.3 INTERACTIVE VOICE RESPONSE (IVR)
IVR is the system which uses caller’s voice and dual-tone multi-frequency (DTMF) tones as inputs via keypad, to interact with humans.
12
IVR’s are able to;
a. Transfer calls to the most related agent or function depending on customers’ IVR input. As calls are directed to agents, the probability that the caller will be transferred to the wrong agent or department will be significantly reduced.
b. Collect information about customer’s needs.
c. Obtain the information for customers without need of any agent. d. Replace a receptionist who directs calls to customer representatives. e. Prioritize the calls based on the customer’s value.
IVR’s usually service for calls with high volume and reduce costs. IVR is also used to be able to service in out of working hours of a day.
History of IVR Systems is given in the Table 3.4.
Table 3.1: History of IVR systems
Year Development
1962 Bell Systems unveiled the first telephone that could dial area codes using DTMF technology.
1970 Deployment of IVR technology started to automate tasks in call centers.
Early 1980s First cost effective IVR was implemented by Perception Technology Late 1990s Speech recognition started to be implemented in IVRs
History of IVR Systems in Turkey is given in the Table 3.5.
Table 3.2: History of IVR systems in Turkey
Year Development
1991 The first interactive voice response systems in Turkey were implemented at Pamukbank.
2001 First speech recognition application was implemented in Global Menkul Değerler
13
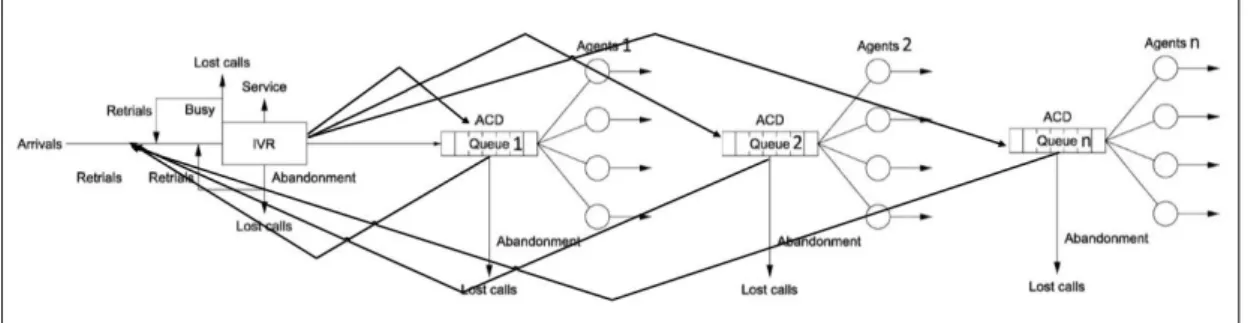
A schema of an inbound call center is given in Figure 3.2. There are ‘n’ agent groups who serve to ‘n’ types of customers. Even it is in IVR or in servers' pool, a call occupies a trunk line. As shown, calls are distributes to ‘n’ queues and an impatient customer may leave before call is answered by an agent. An abandoning or blocked caller might try once more (retrial).
Figure 3.2: Schema of a call center with IVR trunk lines, queue and agents
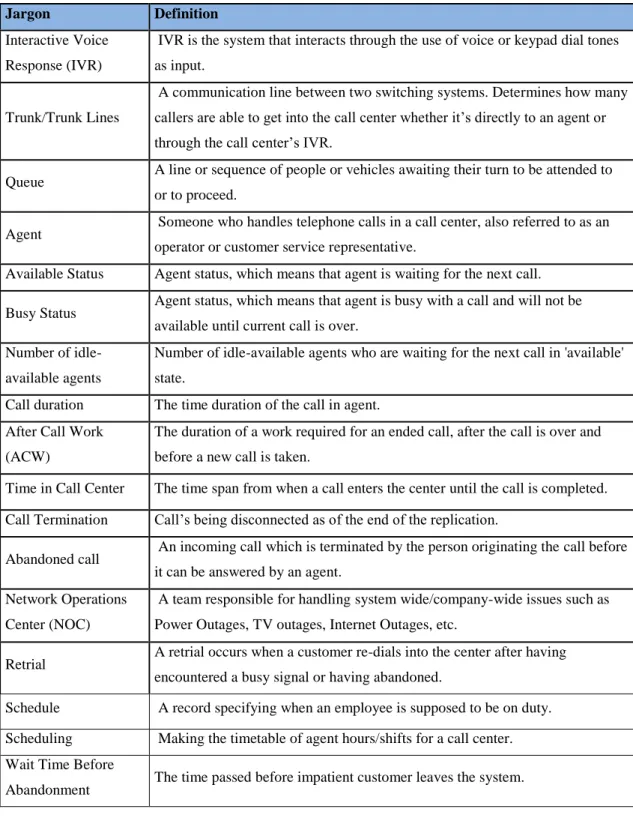
3.4 DEFINITION OF JARGONS AND PERFORMANCE METRICS
In this thesis many jargons and performance metrics are being mentioned. In this section, definitions of jargons and performance metrics mentioned in this thesis are respectively given in the Table 3.3 and Table 3.4.
14
Table 3.3: Definitions of jargons mentioned in this thesis Jargon Definition
Interactive Voice Response (IVR)
IVR is the system that interacts through the use of voice or keypad dial tones as input.
Trunk/Trunk Lines
A communication line between two switching systems. Determines how many callers are able to get into the call center whether it’s directly to an agent or through the call center’s IVR.
Queue A line or sequence of people or vehicles awaiting their turn to be attended to
or to proceed.
Agent Someone who handles telephone calls in a call center, also referred to as an
operator or customer service representative.
Available Status Agent status, which means that agent is waiting for the next call.
Busy Status Agent status, which means that agent is busy with a call and will not be
available until current call is over. Number of
idle-available agents
Number of idle-available agents who are waiting for the next call in 'available' state.
Call duration The time duration of the call in agent.
After Call Work (ACW)
The duration of a work required for an ended call, after the call is over and before a new call is taken.
Time in Call Center The time span from when a call enters the center until the call is completed.
Call Termination Call’s being disconnected as of the end of the replication.
Abandoned call An incoming call which is terminated by the person originating the call before
it can be answered by an agent. Network Operations
Center (NOC)
A team responsible for handling system wide/company-wide issues such as Power Outages, TV outages, Internet Outages, etc.
Retrial A retrial occurs when a customer re-dials into the center after having
encountered a busy signal or having abandoned.
Schedule A record specifying when an employee is supposed to be on duty.
Scheduling Making the timetable of agent hours/shifts for a call center.
Wait Time Before
15
Table 3.4: Definitions of performance metrics mentioned in this thesis Performance Metric Definition
Average Talk Time (ATT)
The average amount of time the agent spends talking to a caller, starting from time caller reaches an agent until the call is released. Also known as Average Call Duration.
Average Handling Time (AHT)
How long on average an agent spends on each call. AHT includes the work done after the call is released and before a new call is taken.
Average Speed of Answer (ASA)
How long on average the caller waits on hold before the call is answered by an agent. Also known as Average Wait Time.
Average Agents with Available Status
The average number of agents available throughout the timeslot. In simplest term;
Average available agents = Total available time * Scheduled Agents / Total time
Average Agents with Busy Status
The average number of agents busy throughout the timeslot. In simplest term; Average busy agents = Total busy time * Scheduled Agents / Total time Ratio of idle-available
agents
Ratio of idle-available agent number who are waiting for the next call in 'available' state, compared to total number of agents.
Agent Utilization
The average utilization of agents throughout the timeslot. The percentage of time, call center agents are on calls or in after-call work, divided by the time they are logged in. This metric also can be calculated by average busy agent count divided by average of total agent count in a time slot.
Ratio of Abandoned
call Ratio of abandoned calls to total calls.
Average of Total Time in Contact Center
Average of Total Time in Contact Center is the sum of averages of Time Spent in IVR, Time Spent in Queue (which is also mentioned as Speed of Answer) and Handle Time of Agent.
Port Utilization
The average utilization of ports (trunks) throughout the timeslot. The percentage of time, ports are ready to service customers, divided by the time they are busy. This metric also can be calculated by average port count divided by total port count in a time slot.
Ports Blocked Average number of ports (trunks) which are blocked by other customers and
16
4. PROBLEM DEFINITION
Inspected operation is a bank’s IVR and call center, which receives 63.650 call in average per day. Because of incoming call number is rather high, IVR has a very important role in meeting customers’ needs and decreasing costs of call services by terminating calls in IVR as much as possible.
As it is known that IVR and agent port count is high enough to answer 100 percent of the calls in any time of the day, there is no risk of getting busy signal because of port unavailability.
To complete a call in IVR, it is required to serve customer the functionality he or she need in IVR. 3 main requirements for customers to make a transaction with needed functionality in IVR are;
a. Customer identification,
b. Indication of the functionality desired to system,
c. Authorization of the customer to reach the functionality desired for security purposes.
This thesis aims to define improvable points of IVR which meet these requirements, propose suggestions and reveal effects of these suggestions.
4.1 CURRENT FLOW
There are 4 main steps in the IVR flow as given below; a. Customer recognition (identification) process,
b. Customer’s finding IVR menu (indication of the functionality desired to system), c. Customer authorization with PIN (authorization of the customer to reach the
functionality desired for security purposes). d. Running the IVR functionality desired.
17
Though IVR is enriched with many self-service functionalities for customers, lack of usability in first 3 requirements above, may cause IVR functionalities not to be used at maximum level. In this case customer will be transferred to an agent. Even IVR functionality is run as fourth requirement, customer may still need help of an agent. Current IVR process flow is given in Figure 4.1.
Figure 4.1: Current IVR process flow Customer Recognition Process Customer connects to IVR Customer’s finding IVR menu Customer Authorization with pin IVR Process Customer disconnects Distribution Is pin assigned to customer? Unsuccessful Successful Distribution Successful Unsuccessful Distribution Successful Unsuccessful Distribution Complete
Need for agent
Another process
Transfer to agent
4.2 IVR MENU TREE
Banking IVR inspected has a large number of IVR menus which are categorized by their transaction type in Table 4.1.
Table 4.1: Menus of Banking IVR
Menu Address Menu-Functionality Name Menu
Level
1. Banking Transactions 1
1.1. Account Transactions 2
1.1.1. Account Balance Info 3
1.1.2. Account Balance Receipt by Email 3
1.2. Money Transfer 2
1.3. Investment Info 2
1.4. Bill Payment 2
2. Credit Card Transactions 1
2.1. Credit Card Receipt Transactions 2
2.1.1. Credit Card Receipt Info and Payment 3
2.1.2. Credit Card Receipt by Email 3
2.3. Credit Card Limit Info 2
2.4. Credit Card Campaign Info 2
3. Password Transactions 1
4. Internet and Mobile Banking Support 1
18
4.3 CALL CENTER AGENT CLASSIFICATION
There are 2 classification of agents based on their skills:
a. Agents with Basic Skill: These agents are newly employed agents. They are supposed to answer calls of customers who successfully enter their PIN in IVR. These agents don’t do the security check to customers and directly service customers.
b. Agents with Basic+Security Skill: These agents are experienced enough and skilled in security check of customers based on bank’s procedure. They are supposed to answer calls of customers who don’t have PIN or couldn’t enter their PIN in IVR. These agents are able to do the security check to customers before satisfying their needs.
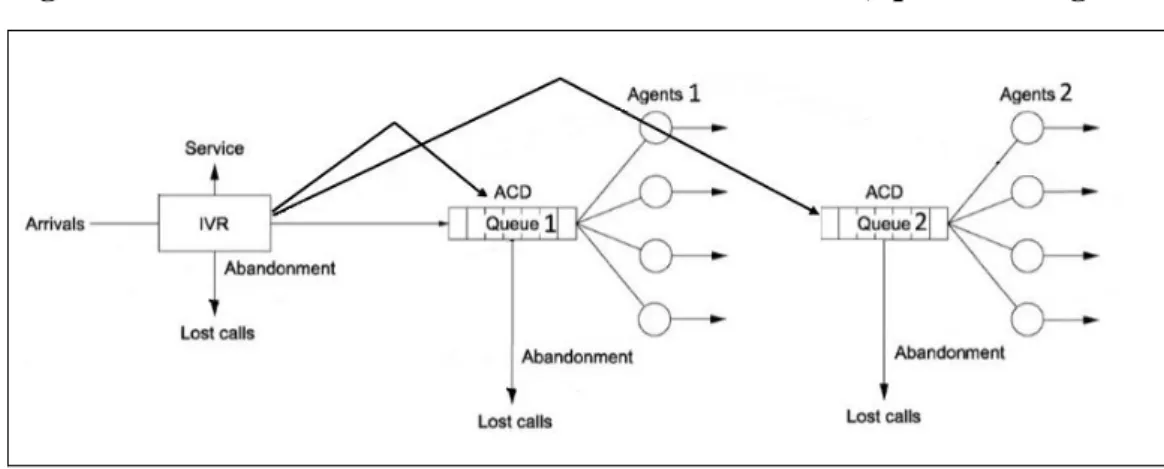
A schema of an inbound call center is given in Figure 4.2. The figure depicts a schematic model of an inbound call center with 2 agent groups, serving to 2 class of customers as in simulation model. As shown, calls are distributes to 2 queues and an impatient customer may leave before call is answered by an agent. To make the simulation models analytically tractable, it is assumed that there are no retrials, queues are separate and a customer cannot be transferred to one queue from the other.
19
Figure 4.2: Schema of a call center with IVR trunk lines, queue and agents
4.4 IMPROVABLE POINTS
As mentioned before, 3 main requirements for customers to make a transaction with needed functionality in IVR are;
a. Customer identification,
b. Indication of the functionality desired to system,
c. Authorization of the customer to reach the functionality desired for security purposes.
4.4.1 Customer Identification
At the beginning of IVR session, after the greeting announce, customer is requested to enter his customer number to be recognized. Unfortunately some of customers may not remember or enter their customer numbers as quick as requested. This may cause identification process to get longer than expected or may fail.
4.4.2 Indication of the Functionality Desired
Banking IVR menus usually have a large number of IVR menus which are categorized by their transaction type. By categorization, serving customers with unlimited IVR functionalities is made possible. However, an IVR tree with three or more branches may be confusing depending on the complexity of IVR tree.
Customers are expected to get to IVR functionalities by dialing menu numbers until they reach to the functionality which will satisfy their need. When a customer is not
20
capable to find IVR functionality which will satisfy his or her need, or if the IVR tree is not reasonably simple; customer may be lost in menus. In this situation indication of the functionality desired gets longer than expected or may fail.
4.4.3 Authorization of the Customer
For security purposes, customers have to be authorized to reach the functionality desired.
Customers are usually not willing to create a numerical password or they enter wrong passwords for authorization process, even they created a password before. Because of legal obligations, banking companies have to push their customers to create difficult to guess and complex passwords, which usually causes customers to avoid to create one or to forget their passwords because of not using so often. Not having or not entering a password to system cause customer to connect to an agent for authorization process and this situation avoids the need to be satisfied by IVR functionality.
For authorization process agents doing security check with customer also increases agents total talk time and decreases performance of call center.
4.5 PROPOSED APPLICATIONS
This section contains information about Recognize Caller by ANI, Call Steering and Voice Verification which are proposed as solutions for improvable points explained in the previous section.
4.5.1 Recognize Caller by ANI
Recognize Caller by ANI is an IVR application which allows company to recognize its customers by customers’ registered phone numbers in company’s database. When a customer calls call center, ANI of the caller is searched through customer database and when it matches with a customer’s registered phone number, caller is identified as
21
potential matched customer.
After recognizing the customer, the next step is announcing customer’s name and surname with Text to Speech technology to customer. Customer is requested to make a selection if he or she is recognized customer or not;
a. If customer denies recognized customer info (if the customer is somebody else) then the customer is requested to enter his or her customer identification number for recognition process.
b. If customer does not deny that he or she is the recognized customer, recognition process becomes completed.
Recognize Caller by ANI strengthen IVR functionality. It purposes to;
a. Impress customer by recognizing him or her without entering any customer info, b. Decrease time spend in authentication process,
c. Minimize number dialing in IVR session.
22
Figure 4.3: Recognize Caller by ANI flow chart:
Customer is requested to identify himself by entering customer identification number. Is customer recognized by ANI? Yes No Recognized customer name and
surname is announced by Text to Speech technology. Did customer make a selection? No Yes Customer is requested to make a selection if he is not the recognized
customer. Customer name and
surname is retrieved. Database Recognize Caller by ANI Router Customer identification starts End of customer identification ANI is searched through customers’ safe contact numbers. Database Customer identification info entered by customer is searched. Database 4.5.2 Call Steering
In the simplest term, Call Steering is an IVR application which directs customer to IVR functionalities by voice command instead of dialing telephone keypad.
Call Steering;
a. Requests customer to give his or her command with voice, b. Listens to customer’s speech,
c. Comprehends the command, d. Converts voice to text,
e. Matches text with related IVR menu or IVR functionality.
Call Steering strengthens IVR functionality. It purposes to; a. Prevent customer to be lost in IVR menus,
b. Decrease time spend in IVR for searching for IVR functionality, c. Prevent customer to need getting familiar to IVR menu tree, d. Minimize number dialing in IVR session,
23
4.5.3 Voice Verification
Voice Verification is a service which authorizes a person from his or her voice, by comparing recently recorded voice’s model to existing voice model if they match in an acceptable level.
Customers need to authorize themselves to be able to receive customer specific info or make a financial transaction. Account Balance Info and Investment Info may be examples for IVR menus which supplies customer specific info. Money Transfer, Bill Payment and Credit Card Receipt Payment may be examples for IVR menus which makes financial transactions.
One of most common problems in service channels like IVR systems and call centers is customers’ unwillingness to create a numerical password or entering wrong passwords for authorization process. Because of legal obligations, many service industry companies push their customers to create difficult to guess and complex passwords, which usually causes customers to avoid to create one or to forget their passwords because of not using so often. At this point, companies evaluate new authorization applications such as Voice Verification.
Prior condition of Voice Verification is customer’s creating his or her voice signature. After customer recognition process is completed, system checks if customer has a voice signature. If not, customer is requested to create one. If customer accepts the offer, for once, he or she is verified with manual security check. Then system records customer’s voice signature model.
In next call, after customer recognition process is completed, system finds voice signature ownership for that customer. Then, application requests customer to authorize himself or herself by voice signature. After customer’s recent voice record is taken, application compares recent voice model with existing voice model.
When recently recorded and existing voice model matches in an acceptable level, system authorizes customer without any further security check process or customer password.
24
Voice Verification strengthens IVR functionality. It purposes to;
a. Impress customer by authorizing him or her with his or her voice signature, b. Eliminate the need of a PIN for authorization,
25
5. SIMULATION MODEL FOR CURRENT CALL CENTER WORKFLOW
Because of the complexity of the system, simulation is used instead of other analytical models in this thesis.
A discrete-event simulation simulates the system as a discrete sequence of operations in a specific period. Operations mark a status change in the system. Between sequential operations the simulation may proceed from one operation to following one.
Banking IVR and call center inspected is simulated with Arena Simulation Software by
Rockwell Automation, Inc. as a discrete-event simulation.
The whole simulation model had to be complex due to variation of possible customer experience scenarios In IVR as in Figure 5.1.
26
27
In this thesis, IVR operations were investigated deeply. First scenario box above contains IVR operations. The second scenario box contains calls directed to agents. Because of this thesis focuses on improvements on IVR, average talking values for two main agent groups are calculated and distribution values for these two agent groups weren’t disintegrated. This obtained agent scenario box to be a simple flow.
5.1 ACQUIRING OF DISTRIBUTION TIMES
Distribution time values are calculated by analyzing a 100 sample set for each process. Sample values of a regular day are exported from database records as a text file and imported to Arena Input Analyzer software.
Distribution expression values are in second format and divided by 60 to be converted to minute format while importing to Arena.
Distribution time value results acquired from Input Analyzer using Chi Square Test are given in Table 5.1. All goodness of fit results have P-value greater than 0.05, so we can use the related distributions in the simulation.
28
Table 5.1: Distribution time value results
Process Name Distribution Expression P-value Square Error
Customer Recognition Beta 5.5 + 30 * BETA(1.6, 2.81) 0.0879 0.012848 Enter to Account Balance Receipt by Email Menu Normal NORM(25.3, 8.28) 0.39 0.008913 Enter to Account Balance Info Menu Beta 7.5 + 29 * BETA(2.73, 1.46) 0.068 0.015207 Enter to Bill Payment Menu Poisson POIS(14.1) 0.0771 0.012469 Enter to Credit Card Campaign Info Menu Beta 6.5 + 20 * BETA(1.5, 2.01) 0.106 0.010680 Enter to Credit Card Receipt by Email Menu Beta 7.5 + 46 * BETA(2.83, 4.17) 0.274 0.013524 Enter to Credit Card Receipt Info and Payment Menu Normal NORM(21.7, 7.58) 0.056 0.012955 Enter to Credit Card Limit Info Menu Beta 9.5 + 30 * BETA(1.19, 1.67) 0.0641 0.011967 Enter to Investment Info Menu Beta 7.5 + 35 * BETA(3.83, 3.14) 0.0998 0.014169 Enter to Money Transfer Menu Beta 6.5 + 23 * BETA(1.95, 1.98) 0.0836 0.012339
Pin Entry Beta 14.5 + 36 * BETA(1.5, 2.7) 0.345 0.007818
Credit Card Receipt Info and Payment Process Beta 12.5 + 44 * BETA(1.47, 2.37) 0.127 0.007221 Credit Card Limit Info Process Beta 12.5 + 44 * BETA(1.47, 2.37) 0.127 0.007221 Credit Card Receipt by Email Process Beta 24.5 + 45 * BETA(1.5, 3.49) 0.0668 0.007722 Credit Card Campaign Info Process Triangular TRIA(35.5, 82, 95.5) 0.0576 0.010412 Account Balance Info Process Beta 32.5 + 35 * BETA(1.36, 1.21) 0.0808 0.013001 Account Balance Receipt by Email Process Beta 22.5 + 57 * BETA(1.32, 1.33) 0.46 0.009035 Investment Info Process Beta 28.5 + 47 * BETA(1.3, 1.5) 0.0722 0.008483
Agent Talk Time Normal NORM(75, 18.9) 0.0947 0.007508
Wait Time Before Abandonment Normal NORM(166, 30.4) 0.0619 0.011321
5.2 GENERAL OVERVIEW OF IVR
There are three configuration boxes in the simulation of IVR flow as given in Figure 5.2.
Figure 5.2: Configuration boxes in the simulation
5.2.1 Configuration
IVR has a 400 IVR trunk capacity for IVR menus included in simulation, which means system supports to service 400 customers at the same time in IVR.
In order to determine the number of replications that will be used in the study, we run the simulation ten times to get agent utilizations and calculate the average and standard
29
deviations of utilizations of both types of agents which are given in Table 5.2. Then the minimum number of replications is calculated similarly as in Ahmed (1999) by the formula below: 2 / 2,m1 s t N x
where α is the significance level and taken as 0.05 so the critical value is 2.262, ε is the accuracy level and taken as 0.01, s is the standard deviation of agent utilization and x is
the average of agent utilizations which are calculated according to the replication utilizations given in Table 5.2.
Table 5.2: Calculation for required replication count
t0.025,9= 2.262
= 0.01
Replication Number Utilization for Agents with Basic Skill
Utilization for Agents with Basic+security skill Replication 1 0.5936 0.9691 Replication 2 0.5951 0.9692 Replication 3 0.5978 0.9694 Replication 4 0.5819 0.9694 Replication 5 0.5949 0.9719 Replication 6 0.5971 0.9715 Replication 7 0.5892 0.9705 Replication 8 0.5992 0.9714 Replication 9 0.6004 0.9684 Replication 10 0.5913 0.9690 Average ( ) 0.5940 0.9700 Standart Deviation (s) 0.0055 0.0012 Square Root of N 2.0912 0.2870 N 4.3731 0.0823
According to results in Table 5.2, it is seen that at least 4.3731 and 0.0823 replications are required respectively for Utilization for Agents with Basic Skill and Utilization for
Agents with Basic+security Skill, to reach the desired accuracy in the simulation. So we
30
Number of replications is set to 10. Maximum number of agent groups is 2. Details of configuration boxes in the simulation are given in Figure 5.3.
Figure 5.3: Details of configuration boxes in the simulation
Number of Warm-up Period is set to 1 day to acquire starting as an ongoing operation while first replication starts. Warm-up Period is entered in the simulation as given in Figure 5.4.
31
5.2.2 Contact: Customer
There is just one pattern for calls entitled Call Pattern. Trunk Group is selected as IVR Trunks.
Approximate wait time until abandonment is set.
Details of customers in the simulation are given in Figure 5.5.
Figure 5.5: Details for customers in the simulation
5.2.3 Pattern: Call Pattern
Incoming calls for one day are simulated.
32
Figure 5.6: Call pattern details
Customers’ daily arrival pattern is taken from database records of a bank, for a random whole day as given in Figure 5.7.
33
Expected scenario to reach an IVR functionality in simulation is given below and shown in Figure 5.8 and Table 5.3.
a. Customer connects to IVR.
b. Customer enters his or her customer number in recognition process
c. Customer listens to IVR menu list and dials necessary menu numbers for the IVR function needed.
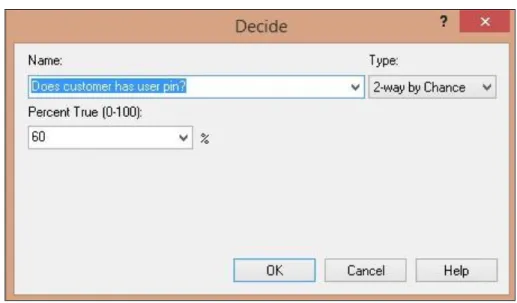
d. System checks if customer has a PIN for authorization, if so customer is requested to enter his PIN.
e. Customer reaches IVR process and satisfies his or her need and terminates the call.
In any unsuccessful process, customer is directed to customer representative agent.
Figure 5.8: Expected scenario to reach an IVR functionality
Customer Recognition Process Customer connects to IVR Customer’s finding IVR menu Customer Authorization with pin IVR Process Customer disconnects Distribution Unsuccessful Successful Distribution Successful Unsuccessful Distribution Successful Unsuccessful Distribution Complete Need for agent
Another process Transfer to agent Abandoned Abandoned Abandoned
34
Table 5.3: IVR menu actions and inclusion in simulation
Menu
Address IVR Menu Name Authorization Type
Inclusion in Simulation
1. Banking Transactions Not required Menu
1.1. Account Transactions Not required Menu
1.1.1. Account Balance Info Required IVR Functionality Included 1.1.2. Account Balance Receipt by Email Required IVR Functionality Included 1.2. Money Transfer Required Transfer to agent Included 1.3. Investment Info Required IVR Functionality Included
1.4. Bill Payment Required Transfer to agent Included
2. Credit Card Transactions Not required Menu 2.1. Credit Card Receipt Transactions Not required Menu
2.1.1. Credit Card Receipt Info and Payment Required IVR Functionality Included 2.1.2. Credit Card Receipt by Email Required IVR Functionality Included 2.3. Credit Card Limit Info Required IVR Functionality Included 2.4. Credit Card Campaign Info Required IVR Functionality Included 3. Password Transactions Not required Transfer to agent Not included* 4. Internet and Mobile Banking Support Not required Transfer to agent Not included* 5. Other banking services Not required Transfer to agent Not included*
(*) These IVR menus don’t require PIN and customers are directly transferred to agents. Because of these menus don’t effect IVR performance, it is decided not to include these menus in simulation.
5.3 CUSTOMER RECOGNITION FLOW
Steps of customer recognition in simulation are given below and shown in Figure 5.9. i. Customer calls IVR.
ii. Customer is transferred to Recognition Process.
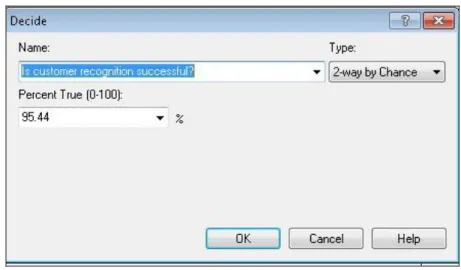
iii. In Customer Recognition Process, customer is requested to enter his or her identification info. Entered numerical info is checked in database. Recognition process is successful with 0.9544 probability which is entered to simulation as given in Figure 5.10.
iv. a. If recognition is successful, Customer Recognition Success Count is assigned to customer. Success ratio of Customer Recognition Process will calculated by this assignment. Then Customer’s Finding IVR Menu starts.
b. If recognition is unsuccessful, Calls Diverted to Agent is assigned to customer. Calls diverted to agent count will be calculated by this assignment. Then, call is transferred to agent.
35
Figure 5.9: Steps of customer recognition in simulation
Figure 5.10: Decision box for success of recognition process
5.4 PROCESS DISTRIBUTION VALUES FOR EACH IVR MENU
Customers’ process distribution ratios are daily menu entry ratios which are taken from database of a bank. Process distribution ratios are given in Table 5.4.
36
Table 5.4: Process distribution ratios
IVR MENU RATIO
Enter to Account Balance Info Menu 6.4%
Enter to Account Balance Receipt by Email Menu 4.9%
Enter to Bill Payment Menu 7.7%
Enter to Credit Card Campaign Info Menu 13.5%
Enter to Credit Card Limit Info Menu 15.9%
Enter to Credit Card Receipt by Email Menu 14.0%
Enter to Credit Card Receipt Info and Payment Menu 16.8%
Enter to Investment Info Menu 4.5%
Enter to Money Transfer Menu 16.4%
5.5 CUSTOMER’S FINDING IVR MENU
Customers may have trouble to find IVR menu they are looking for due to complexity of IVR menus. In this section, flow of customer’s finding IVR menus is analyzed in simulation. Steps of customer’s finding IVR menu in simulation are given below and shown in Figure 5.11.
i. After successful customer recognition process, customers are distributed by IVR menu usage ratio,
ii. Customers are assigned with attribute of the IVR functionality he or she is looking for.
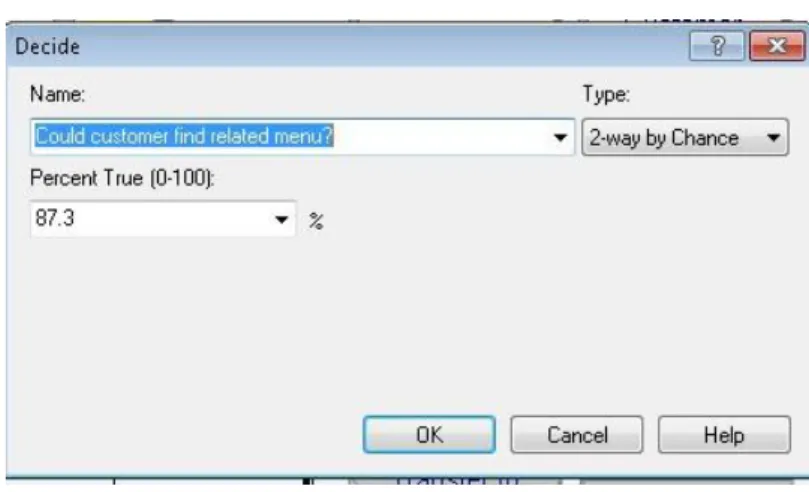
iii. Customers spend time for finding related IVR functionality. Each wait time of IVR functionalities are calculated by samples taken from database. Customer’s Finding IVR Menu process is successful with 0.873 probabilitywhich is entered to simulation as given in Figure 5.12.
iv. a. If Customer’s Finding IVR Menu process is successful,
i. Customer manually found IVR menu count is assigned to customer. Success ratio of Customer’s Finding IVR Menu will be calculated by this assignment.
ii. Another distribution after finding IVR menu is run. Then customers are separated again regarding to the IVR functionality they are willing to reach.
iii. Because of customer could find IVR functionality he or she is looking for, an assignment is made for related IVR functionality which is found by the customer. Success ratio of Customer’s Finding IVR Menu for each