A SHARP DECLINE IN EMPLOYMENT OF CONSTRUCTION SECTOR
Seyfettin Gürsel
*Gökçe Uysal
∗∗and Merve Yiğit Yontar
∗∗∗Executive Summary
According to the labor market statistics released by Turk-Stat, non-agricultural unemployment rate is 12.7
percent in the period of February 2012. Seasonally adjusted labor market data shows that non-agricultural
unemployment rate increased by 0.1 points to 11.3 percent. We observe a slowdown in the increase of
agricultural employment in the period of February 2012. Due to a slowdown in the increase in
non-agricultural labor force, the increase in non-non-agricultural unemployment is limited. Employment in construction
sector decreased by 110 thousand with a sharp decline, whereas the increase in manufacturing and the
decline in services are limited. These numbers reflect the slow down in the growth rate.
There is a slowdown in the increase in non-agricultural employment
According to the labor market statisics released by TurkStat on May 15th, in the period of February 2012
(January-February-March) agricultural labor force only increased by 436 thousand ( 2.2 percent),
non-agricultural employment increased by 682 thousand (4 percent) and the number of unemployed persons in
non-agricultural decreased by 246 thousand to 2 million 606 thousand on a year-on-year basis (Figure 1).
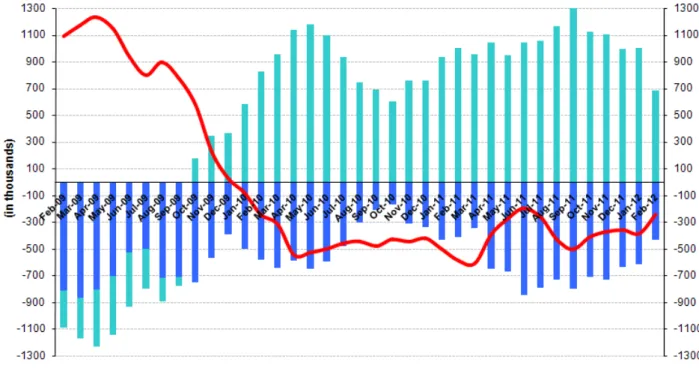
Annual increases in non-agricultural labor force had been over 600 thousand in the past periods. Moreover,
non-agricultural unemployment was decreasing rapidly in parallel to strong annual increases of almost 1
million in non-agricultural employment. We observe that increases in both non-agricultural labor force and
non-agricultural employment both slowed down as a result non-agricultural unemployment stagnated.
Figure 1 Year-on-year changes in non-agricultural labor force, employment and unemployment
Source: TurkStat, Betam
* Prof. Seyfettin Gürsel, Betam, Director, [email protected]
∗∗ Assoc. Prof. Gökçe Uysal, Betam, Vice Director, gokce.uysal @bahcesehir.edu.tr ∗∗∗ Merve Yiğit Yontar, Betam, Research Assistant, [email protected]
May 15, 2012
Labor Market Outlook:
May 2012
Seasonally adjusted non-agricultural unemployment increased to 11.3 percent
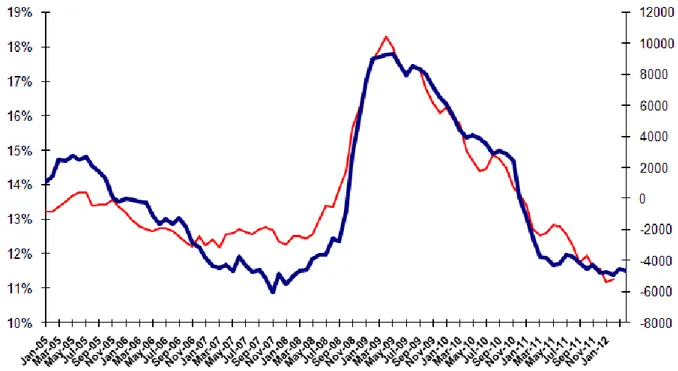
According to seasonally adjusted series, non-agricultural labor force decreased by 60 thousand to 20 million
657 thousand in the period of February compared to the period of January 2011 (Figure 2, Table 1).
Non-agricultural employment decreased by 73 thousand and fell back to 18 million 331 thousand. Consequently,
the number of unemployed persons in non-agricultural sectors increased by 13 thousand and seasonally
adjusted non-agricultural unemployment rate increased from 11.2 percent to 11.3 percent (Figure 2). The
monthly loss in non-agricultural employment is the largest decrease recorded since August 2010. However,
note that the slow down in non-agricultural labor force prevented a stronger increase in non-agricultural
unemployment.
Figure 2 Seasonally adjusted non-agricultural labor force, employment and unemployment
Source: TurkStat, Betam
According to Kariyer.net series non-agricultural unemployment rate will stagnate in the
period of March 2012
In the previous research briefs, we used seasonal and calendar adjusted application per vacancy series
released by Kariyer.net. However, we will be using total vacancy series in this brief as the total application
series pertaining to April 2012 contains a structural break due to technical difficulties.
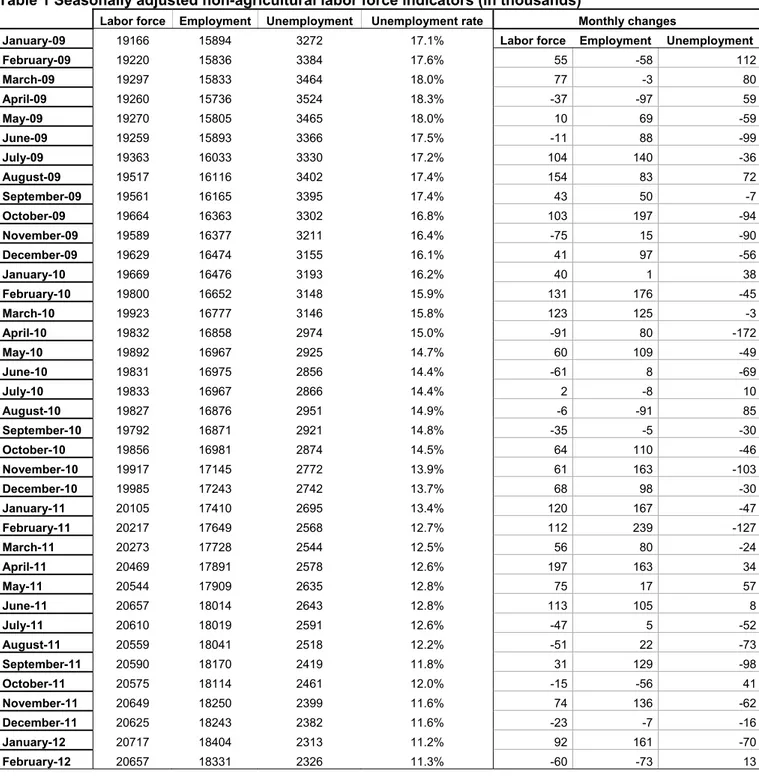
1According to data released by Kariyer.net the vacancy series provided by the firms point to a slowdown in
the decrease in non-agricultural unemployment starting from the period of January 2012. In light of this data,
we believe that non-agricultural unemployment rate will stagnate in the period of March 2012.
1
Seasonal and calendar adjustment procedure is applied to total vacancy series released by Kariyer.net. Total vacancy series is continuously increasing given that the customers base of Kariyer.net is widening overtime. Therefore we calculate the cycle of the series by subtracting the absolute number from the trend calculated by a Hodrick-Prescott fitler. Since the changes in the number of vacancies are negatively correlated with the changes in unemployment we use the inverse of total vacancy series by multiplying it with -1. Although this vacancy series are not as strong forecasters as the application per vacancy series, it gives an idea for the direction of non-agricultural unemployment.
Figure 3 Seasonally adjusted non-agricultural unemployment rate and total vacancy cycle
Data source: Kariyer.net, TurkStat, Betam
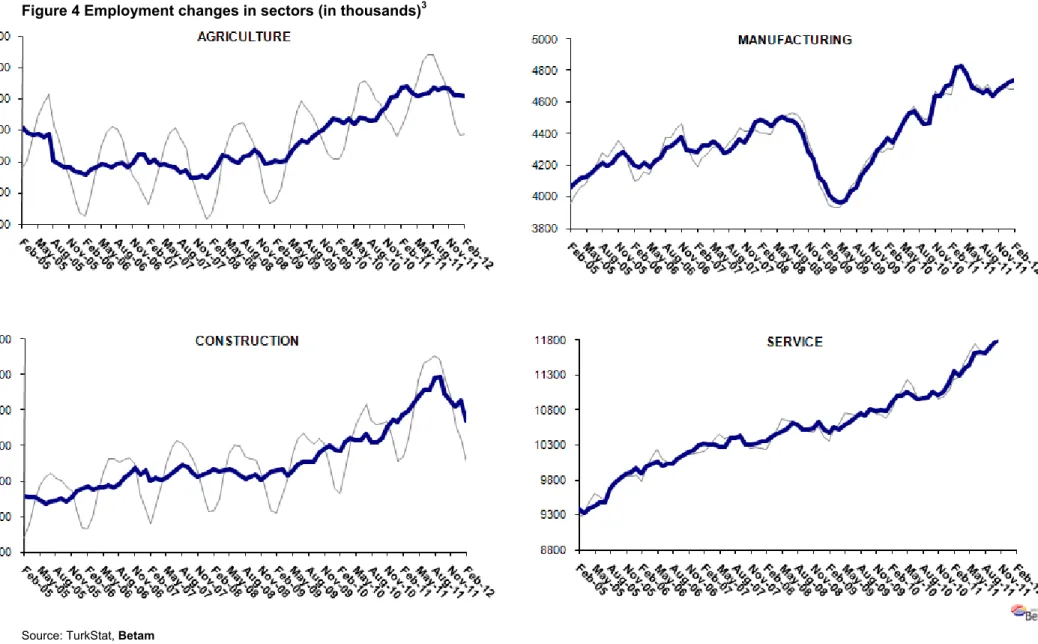
110 thousand construction employment loss in one month
2According to seasonally adjusted figures, sectoral employment data points to significant employment losses
in the construction sector. Employment in construction sector decreased by 110 thousand (6.7 percent) in
the period of February 2012 compared to the period of January 2012 (Table 2, Figure 4). From the period of
September 2011 to the period of February 2012 the cumulative decrease in construction sector is 246
thousand (14 percent).
The employment in manufacturing only increased by 16 thousand, the employment in services decreased by
5 thousand in the period of February 2012. These are reflections of slowing growth rates on the labor
market. A moderate decline in the agricultural sector continues.
2
Seasonal adjustment procedure is applied to each sector of employment series separately. Hence the sum of these series may differ from the seasonally adjusted series of total employment. The difference stems from the non-linearity of the seasonal adjustment process.
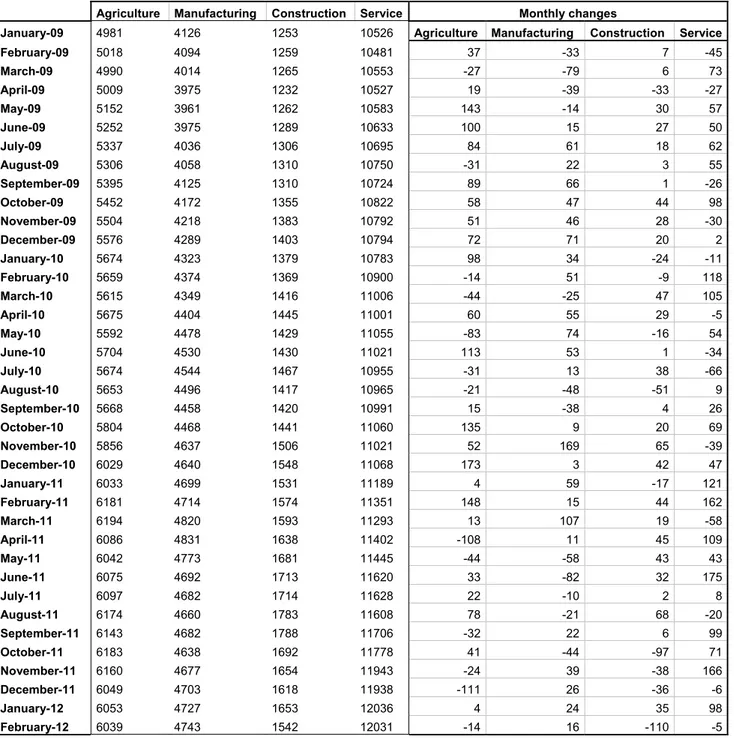
Table 1 Seasonally adjusted non-agricultural labor force indicators (in thousands)
Labor force Employment Unemployment Unemployment rate Monthly changes
January-09 19166 15894 3272 17.1% Labor force Employment Unemployment
February-09 19220 15836 3384 17.6% 55 -58 112 March-09 19297 15833 3464 18.0% 77 -3 80 April-09 19260 15736 3524 18.3% -37 -97 59 May-09 19270 15805 3465 18.0% 10 69 -59 June-09 19259 15893 3366 17.5% -11 88 -99 July-09 19363 16033 3330 17.2% 104 140 -36 August-09 19517 16116 3402 17.4% 154 83 72 September-09 19561 16165 3395 17.4% 43 50 -7 October-09 19664 16363 3302 16.8% 103 197 -94 November-09 19589 16377 3211 16.4% -75 15 -90 December-09 19629 16474 3155 16.1% 41 97 -56 January-10 19669 16476 3193 16.2% 40 1 38 February-10 19800 16652 3148 15.9% 131 176 -45 March-10 19923 16777 3146 15.8% 123 125 -3 April-10 19832 16858 2974 15.0% -91 80 -172 May-10 19892 16967 2925 14.7% 60 109 -49 June-10 19831 16975 2856 14.4% -61 8 -69 July-10 19833 16967 2866 14.4% 2 -8 10 August-10 19827 16876 2951 14.9% -6 -91 85 September-10 19792 16871 2921 14.8% -35 -5 -30 October-10 19856 16981 2874 14.5% 64 110 -46 November-10 19917 17145 2772 13.9% 61 163 -103 December-10 19985 17243 2742 13.7% 68 98 -30 January-11 20105 17410 2695 13.4% 120 167 -47 February-11 20217 17649 2568 12.7% 112 239 -127 March-11 20273 17728 2544 12.5% 56 80 -24 April-11 20469 17891 2578 12.6% 197 163 34 May-11 20544 17909 2635 12.8% 75 17 57 June-11 20657 18014 2643 12.8% 113 105 8 July-11 20610 18019 2591 12.6% -47 5 -52 August-11 20559 18041 2518 12.2% -51 22 -73 September-11 20590 18170 2419 11.8% 31 129 -98 October-11 20575 18114 2461 12.0% -15 -56 41 November-11 20649 18250 2399 11.6% 74 136 -62 December-11 20625 18243 2382 11.6% -23 -7 -16 January-12 20717 18404 2313 11.2% 92 161 -70 February-12 20657 18331 2326 11.3% -60 -73 13
Table 2 Seasonally adjusted sector of employment (in thousands)
Agriculture Manufacturing Construction Service Monthly changes
January-09 4981 4126 1253 10526 Agriculture Manufacturing Construction Service
February-09 5018 4094 1259 10481 37 -33 7 -45 March-09 4990 4014 1265 10553 -27 -79 6 73 April-09 5009 3975 1232 10527 19 -39 -33 -27 May-09 5152 3961 1262 10583 143 -14 30 57 June-09 5252 3975 1289 10633 100 15 27 50 July-09 5337 4036 1306 10695 84 61 18 62 August-09 5306 4058 1310 10750 -31 22 3 55 September-09 5395 4125 1310 10724 89 66 1 -26 October-09 5452 4172 1355 10822 58 47 44 98 November-09 5504 4218 1383 10792 51 46 28 -30 December-09 5576 4289 1403 10794 72 71 20 2 January-10 5674 4323 1379 10783 98 34 -24 -11 February-10 5659 4374 1369 10900 -14 51 -9 118 March-10 5615 4349 1416 11006 -44 -25 47 105 April-10 5675 4404 1445 11001 60 55 29 -5 May-10 5592 4478 1429 11055 -83 74 -16 54 June-10 5704 4530 1430 11021 113 53 1 -34 July-10 5674 4544 1467 10955 -31 13 38 -66 August-10 5653 4496 1417 10965 -21 -48 -51 9 September-10 5668 4458 1420 10991 15 -38 4 26 October-10 5804 4468 1441 11060 135 9 20 69 November-10 5856 4637 1506 11021 52 169 65 -39 December-10 6029 4640 1548 11068 173 3 42 47 January-11 6033 4699 1531 11189 4 59 -17 121 February-11 6181 4714 1574 11351 148 15 44 162 March-11 6194 4820 1593 11293 13 107 19 -58 April-11 6086 4831 1638 11402 -108 11 45 109 May-11 6042 4773 1681 11445 -44 -58 43 43 June-11 6075 4692 1713 11620 33 -82 32 175 July-11 6097 4682 1714 11628 22 -10 2 8 August-11 6174 4660 1783 11608 78 -21 68 -20 September-11 6143 4682 1788 11706 -32 22 6 99 October-11 6183 4638 1692 11778 41 -44 -97 71 November-11 6160 4677 1654 11943 -24 39 -38 166 December-11 6049 4703 1618 11938 -111 26 -36 -6 January-12 6053 4727 1653 12036 4 24 35 98 February-12 6039 4743 1542 12031 -14 16 -110 -5
Figure 4 Employment changes in sectors (in thousands)
3Source: TurkStat, Betam