STAGNATION IN UNEMPLOYMENT
Seyfettin Gürsel
*Gökçe Uysal
∗∗and Ayşenur Acar
∗∗∗Abstract
Seasonally adjusted labor market data shows that non-agricultural unemployment rate remained at 12.5 percent in
the period of August 2013. The increase in agricultural labor force counterbalances the increase in
non-agricultural employment in this period. Hence, non-non-agricultural unemployment rate stagnates. Seasonally adjusted
employment data also shows that manufacturing employment has been decreasing for the period of June 2013.
Service employment has been slightly increasing since the beginning of 2013. During this period, employment in
construction increased by 48 thousand in the period of August 2013 preventing unemployment to increase further.
Increases in both non-agricultural labor force and non-agricultural employment have been
slowing down
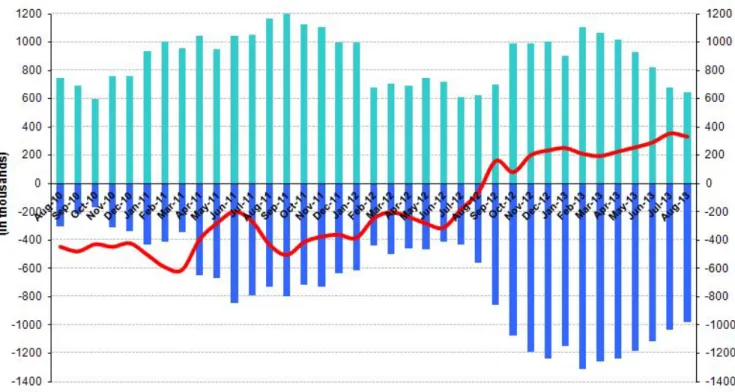
According to the data released by TurkSTAT, non-agricultural labor force increased by 978 thousand (4.6 percent)
and non-agricultural employment increased by 648 thousand (3.4 percent) in the period of August 2013 (Figure 1).
Clearly increases in both non-agricultural labor force and non-agricultural employment have been slowing down.
Consequently, the number of persons unemployed in non-agricultural sectors increased by 332 thousand (13.9
percent).
Figure 1 Year-on-year changes in non-agricultural labor force, employment and unemployment
Source: TurkSTAT, Betam
* Prof. Dr. Seyfettin Gürsel, Betam, Director, [email protected]
∗∗ Yrd. Doç. Dr. Gökçe Uysal, Betam, Vice Director, [email protected] ∗∗∗ Ayşenur Acar, Betam, Research Assistant, [email protected]
Labor Market Outlook:
November 2013
www.betam.bahcesehir.edu.tr
2
Stagnation in non-agricultural unemployment
According to seasonally adjusted data, non-agricultural labor force increased by 61 thousand in the period of
August 2013 compared to the period of July 2013 and reached 22 million 270 thousand (Figure 2, Table 1).
Non-agricultural employment increased by 38 thousand and reached 19 million 478 thousand. Hence, the number of
persons unemployed in non-agricultural sectors increased by 23 thousand and non-agricultural unemployment rate
remained at 12.5 percent in the period of August 2013.
Figure 2 Seasonally adjusted non-agricultural labor force, employment and unemployment
Source: TurkStat, Betam
According to Kariyer.net data, non-agricultural unemployment will stagnate in the period of
October 2013
Seasonally adjusted application per vacancy statistics calculated using Kariyer.net
1series indicate that
non-agricultural unemployment will continue to stagnate in the period of October 2013.
Figure 1 Seasonally adjusted non-agricultural unemployment rate and application per vacancy
Source: Kariyer.net, TurkStat, Betam
1 Betam has been calculating application per vacancy using series released by Kariyer.net for a while. Seasonal and calendar adjustment procedure is applied to application per vacancy series. A decrease in applications per vacancy may be caused by an increase in vacancies or by a decrease in the number of applications. An increase in vacancies signals economic growth while decreasing number of applications indicates a decrease in number of people looking for a job.
Employment losses in manufacturing and employment increase in construction
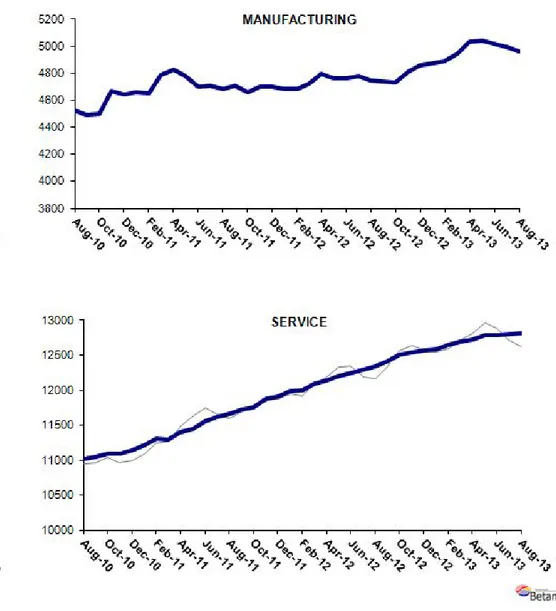
According to the seasonally adjusted labor market series, manufacturing employment decreased by 27 thousand
(Table 2, Figure 4).
2Manufacturing employment has been decreasing since June 2013. On the other hand,
increases in service employment have been losing pace since the beginning of 2013. Employment in service sector
slightly increased (17 thousand) in the period of August 2013. On the other hand, construction employment
increased by 48 thousand and agricultural employment increased by 23 thousand.
2 Employment in each sector is seasonally adjusted separately. Hence the sum of these series may differ from the seasonally adjusted series of total employment. The difference stems from the non-linearity of the seasonal adjustment process.
www.betam.bahcesehir.edu.tr
4
Figure 2 Employment by sectors (in thousands)
3Source: TurkStat, Betam
Table 1 Seasonally adjusted non-agricultural labor force indicators (in thousands)
Labor force Employment Unemployment Unemployment rate Monthly changes
July-10 19882 17011 2871 14.4% Labor force Employment Unemployment
August-10 19882 16944 2937 14.8% 0 -67 67 September-10 19836 16942 2894 14.6% -45 -2 -43 October-10 19876 17026 2850 14.3% 40 85 -45 November-10 19992 17263 2729 13.7% 116 237 -120 December-10 20073 17356 2717 13.5% 80 93 -12 January-11 20130 17447 2683 13.3% 57 91 -34 February-11 20177 17583 2594 12.9% 48 136 -88 March-11 20288 17710 2577 12.7% 110 127 -17 April-11 20459 17862 2598 12.7% 172 152 20 May-11 20554 17870 2684 13.1% 94 8 86 June-11 20586 17912 2675 13.0% 33 42 -9 July-11 20598 18009 2590 12.6% 12 97 -85 August-11 20584 18084 2500 12.1% -15 75 -90 September-11 20572 18188 2383 11.6% -12 105 -117 October-11 20520 18094 2426 11.8% -52 -94 42 November-11 20585 18229 2356 11.4% 65 135 -69 December-11 20616 18255 2362 11.5% 31 26 5 January-12 20746 18405 2341 11.3% 129 150 -21 February-12 20633 18267 2365 11.5% -113 -137 24 March-12 20788 18404 2384 11.5% 155 137 18 April-12 20950 18580 2370 11.3% 162 176 -14 May-12 21030 18659 2371 11.3% 80 80 1 June-12 21067 18720 2347 11.1% 37 61 -24 July-12 21144 18746 2397 11.3% 77 26 50 August-12 21257 18816 2441 11.5% 114 70 44 September-12 21442 18905 2537 11.8% 185 89 96 October-12 21539 19018 2521 11.7% 97 113 -16 November-12 21694 19133 2561 11.8% 155 114 40 December-12 21807 19218 2589 11.9% 114 85 28 January-13 21890 19316 2574 11.8% 83 98 -15 February-13 21952 19395 2556 11.6% 61 79 -18 March-13 22029 19448 2580 11.7% 77 53 24 April-13 22174 19568 2606 11.8% 145 120 25 May-13 22182 19541 2640 11.9% 8 -27 35 June-13 22205 19537 2668 12.0% 23 -4 27 July-13 22209 19440 2770 12.5% 5 -97 102 August-13 22270 19478 2793 12.5% 61 38 23
Source: TurkStat, Betam
6
Table 2 Seasonally adjusted employment by sector (in thousands)
Agriculture Manufacturing Construction Service Monthly changes
July-10 5692 4575 1459 10976 Agriculture Manufacturing Construction Service
August-10 5666 4525 1409 11010 -26 -50 -51 34 September-10 5659 4489 1411 11042 -6 -36 2 32 October-10 5792 4498 1442 11086 133 9 32 44 November-10 5845 4667 1511 11085 53 169 69 -1 December-10 6028 4642 1568 11146 183 -25 57 61 January-11 6032 4656 1581 11210 5 14 13 64 February-11 6177 4652 1627 11305 145 -4 45 95 March-11 6195 4790 1629 11291 18 138 2 -13 April-11 6078 4828 1632 11402 -117 38 3 111 May-11 6030 4777 1650 11443 -48 -51 18 41 June-11 6099 4697 1663 11552 69 -80 13 109 July-11 6121 4710 1681 11618 22 13 18 66 August-11 6194 4682 1743 11659 73 -28 63 40 September-11 6133 4707 1752 11730 -61 25 9 71 October-11 6169 4657 1680 11758 36 -50 -72 28 November-11 6146 4700 1657 11872 -23 43 -23 114 December-11 6045 4701 1644 11910 -101 1 -13 38 January-12 6050 4685 1728 11992 6 -16 84 82 February-12 6031 4684 1588 11996 -20 -1 -141 4 March-12 6023 4721 1584 12099 -8 37 -4 104 April-12 6059 4792 1652 12136 36 71 68 37 May-12 6121 4760 1705 12194 62 -32 53 58 June-12 6062 4761 1714 12245 -58 1 9 50 July-12 6062 4778 1684 12285 0 17 -31 40 August-12 6059 4745 1728 12343 -4 -33 44 59 September-12 6158 4735 1759 12411 99 -10 32 67 October-12 6193 4732 1785 12502 35 -3 25 91 November-12 6177 4814 1782 12537 -16 82 -3 35 December-12 6130 4856 1791 12571 -47 42 9 35 January-13 6107 4870 1854 12592 -23 14 64 20 February-13 6131 4886 1860 12650 24 16 5 58 March-13 6115 4948 1813 12687 -16 62 -46 37 April-13 6103 5030 1816 12722 -12 82 3 35 May-13 6041 5044 1719 12778 -62 14 -97 56 June-13 5986 5015 1733 12789 -55 -29 14 11 July-13 5986 4991 1649 12800 0 -24 -84 11 August-13 6009 4964 1697 12817 23 -27 48 17