Turkish Journal of Sport and Exercise
http://dergipark.gov.tr/tsedYear: 2018 - Volume: 20 - Issue: 3 - Pages: 127-131 DOI: 10.15314/tsed.452950
ISSN: 2147-5652
Relationship Between the Health Perception and Physical
Activity of Individuals
Kerime BADEMLİ
1, Neslihan LÖK
21Akdeniz University, Faculty of Nursing, Psychiatric Nursing Department, Antalya, Turkey. 2Selçuk University, Faculty of Nursing, Psychiatric Nursing Department,, Konya, Turkey.
Corresponding Author to K. Bademli, e-mail: [email protected]
Abstract
This research was conducted to determine the relationship between physical activity and health perception in the general adult population. This is a descriptive and correlational study intended to describe the correlation between health perception and the physical activity of adults. The sample was all voluntary 96 participation. The data were collected by the Perception of Health Scale and International Physical Activity Questionnaire. Number and percentile distributions were examined and the t-test was used. Pearson correlation Coefficient (Pearson r) was also used to test the correlation between Perception of Health Scale and International Physical Activity Questionnaire-IPAQ. The socio demographic data of the adult individual showed that their average age was 27.13±2.28, that 62.8’% were female, and that 31,2% were male, 57,3% had completed primary school, 42.7% high school and upper . Of them, 41.7% were married, and 58.3% single. 87.5% had children. 76% live in the city, 24% live in rural areas and 63.5% perceive the economic situation as good and 36.5% as moderate. When the scores of the individuals in the physical activity questionnaire were evaluated, 23.9% were found to be inactive and 76.1% were found to be the least active. In this study it was observed that the majority of participants were physically active. That the less educated, men, singles, lower economic status and lived in the urban area have low health perception scores. In this study there was a strong correlation between the physical activity level and the control center on the positive side, a weak relationship between the self-awareness and the positive side in the positive direction. Physical activity was related to better self-health perception.
Keywords: physical activity, health, perception, general adult population
INTRODUCTION
Health perception is based on assessing people's own health status in general and reflects the multidimensionality of health and allows the individual to assess his / her biological, mental and social situation (19). Perception of one’s own health reflects the capability to function in a definite social and organizational situation and is regarded as a prognostic indicator of prevalence of various chronic diseases, affecting their prognosis (17). Positive beliefs about the individual's own health are conveyed by "good health" and the state of negative beliefs is called "bad health perception". Perception of one’s own health affects his/her health behaviors and health responsibilities (8). Epidemiological data indicate that higher level of education, higher income, non-smoking status, recreational physical activity, being male, psychological well-being and high self-esteem were found to be associated with higher self-rating of health (6, 12)
It is a widely held perception that adults who choose to be regular physical activity also tend to adopt other positive health habits (11). The positive effects of regular physical activity on all-cause mortality, risk factors of cardiovascular diseases, obesity, osteoporosis, depression and diabetes mellitus have been extensively established for a number of different populations (2, 20). There is increasing evidence that physical activity may be effective in improving the general health of the population (4). Active aging includes healthy lifestyle behaviors and physical activity. The sedentary lifestyle of older adults may contribute to the decline in health that often accompanies aging. The maintenance of high physical function is one of the key factors for successful aging (13).
It has been argued that physical activity possessed better self-perceived health than members of the general population. In a study, carried out also by Lamb, a significant correlate of self-perceived fitness was self-perceived health
Turk J Sport Exe 2018; 20(3): 127-131
© 2018 Faculty of Sport Sciences, Selcuk University
128
, suggesting that people may experience fitness and health in the same manner (9).Physical function and general health perception closely associated with the amount of physical activity (15). It is necessary for activity professionals to encourage persons with visual impairments to participate in daily exercise programs to improve subjective health perception of the visually impaired (7). According to the findings obtained from studies, it is seen that there is a relationship between health perception and physical activity. The present study was proposed to examine whether the physical activity would be associated with Health perception in the general adult population.
Research Questions
1. Are socio-demographic characteristics
influencing the individual’s own health perceptions? 2. Is there a relationship between health
perception and physical activity?
MATERIALS & METHODS
This is a descriptive and correlational study intended to describe the correlation between health perception and the physical activity of adults. The population of the study consists of adult individuals who come to an institution for training. The sample was all voluntary 96 participation. The researchers created an information form to collect the participants' socio-demographic data. The researchers also used the Perception of Health Scale to evaluate the health perception of the adult individuals and the International Physical Activity Questionnaire to determine their physical activity levels.
Perception of Health Scale; It is developed by
Diamond and colleagues in 2007 (3). Turkish variability and reliability study was conducted by Kadıoğlu and Yıldız in 2012 (5). Perception of Health Scale is a likert type scale that included in 15 items and four different sub-factors. The positive attitudes are 1th, 5th, 9th, 10th, 11th and 14th items; the negative attitudes are 2nd, 3th, 4th, 6th, 7th, 8th, 12th, 13th and 15th items. Positive statements are scored as “strongly agree= 5”, “agree= 4”, “undecided= 3”, “disagree= 2”, “strongly disagree= 1”. However negative statements are scored as opposite. Scores of scale are 15 at least, 75 at most. There are 4 subgroups of scale. Items of control center subgroup are 2nd,3th,4th,12th, and 13, of self-awareness subgroup are 5th,10th, and 14th, of certainty subgroup are 6th,7th,8th,15th and of
importance of health subgroup are 1th,9th and 11th . According to subgroups Cronbach Alpha values: Control center 0.90; Self-awareness 0.91; Certainty 0.91; Importance of health 0.82.
International Physical Activity Questionnaire-IPAQ: The IPAQ was developed by the
International Group for Consensus of Physical Activity Measurements and the Turkish version was validated by Öztürk (Test–retest reliability = 0.69). The IPAQ-short version, which includes seven items, is used to measure the frequency and duration of vigorous intensity, moderate-intensity, and walking-level physical activity for young and middle-aged adults (15–69 years). To calculate the weekly physical activity (MET-minute/week), the number of minutes per week dedicated to each activity is multiplied by the specific MET score for that activity. The IPAQ sitting question is an additional indicator variable of time spent in sedentary activity and is not included as part of any summary score of physical activity. Data from the questionnaire were gathered for each item (walking, moderate intensity, vigorous intensity) to estimate the total amount of time spent in physical activity per week. Three levels of physical activity were proposed at the end: low (no activity is reported or some activity is reported but not enough to meet categories moderate and high), moderate and high (10).
Data Collection
The data were collected by the researcher with face-to-face interviews.
Ethical and Legal Dimension of the Study
The study was carried out after obtaining institutional and personal permission. Individuals gave their verbal consents after they were informed about the content and the methodology of the research. Individuals were informed about they can withdraw without asking when they want. In addition, all individuals were assured of anonymity without recording the names and told that individual information will be protected by researcher. Before the forms to be used in the research were given, necessary explanations were made verbally and create a silent environment.
Data Analysis
Study data were evaluated using SPSS 21.0 software. All missing data were treated using the method of mean replacement (for variables with normal distribution, or median replacement for
Turk J Sport Exe 2018; 20(3): 127-131
© 2018 Faculty of Sport Sciences, Selcuk University
129
variables with skewed distribution). Number and percentile distributions were examined and the t-test were used. Pearson correlation Coefficient (Pearson r) was also used to test the correlation between Perception of Health Scale and International Physical Activity Questionnaire-IPAQ. The results were assessed at 95% confidence interval and p <0.05 significance level.
RESULTS
The sociodemographic data of the adult individual showed that their average age was 27.13±2.28, that 62.8% were female, and that 31.2% were male, 57.3% had completed primary school,
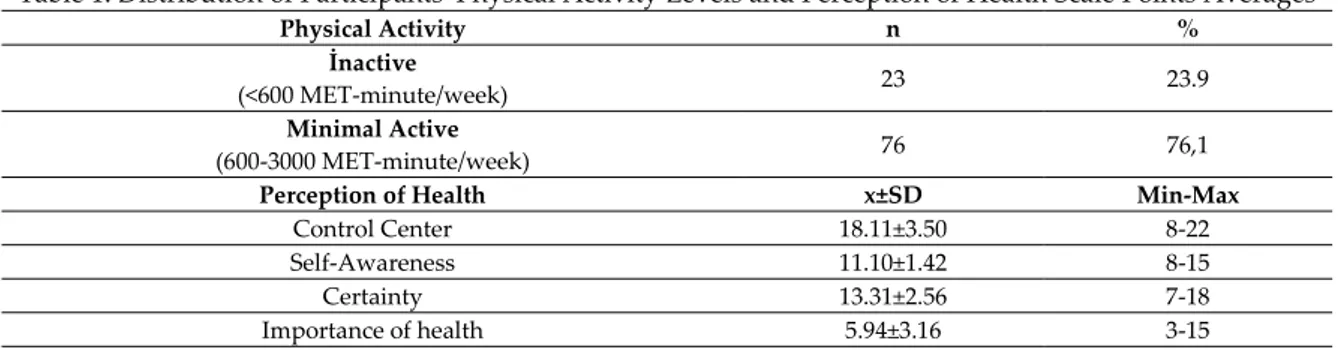
42.7% high school and upper. Of them, 41.7% were married, and 58.3% single. 87.5% had children. 76% live in the city, 24% live in rural areas and 63,5% perceive the economic situation as good and 36.5% as moderate. When the scores of the individuals in the physical activity questionnaire were evaluated, 23.9% were found to be inactive and 76.1% were found to be the least active. When the scores they received from the subscales of health perception scale were examined, the mean of control over subscale was 18.11 ± 3.50, the mean self-awareness subscale was 11.10 ± 1.42, the certainty subscale average was 13.31 ± 2.56, and mean score of subscale was 5.94 ± 3.16 (Table 1).
Table 1. Distribution of Participants' Physical Activity Levels and Perception of Health Scale Points Averages
Physical Activity n %
İnactive
(<600 MET-minute/week) 23 23.9
Minimal Active
(600-3000 MET-minute/week) 76 76,1
Perception of Health x±SD Min-Max
Control Center 18.11±3.50 8-22
Self-Awareness 11.10±1.42 8-15
Certainty 13.31±2.56 7-18
Importance of health 5.94±3.16 3-15
P<0.05
When the sociodemographic characteristics of the individuals were compared with the mean scores of the health perception scale subscale, in the control center subscale; female (p<0.05), married women, high school and upper graduates, longest live in the city (p <0.05) and perceive the economic situation as good (p <0.05) average scores were found to be higher. In the self-awareness sub scale; female (p <0.05), married people, high school and upper graduates, those living in the city for the longest time (p <0.05) and those who perceived the
economic situation good, average scores were found higher. In the certainty sub scale; female (p <0.05), high school and upper graduates, those living in the city for the longest time, and those who perceived the economic situation good average scores were found higher(p <0.05). Similar to the results of the other subscales in the subscale importance of health it was found that the female (p <0,05), married, high school and upper graduates, living in the city for the longest time, and those who perceived the economic situation good average scores were found higher (p <0.05). (Table 2)
Table 2. Comparison of Socio-demographic Characteristics and Health Perception Levels of Individuals
Control Center Self-Awareness Certainty Importance of health
Gender Female 18.86±3.08 11.33±1.24 13.59±1.99 5,57±2.76 Male 16.46±3.85 10.60±1.67 12.70±3.47 6.76±3.83 t:3.255 p:0.02* t:2.394 p:0.01* t:1.588 p:0.11 t:1.729 p:0.03* Marital status Married 18.57±3.24 11.23±1.25 14.10±2.56 5.76±2.92 Single 17.47±3.79 10.92±1.63 12.75±2.44 6.20±3.49 t:1.520 p:0.13 t:1.041 p:0.32 t:2.616 p:0.01* t:0.657 p:0.52 Education level Primary school 17.95±3.61 11.02±1.35 13.25±2.56 5.83±2.99
High school and upper
18.23±3.45 11.16±1.48 13.39±2.59 6.09±3.41
Turk J Sport Exe 2018; 20(3): 127-131
© 2018 Faculty of Sport Sciences, Selcuk University
130
p:0.69 p:0.63 p:0.800 p:0.06 Living City 18.17±3.46 11.30±1.44 13.39±2.69 6.00±3.05 Rural 17.91±3.70 10.47±1.20 13.04±2.16 5.78±3.55 t:0.314 p:0.01* t:0.143 p:0.009* t:0.574 p:0.52 t:0.286 p:0.02* Economic status Good 18.34±3.63 11.14±1.37 13.63±2.21 6.01±3.09 Middle 17.71±3.28 11.02±1.52 12.74±3.04 5.82±3.32 t:0.845 p:0.04* t:0.392 p:0.06 t:1.661 p:0.01* t:0.278 p:0.001* *p<0.05
The relationship between physical activity levels of individuals and health perception subscales was examined. There was a strong correlation (r: 0.87, p <0.05) between the physical activity level and
the control center on the positive side, a weak relationship between the self-awareness and the positive side (r: 0.40, p <0.05) (r: 0.54, p <0.05) in the positive direction (Table 3).
Table 3. The relationship between individuals' physical activity and health perception sub scale
Fiziksel Aktivite Control Center Self-Awareness Certainty Importance of health Physical Activity 1.00 Control Center r:0.87 p:0.04* 1.00 Self-Awareness r:0.40 p:0.01* r:0.21 p:0.83 1.00 Certainty r:0.169 p:0.10 r:0.321 p:0.001* r:0.152 p:0.13 1.00 Importance of health r:0.54 p:0.01* r:0.604 p:0.001* r:0.032 p:0.07 r:0.477 p:0.001* 1.00 *r:Pearson correlation analysis. **p<0.05
DISCUSSION
In the present study, gender, marital status, education level, longest living area and perceive the economic situation were related to general health perception of adult individual. The majority of individuals (76.1%) participating in the study were engaged in physical activity. The present study indicated that education level was an important determinant of general health perception and physical activity in our studied population. Therefore higher education might be more often performing intellectual health perception and physical activity. Among individual being women perceived health status was considerably more likely to be control center, self-awareness, importance of health and certainty. Our findings similar to a study conducted by Schuit et al stated that the general health perception closely associated with the working status, and education level (14).In another study age, gender, resources perception, employment, marital status weight status and morbidity were not related to physical activity, and
these factors have no significant impact on the adherence to physical activity. In the same study it was found that self-perceived health with respect to meeting physical activity requirements, people with poor or fair health perception were less likely to be physically active, compared to good-health perceived subjects (1).The objective benefits on physical activity, such as a decreased risk of morbidity, may be directly reflected in the perception of health.
It has been discussed that physical activity possessed better self-perceived health than members of the general population. Some studies have also evidenced that higher physical activity was related to better self-health perception (1, 7, 15, 16). In this study there was a strong correlation between the physical activity level and the control center on the positive side, a weak relationship between the self-awareness and the positive side in the positive direction. Similar to our study findings previous studies also demonstrated that the higher level of physical activity reported better mental health perception and showed the potential trend that the people who increasingly engaged in physical activity reported better physical health perception (21). Previous studies also demonstrated that the
Turk J Sport Exe 2018; 20(3): 127-131
© 2018 Faculty of Sport Sciences, Selcuk University
131
higher level of physical activity had benefits for social and emotional health perception in adults (18). In our study and other studies, it was found that physical activity was related to health perception. Health professionals may suggest regular physical activity to help individuals develop positive physical and mental health perception.
CONCLUSION
In this study it was observed that the majority of participants were physically active. That the less educated, men, singles, lower economic status and lived in the urban area have low health perception scores. In this study there was a strong correlation
between the physical activity level and the control center on the positive side, a weak relationship between the self-awareness and the positive side in the positive direction. Physical activity was related to better self-health perception. These data will hopefully encourage researchers to improve the methods of this field, physical activity measures and developing more responsive self-health perception instruments. Further evidence regarding self-health perception benefits of regular physical activity among the general population would support the role and importance of physical activity beyond chronic disease prevention and treatment contexts.
REFERENCES
1. Alkerwi AA, Schuh B, Sauvageot N, Zannad F, Olivier A, Guillaume M, Larsson, CA. Adherence to physical activity recommendations and its associated factors: an interregional population-based study. Journal of Public Health Research, 2015; 4(1).
2. Cramer SR, Neiman DC, Lee JW. The effect of moderate exercise training on psychological well-being and mood state in women. Journal of Psychosomatic Research, 1991; 35: 437–49.
3. Diamond JJ, Becker JA, Arenson CA, Chambers CV, Rosenthal MP. Development of a scale to measure adults‟ perceptions of health: preliminary findings. Journal of Community Psychology, 2007;355:557-61.
4. Fox KR. The influence of physical activity on mental well-being. Public Health Nutrition, 1999; 2(3a):411-418. 5. Kadıoğlu H, Yıldız A. Sağlık Algısı Ölçeğinin Türkçe
çevriminin geçerlilik ve güvenilirliği. Türkiye Klinikleri, 2012;32:47-53.
6. Kaleta D, Polanska K, Dziankowska-Zaborszczyk E, Hanke,W, Drygas W. Factors influencing self-perception of health status. Central European Journal of Public Health, 2009;17(3): 122-128
7. Kim BD, Kim CJ. Association between participation level of exercise and self-rated health in elderly people with visual impairment. Journal of Adapted Physical Activity & Exercise, 2013;33–42.
8. Klein Velderman M, Crone MR, Wiefferink CH, Reijneveld SA. “Identification and management of psychosocial problems among toddlers by preventive child health care professionals”. European Journal of Public Health, 2010;20(3): 332- 338.
9. Lamb, KL. Correlates of self-perceived fitness. Perceptual and Motor Skills, 1992;74:907–91
10. Öztürk M. A Research on Reliability and Validity of International Physical Activity Questionnaire and Determination of Physical Activity Level in University
Students [in Turkish]. PhD Thesis. 2005, Hacettepe University, The Institute of Health Sciences
11. Pate RR, Heath GW, Dowda M, Trost SG. Associations between physical activity and other health behaviors in a representative sample of US adolescents. American Journal of Public Health, 1996;6(11):1577-1581
12. Piko B. Health-related predictors of self-perceived health in a student population: the importance of physical activity. Journal of Community Health, 2000; 25(2):125-37. 13. Reid KJ, Baron KG, Lu B, Naylor E, Wolfe L, Zee PC.
Aerobic exercise improves self-reported sleep and quality of life in older adults with insomnia. Sleep Medicine, 2010; 11(9):934-940.
14. Schuit AJ, vanLoon AJM, Tijhuis M, Ocké, MC. Clustering of lifestyle risk factors in a general adult population. Preventive Medicine, 2002;35(3):219-224. 15. Shibata A, Oka K, Nakamura Y, Muraoka I. Recommended
level of physical activity and health-related quality of life among Japanese adults. Health and Quality of Life Outcomes, 2007; 5(1), 64.
16. Sodergren M, Sundquist J, Johansson SE, Sundquist K. Physical activity, exercise and self-rated health: a population-based study from Sweden. BMC Public Health, 2008;8:352.
17. Svärdsudd K, Tibblin G. Is quality of life affecting survival? The study of men born in 1913. Scandinavian Journal of Primary Health Care, 1990; 1: 55-60.
18. T. Balboa-Castillo, L.M.
León-Muñoz, A. Graciani, F. Rodríguez-Artalejo, P. Guallar-Castillón Longitudinal association of physical activity and sedentary behavior during leisure time with health-related quality of life in community-dwelling older adults. Health and Quality of Life Outcome, 2011; 9: 47-49
19. Tuğut N, Bekar M. Üniversite öğrencilerinin sağlığı algılama durumları ile sağlıklı yaşam biçimi davranışları arasındaki ilişki. Atatürk Üniversitesi Hemşirelik Yüksekokulu Dergisi, 2008; 11( 3): 17-26
20. Vina J, Sanchis‐Goma, F, Martinez‐Bello V&Gomez‐ Cabrera MC. Exercise acts as a drug; the pharmacological benefits of exercise. British Journal of Pharmacology, 2012; 167(1): 1-12.
21. Yen HY, Lin LJ. Quality of life in older adults: Benefits from the productive engagement in physical activity. Journal of Exercise Science & Fitness, 2018;16(2): 49-54.