YAŞAR UNIVERSITY
GRADUATE SCHOOL OF NATURAL AND APPLIED SCIENCES MASTER THESIS
A SEMI-AUTOMATED TEXT CLASSIFICATION AND
CODE ORGANIZATION SYSTEM FOR ACADEMIC
PAPERS
Alican Öztürk
Thesis Advisor: Asst. Prof. Dr. Korhan Karabulut Co-Advisor: Asst. Prof. Dr. Raif Serkan Albayrak
Department of Computer Engineering Presentation Date: 4.12.2015
ii
Bornova-İZMİR 2015
I certify that I have read this thesis and that in my opinion it is fully adequate, in scope and in quality, as a dissertation for the degree of master of science.
Asst. Prof. Dr. Korhan KARABULUT (Supervisor)
I certify that I have read this thesis and that in my opinion it is fully adequate, in scope and in quality, as a dissertation for the degree of master of science.
Asst. Prof. Dr. Raif Serkan ALBAYRAK (Co-Supervisor)
I certify that I have read this thesis and that in my opinion it is fully adequate, in scope and in quality, as a dissertation for the degree of master of science.
Asst. Prof. Dr. Mete EMİNAĞAOĞLU
I certify that I have read this thesis and that in my opinion it is fully adequate, in scope and in quality, as a dissertation for the degree of master of science.
Assoc. Prof. Dr. Aybars UĞUR
--- Prof. Dr. Cüneyt GÜZELİŞ Director of the Graduate School
iii ABSTRACT
A SEMI-AUTOMATED TEXT CLASSIFICATION AND CODE ORGANIZATION SYSTEM FOR ACADEMIC PAPERS
Alican Öztürk
MSc in Computer Engineering
Supervisor: Asst. Prof. Dr. Korhan Karabulut Co-Supervisor: Asst. Prof. Dr. Serkan Albayrak
December 2015, 54 pages
In this thesis, the aim is to use the locally entered “codes” (keywords in the document) to determine what the users’ associated topic with that document corresponds to via WordNet’s connections, synsets and hypernyms.
WordNet has a neatly arranged structure that not only includes meaning for each sense of the word but also all the other words associated with it, in forms of hyponyms, hypernyms, synonyms, holonyms and meronyms. All of these words are connected in a network structure with appropriate links in between. By using the distance between the words to calculate the similarities between each pair of words inside a code cluster and enriching them with the hypernyms of high value nodes, it is possible to obtain a list of possible words that can be associated as topic keywords for the document itself. Since the codes entered into the system differ by the users’ preferences and point of view on the document, it is highly possible for two instances to have completely different topics derived from the same document. The purpose of this is to personalize the topic according to the users’ interest in the document instead of the presenting a generic topic about it.
The project uses the Java library JWS to find the similarity between words and RitaWordNet from RitaCore to extract meanings and hypernyms of the words to select proper senses.
Keywords: WordNet, RitaCore, JWS, classification, hypernyms, similarity, WuAndPalmer, Resnik, Lin
iv ÖZET
AKADEMİK MAKALELER İÇİN YARI OTOMATİK DOKÜMAN SINIFLANDIRMASI VE KOD ORGANİZASYONU SİSTEMİ
Alican Öztürk
Yüksek Lisans Tezi, Bilgisayar Mühendisliği Bölümü Tez Danışmanı: Yrd. Doç. Dr. Korhan KARABULUT İkinci Danışman: Yrd. Doç. Dr. Raif Serkan ALBAYRAK
Aralık 2015, 54 sayfa
Bu tezde, yerel olarak girilmiş ‘kodlar’ı (belgedeki anahtar kelimeler) kullanarak, belgeye, kullanıcıya ait bir başlığın atanması için WordNet’in bağlantılarının (synsetlerini ve hypernymlerini) kullanılması amaçlanmıştır.
WordNet veritabanı; kelimelerin anlamlarını içermesinin yanı sıra, bu kelime ile alakalı olan alt kelimeleri, kapsayıcı kelimeleri, eş anlamlı sözleri, eşsesli sözleri ve meronimleri içeren zekice bir araya getirilmiş bir sözlüktür. Bütün bu kelimeler birbirine bir ağ yapısı aracılığı ile, aralarında yukarıda belirtilmiş ilişkiler ile bağlıdır. Bir ‘kod’ kümesinin içindeki kelimelerin, ikililer halinde WordNet üzerinde aralarındaki mesafeyi ölçerek ve buradan yüksek değer olarak sınıflandırılanların da kapsayıcı kelimelerini zenginleştirme amaçlı kullanarak, sonuçta bütün dokümanın konusunu kapsayabilecek potansiyel başlık olabilen anahtar kelimeler elde edilebilmektedir. Sisteme girilen kodlar kişinin tercihleri ve belgeye bakış açısına göre değişmektedir, bu nedenle aynı belgeden elde edilen iki sonucun birbirinden tamamen farklı olması mümkündür. Bunun amacı, genel bir başlık sunmak yerine, başlığı kullanıcının ilgilendiği konuya göre kişiselleştirmektir.
Bu projede kelimeler arası benzerliği bulmak için JWS ve kelimelerin anlamlarının seçimi, hypernymlerin elde edilmesi için RitaCore’dan Rita WordNet Java kütüphaneleri kullanılmıştır.
Anahtar sözcükler: WordNet, RitaCore, JWS, sınıflandırma, hypernyms, benzerlik, WuAndPalmer, Resnik, Lin
v
ACKNOWLEDGEMENTS
I would like to thank to my supervisor Dr. Korhan Karabulut and my co-supervisor Dr. Raif Serkan Albayrak for their support and help on my thesis.
I would also like to thank my family and friends who helped me both physically and psychologically to this day and gave me the drive to keep going.
In addition, I would like to thank the members of Software Engineering and Computer Engineering Departments of Yaşar University, for their guidance and interest in my seminar presentation which provided me the opportunity and the motivation of developing my theoretical knowledge and my presentation skills.
Alican Öztürk İzmir, 2015
vi
TEXT OF OATH
I declare and honestly confirm that my study, titled “A SEMI-AUTOMATED TEXT CLASSIFICATION AND CODE ORGANIZATION SYSTEM FOR ACADEMIC PAPERS” and presented as a Master’s Thesis, has been written without applying to any assistance inconsistent with scientific ethics and traditions, that all sources from which I have benefited are listed in the bibliography, and that I have benefited from these sources by means of making references.
vii TABLE OF CONTENTS Page ABSTRACT iii ÖZET iv ACKNOWLEDGEMENTS v TEXT OF OATH vi
TABLE OF CONTENTS vii
INDEX OF FIGURES ix
INDEX OF TABLES x
INDEX OF SYMBOLS AND ABBREVIATIONS xi
1 INTRODUCTION 1
2 WORDNET 6
2.1 Structure 6
2.1.1 Part of Speech and Senses 10
2.2 Relations 10
3 SIMILARITY MEASURES 12
3.1 Resnik 12
viii
3.3 Path Length 13
3.4 Wu & Palmer 14
4 SEMANTIC DOCUMENT CLASSIFICATION 15
4.1 Text Classification Algorithms 15
4.2 Document Classification with a Lexical Database 16
4.3 Uses of WordNet on Text Classification 17
5 LATENT SEMANTIC ANALYSIS 18
5.1 Singular Value Decomposition 19
6 METHODOLOGY 21
7 CONCLUSION AND FUTURE WORK 37
REFERENCES 39
CURRICULUM VITAE 43
ix
INDEX OF FIGURES
Figure 1. Visual representation of synset of the word "emotion" (Collins, C., 2006) 7 Figure 2. An extended version of the previous figure with synset of the connected
words (Collins, C., 2006) 8
Figure 3. A further extended set of synsets originating from word "emotion" (Collins,
C., 2006) 9
Figure 4. Fragment of WordNet taxonomy, solid lines are hypernyms; dashed lines indicate that there are more nodes between the presented ones (Resnik, P., 1995) 11 Figure 5. Another fragment of WordNet taxonomy where senses are seen clearly
(Resnik, P., 1995) 11
Figure 6. Fragment of WordNet hypernym hierarchy. (Resnik, P., 1995) 14 Figure 7. Count Matrix (zeros were left out for easier viewing) (Puffinware LLC 2007
- 2010) 19
Figure 8. Wu & Palmer with high threshold 30
Figure 9. Lin similarity 31
Figure 10. A second graph using Resnik similarity 33
Figure 11. Another result graph of Resnik similarity 34
Figure 12. Graph of a Test Document 35
x
INDEX OF TABLES
Table 1. Hypernym tree for sense 1 of word "pencil" 3 Table 2. Hypernym tree for sense 1 of word "fountain pen" 3 Table 3. Hypernym tree for sense 1 of word "crayon" 3
Table 4. A Sample TFIDF matrix 23
Table 5. Pearson Matrix of Training Data 25
Table 6. Pearson Correlation of Training Documents 26
Table 7. Similarity Chart for Test Document 1 27
Table 8. Similarity Chart for Test Document 2 27
xi
INDEX OF SYMBOLS AND ABBREVIATIONS Abbreviations
RWN Rita WordNet
LCS Least Common Subsumer
POS Part Of Speech
LSA Latent Semantic Analysis SVD Singular Value Decomposition NLP Natural Language Processing
1 1 INTRODUCTION
The aim of this thesis is to minimize the time required to retrieve previously reviewed information within a vast number of documents many people possess. While viewing a document, most people tend to frequently put notes on the interesting places of the text to mark them, to remind themselves their points of interests on that document. But, in the case where people have high number of documents in their possession, finding a specific document’s specific point about a specific topic is like searching for a needle in a haystack. Even if the documents are kept organized in folders with corresponding topics, the action of searching all the documents on the given topic for the specific marked areas one by one by traversing all the pages is usually unnecessarily time consuming.
The automatic document classification tools can extract keywords from a given document and determine a possible topic for it. The problem is that the same document does not always mean the same subject to different people. For example, while examining a paper about “Modern Usage of Image Processing in Brain Surgeries”, a computer scientist is more likely to think that the document is about usage of image processing, while a medical doctor is more likely to see the document as an improvement in brain surgery. Related topic keywords differ as users’ interest in the document differs.
To be able to personalize the results, the approach proposed in this thesis analyses the users’ locally tagged keywords (codes) inside the document in order to determine what the user is really interested in. These codes are organized and stored in graphs, linked in the manner of user’s approach to the document and coding choices which is further explained with program outputs in following chapters. While evaluating the words, there are couple criteria we fixate on. First of all, the word itself does not hold enough meaning; therefore, we need the sense of the entered keyword. The easiest and the most efficient way is to ask the users to select the meaning for the entered code by extracting the definition list from WordNet is chosen. Another criterion is frequency. The more a word is used in a document, the more it is likely that this word or something close to this word is related to the topic which the user is interested in. And finally, it is also important to know that which other words these codes are entered together with. Using this information, we can look how similar the given codes in pairs are in the
2
same cluster. There are various possible measures proposed in the literature to calculate this similarity.
In this thesis, the main tools used to get senses of the words, retrieve related terms and calculate similarities between the word senses are WordNet and its appropriate libraries for Java environment. WordNet is a lexical database that includes word senses and connections of words with each other in different manners. There are several methods for calculating the similarity measures among topics derived from WordNet. Some of the methods can be listed as shown in the list below.
Path Length Jiang And Conrath Leacock And Chodorow Lin
Resnik
Wu And Palmer
Using one of these methods, the similarity value between the given senses of words could be measured and evaluated and used within the rest of the system.
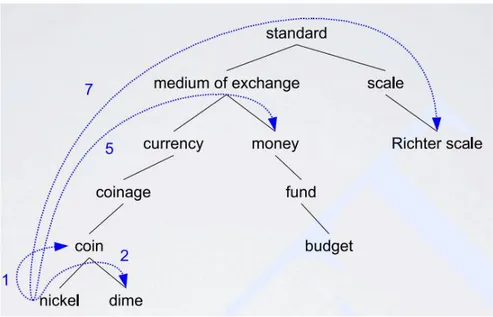
Linking and measuring all these given words as nodes gives us a structured graph where nodes are terms entered by the user, edges connect the terms that occur together and the weight of the edges are the frequencies of these co-occurrences. In this graph, edges with high values can be evaluated and new nodes that are derived from the WordNet hypernyms using these selections can be added to the graph in order to enhance it to better represent the reader’s view on the document.
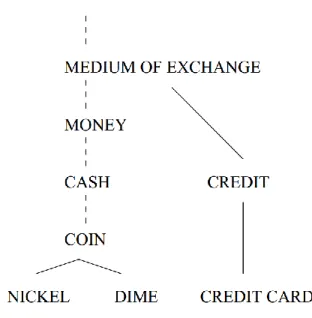
Hypernyms that are common for more than one term can be added to the graph using this method, even if the user does not enter the common term. For example, if we look at the following hypernym trees of the words “jackal”, “dog” and “cat” given below in table 1, 2 and 3, we can see that jackal and dog has the common parent “canine” in their hypernym trees. If we take all three words into account, the connecting node, or, the common parent, or, the least common subsumer (LCS) is “carnivore”. In the event where these linked words were selected as high value nodes to improve the graph, the nodes would be canine and carnivore.
3
Table 1. Hypernym tree for sense 1 of word "pencil"
pencil -- (a thin cylindrical pointed writing implement; a rod of marking substance encased in wood) -> writing implement -- (an implement that is used to write)
-> implement -- (instrumentation (a piece of equipment or tool) used to effect an end) -> instrumentality, instrumentation -- (an artifact (or system of artifacts) that is instrumental in accomplishing some end)
-> artifact, artefact -- (a man-made object taken as a whole)
-> whole, unit -- (an assemblage of parts that is regarded as a single entity; "how big is that part compared to the whole?"; "the team is a unit")
-> object, physical object -- (a tangible and visible entity; an entity that can cast a shadow; "it was full of rackets, balls and other objects")
-> physical entity -- (an entity that has physical existence)
-> entity -- (that which is perceived or known or inferred to have its own distinct existence (living or nonliving))
Table 2. Hypernym tree for sense 1 of word "fountain pen"
fountain pen -- (a pen that is supplied with ink from a reservoir in its barrel) -> pen -- (a writing implement with a point from which ink flows) -> writing implement -- (an implement that is used to write)
-> implement -- (instrumentation (a piece of equipment or tool) used to effect an end) -> instrumentality, instrumentation -- (an artifact (or system of artifacts) that is instrumental in accomplishing some end)
-> artifact, artefact -- (a man-made object taken as a whole)
-> whole, unit -- (an assemblage of parts that is regarded as a single entity; "how big is that part compared to the whole?"; "the team is a unit")
-> object, physical object -- (a tangible and visible entity; an entity that can cast a shadow; "it was full of rackets, balls and other objects")
-> physical entity -- (an entity that has physical existence)
-> entity -- (that which is perceived or known or inferred to have its own distinct existence (living or nonliving))
Table 3. Hypernym tree for sense 1 of word "crayon"
crayon, wax crayon -- (writing implement consisting of a colored stick of composition wax used for writing and drawing)
-> writing implement -- (an implement that is used to write)
-> implement -- (instrumentation (a piece of equipment or tool) used to effect an end) -> instrumentality, instrumentation -- (an artifact (or system of artifacts) that is instrumental in accomplishing some end)
-> artifact, artefact -- (a man-made object taken as a whole)
-> whole, unit -- (an assemblage of parts that is regarded as a single entity; "how big is that part compared to the whole?"; "the team is a unit")
-> object, physical object -- (a tangible and visible entity; an entity that can cast a shadow; "it was full of rackets, balls and other objects")
-> physical entity -- (an entity that has physical existence)
-> entity -- (that which is perceived or known or inferred to have its own distinct existence (living or nonliving))
4
Using this information, the system can calculate the similarities in pairs, and increase the edge weights using the calculated similarity metric if they are similar. In this way, it is possible for the edge weight between two terms to be higher than the weight calculated using frequency of co-occurrence of these two terms. After this process, the high value edges will be selected to improve the graph with adding their LCS to the graph. If we follow the earlier example where jackal, dog and cat are frequently used words with high values, there is a high chance that this document is about carnivores. In case of frequent usage of dog and jackal but really minor mention of the word cat, there is highly a chance that it is about canines. But the possibility of topic being about carnivores still exists. This is why in the end; the system creates a list of possible topics ordered by their probability of being the major topic of the given document.
In order to find which topic the given document is classified as, we first create a training data which contains common terms about specific topics in their codes. The Documents are all imported to system and labeled with corresponding topics. After the initial training session is complete, we compare similarities of any incoming document’s codes with the ones in the system via Pearson’s Correlation, Jaccard similarity and Cosine similarity methods. The result of three algorithms are compared and the selected topic from the majority of these algorithms decide the primary topic of the given document.,
The main purpose is to easily classify the user tagged documents into the appropriate labels without having the user to do anything other than taking notes on document by tagging it with keywords. As the user adds more keywords, the WordNet structure allows us to more precisely locate the document into the appropriate category. As only a small portion is mentioned on section five, there have been multiple uses of WordNet in document classification and categorization. The most common concept used is the hypernymy of the selected words. This project also contains similar methods of previous works but is more specialized for purposes of classifying academic papers via a specific method of marking and tagging parts of document with keywords of choice. The critical part is that user also picks the exact sense of the given keyword throughout WordNet structure. Since words and senses are selected by user, it bypasses most of the word sense disambiguation process making them easier to classify using the word relations.
5
The rest of this thesis is organized as follows: section two explains the overall structure of the WordNet lexical database and its potential usages. Section three lists and briefly explains similarity measures. While the system allows the selection of the similarity method, it can be seen why certain ones are more preferred than others in this project. Section four includes explanation on latent semantic analysis and singular value decomposition methods. Section five contains related work and literature review which consists of a survey of text classification algorithms. The proposed method is presented in section six. In section seven, final words and thoughts are presented which are followed by potential future works in section eight.
6 2 WORDNET
WordNet is a large lexical database for English language. Nouns, verbs, adjectives and adverbs are grouped into sets of cognitive synonyms (synsets), each expressing a distinct concept. Synsets are interlinked by means of conceptual-semantic and lexical relations. [Miller, G.A., 1995]
In structure, WordNet resembles a thesaurus; it groups words together based on their meanings. However, there are some important distinctions. First, WordNet interlinks are not just words but they are specific senses of words. As a result, words that are found in close proximity to one another in the network are semantically disambiguated. Second, WordNet labels the semantic relations among words, whereas the grouping of words in a thesaurus does not follow any explicit pattern other than meaning similarity.
2.1 Structure
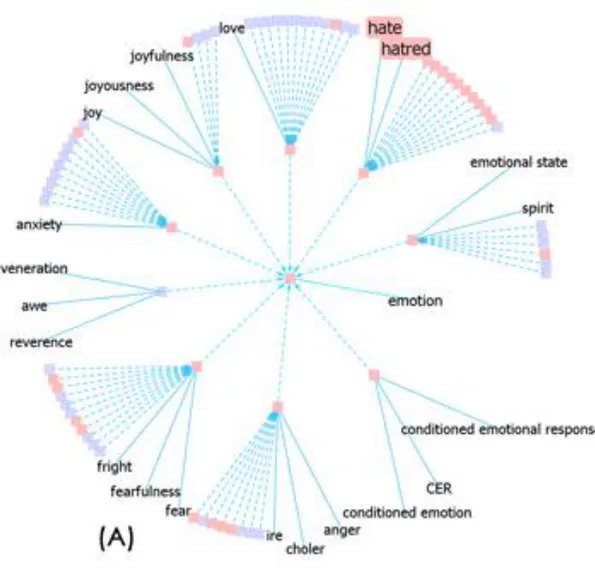
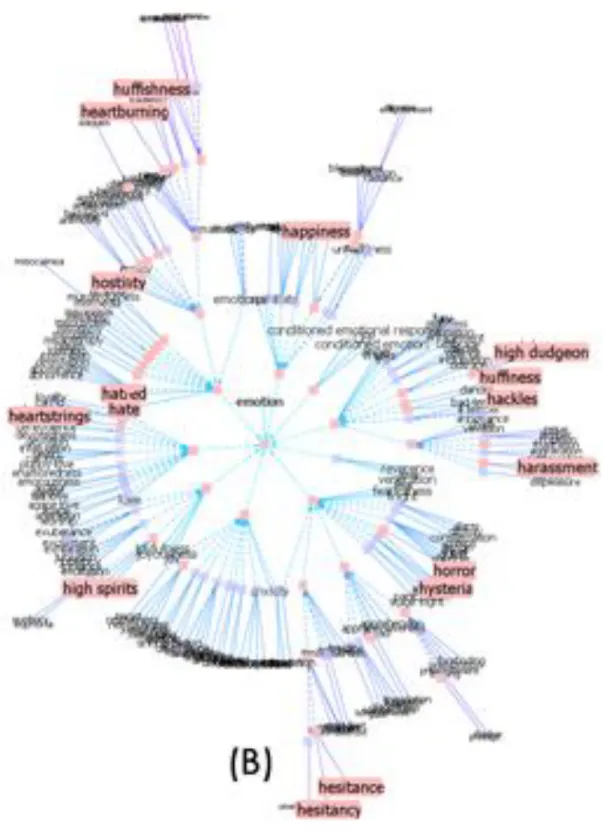
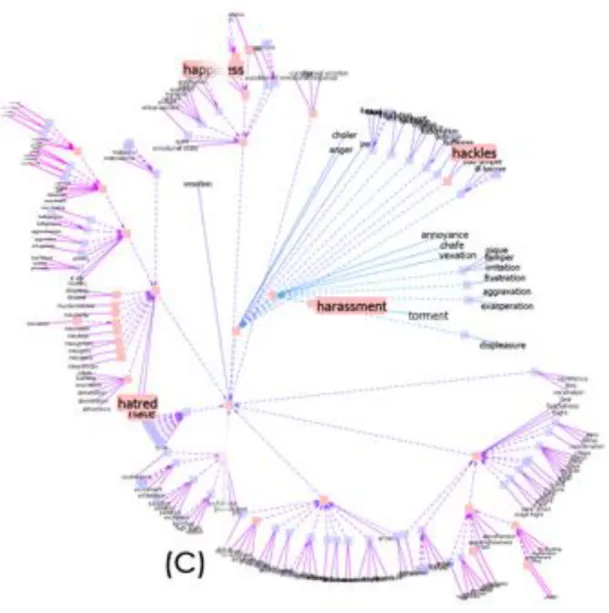
In WordNet, as it can be easily observed, the main relation among words is synonymy. Synonymy is the relations of words that are conceptually similar like shut and close or blissful and happy. These words are stored as synsets which are conceptually similar words grouped into unordered sets. WordNet’s currently contains around 117 000 synsets and every single one of them is linked to other synsets with conceptual relations as seen in figures below (Figure 1, Figure 2, Figure 3). Each synset contains a brief definition and one or more short sentences illustrating the use of the synset members. Each form-meaning pair in WordNet is unique since word forms with several distinct meanings are shown as distinct synsets [Fellbaum, C., 1998].
7
8
Figure 2. An extended version of the previous figure with synset of the connected words (Collins, C., 2006)
9
10 2.1.1 Part of Speech and Senses
In WordNet, each word consists of large synsets. Inside these synsets are each word’s meanings, usages and connections and much more. One of these parameters is part of speech (POS) which is the category of a word that reflects its grammatical role inside a sentence. There are four possible POS prefixes in WordNet. These are “Noun”, “Verb”, “Adjective” and “Adverb”. For example, word “fly” can both be a noun as in insect fly or a verb as in to fly. These meanings are called “senses” and each sense is labeled with a POS. A given word may have many senses and any amount among them can be nouns, verbs, adjectives or adverbs. Each sense is unique and has a unique key in WordNet.
2.2 Relations
The most frequently encoded relation among synsets is the super-subordinate relation which can also be called hyperonymy, hyponymy or IS-A relation. Traversing from a word to its hyponyms displays more specific objects as in canine => dog, wolf and jackal. Hyponym relation is a “is an instance of” kind of relation, where Hypernyms on the other hand, display more generic concepts in each step, as in canine => carnivore => mammal etc. As it can be seen in the examples on figure 4 and figure 5, hypernym relation is vaguely, “is a kind of” relation.
11
Figure 4. Fragment of WordNet taxonomy, solid lines are hypernyms; dashed lines indicate that there are more nodes between the presented ones (Resnik, P., 1995)
Figure 5. Another fragment of WordNet taxonomy where senses are seen clearly (Resnik, P., 1995)
Meronymy, the part-whole relation holds between synsets like chair and back, backrest, seat and leg. Parts are inherited from their superordinates: if a chair has legs, then an armchair has legs as well. Parts are not inherited “upward” as they may be characteristic only of specific kinds of things rather than the class as a whole: chairs and kinds of chairs have legs, but not all kinds of furniture have legs.
12 3 SIMILARITY MEASURES
The concept of semantic similarity is more specific than semantic relatedness. Semantic relatedness includes concepts such as antonymy and meronymy, while similarity does not. However, much of the literature uses the terms Semantic similarity, semantic relatedness and also semantic distance interchangeably. In essence, all three of these terms mean, "How much does term A have to do with term B?" The answer to this question is usually a number between -1 and 1, or between 0 and 1, where 1 signifies extremely high similarity.
Using the structure provided by the WordNet, there are couple similarity calculation methods widely known to measure the similarity between two given senses. Some of these methods are “path length”, “Resnik”, “Lin” and “Wu & Palmer”. Each of them has similar but different methods of calculating similarity between senses. While Resnik and Lin rely on LCS of the two concepts, path and Wu & Palmer are based on the shortest path length between the two concepts. [Warin, M., & Volk, H. M., 2004]
3.1 Resnik
The similarity measure proposed in Resnik, P., 1995 is defined as follows: The similarity score of two concepts in an “IS-A” taxonomy equals the information content value of their lowest common subsumer.
𝐼𝐶(𝑐𝑜𝑛𝑐𝑒𝑝𝑡) = − log(𝑃(𝑐𝑜𝑛𝑡𝑒𝑛𝑡)) (3.1) where 𝑃 is the probability of the word containing a given sense.
𝑠𝑖𝑚𝑟𝑒𝑠(𝑎, 𝑏) = max [𝐼𝐶(𝐿𝐶𝑆(𝑎, 𝑏))] (3.2) Resnik’s similarity measurement is based on the notion of information content. The information content of a concept is the logarithm of the probability of finding the concept in a given corpus. Therefore, nodes closer to root will contain a higher probability of containing a given sense (and lower values as a result of log) which affects the solution. Due to this value, similarity of a sense measured with itself is not
13
always the same if they are in different levels in the hierarchy. If the only LCS is the virtual root node, Resnik will return zero [Resnik, P., 1995].
3.2 Lin
Lin, D., 1998’s method defines the semantic similarity between two concepts a and b in a taxonomy as follows.
𝑠𝑖𝑚𝐿𝐼𝑁(𝑎, 𝑏) = 𝑚𝑎𝑥 [2×log𝑝𝐿𝐶𝑆(𝑎,𝑏)
log𝑝(𝑎)+ log𝑝(𝑏)] (3.3)
Lin’s proposed algorithm is intended to be useful in any domain, as long as there can be a probabilistic model for it. Since Resnik presupposes a taxonomy, Lin was more suitable for a wider range of models. Lin motivates his measure with the two arguments. First is that there was no similarity measures around that was not tied to a particular application or domain model. The second is that the fundamental assumptions of previous similarity measures were not explicitly stated. Lin is very firm on the second point. He lists the intuitions and assumptions underlying the measure, and then gives a logical proof that the measure actually conforms with them.
Lin measures scores are between 0 and 1. “apple” – “pear” gets a score of 0.935, “apple” - “apple” gets 1, while “apple” - “cortland” gets 0 due to the sparse data. [Lin, D., 1998]
3.3 Path Length
Path Length is one of the most basic ways of calculating similarity between senses. It is simply number of edges in a shortest path between given two points (Figure 6).
𝑝𝑎𝑡ℎ𝑙𝑒𝑛(𝑐1, 𝑐2) = number of edges in shortest path (3.4) In order to get a proper similarity value, it often involves a log transform
14
Figure 6. Fragment of WordNet hypernym hierarchy. (Resnik, P., 1995)
The two measures Leacock-Chodorow and Wu-Palmer are based on path length. Simply counting the number of nodes or relation links between nodes in a taxonomy may seem as a plausible way of measuring semantic similarity. As the distance between two concepts gets shorter, the similarity between those two terms get higher. However, this has proved not to be a successful method of measuring semantic similarity. A problem with this method is that, it relies on the links in the taxonomy that represent uniform distances. Therefore, most similarity or relatedness measures that are based on path length use some value to scale path length with. Path length measures have the advantage of being independent of corpus statistics, and therefore uninfluenced by sparse data.
3.4 Wu & Palmer
The first use of this algorithm was for English-Mandarin machine translation for verbs. It is not based on information content but on path lengths
𝑠𝑖𝑚
𝑤𝑢𝑝= 𝑚𝑎𝑥 [
2×𝑑𝑒𝑝𝑡ℎ (𝐿𝐶𝑆(𝑎,𝑏))𝑙𝑒𝑛𝑔𝑡ℎ(𝑎,𝑏)+2×𝑑𝑒𝑝𝑡ℎ(𝐿𝐶𝑆(𝑎,𝑏))
]
(3.6) The formula is rather straightforward. The depth of the lowest common subsumer of the two concepts is divided by the length (number of nodes) between the concepts times the depth again. [Wu, Z., & Palmer, M., 1994]15
4 SEMANTIC DOCUMENT CLASSIFICATION 4.1 Text Classification Algorithms
The classification process which is widely studied in the database, data mining and information retrieval communities is basically defined as follows. A set of training records 𝐷 = {𝑋1, … , 𝑋2} where each record is labeled with a class value from a set of k unique values as {1… k}. The training data is used to construct a classification model which relates the given record to one of the class labels. Some variations of the classification process allow ranking of different class choices or allow assignment of multiple labels.
Document classification is the task of assigning a document to one or more predefined classes. When the documents are in text form, then the classification process is called text classification.
As mentioned in [Aggarwal, C. C., & Zhai, C. 2012] some examples of domains where text classification is commonly used are as follows:
News Filtering and Organization Document Organization and Retrieval Opinion Mining
Email Classification and Spam Filtering
A wide variety of techniques have been designed for text classification. Some commonly used key methods for text classification are as follows:
Decision Trees: Used for hierarchical division of data with use of different text features. This division is designed in order to create class partitions. For a given instance, we determine the partition that it is most likely to belong to. These partitions are later used for the purposes of classification. Pattern (Rule)-based Classifiers: Used by constructing set of rules with a list of word patterns and corresponding class labels. These rules are used for classification.
SVM Classifiers: Used by partitioning the data with delineations between different classes. The key is to determine the optimal boundaries between
16
different classes and use them for classification. Neural Network Classifiers: Used by adapting the classifiers with the use of word features. Neural network classifiers are related to SVM classifiers, which are both in contrast with the generative classifiers. Bayesian (Generative) Classifiers: Used by building a probabilistic classifier based on modeling the word features in different classes. The text is classified by the probability of the documents belonging to the different classes on the basis of word presence in the documents.
4.2 Document Classification with a Lexical Database
The subject of semantic document classification with a lexical database usually (but not always) refers to automatic keyword extraction and word sense disambiguation as most papers about these topics link to that point.
It can be seen in Tiun, S., Abdullah, R., & Kong, T. E. 2001, that these projects highly depend on good lemmatizers and skimmers to get a proper stem of the word without destroying the content too much. After stemming and sense tagging the words, WordNet is usually used to extract proper sysnsets and compare synonyms or hypernyms with other words.
As mentioned above, WordNet is also used for word sense disambiguation in several manners. One of them can be seen in Wiebe, J., O'Hara, T., & Bruce, R. 1998, the group approached the problem with generating Bayesian networks using the hypernym (IS-A) or hyponym relations in order to find the appropriate senses within the document with the help of other words in the sentence.
In the Van der Plas, L., Pallotta, V., Rajman, M., & Ghorbel, H., 2004, it can be observed that two different lexical databases WordNet and EDR were used and compared on topic of extracting keywords from a spoken text. With proper similarity threshold values, it can clearly be seen that WordNet has the higher performance on keyword extraction.
There is a notable number of documents that can be accessed on the concepts of WordNet and Document classification on the web.
17
4.3 Uses of WordNet on Text Classification
Text Categorization is the classification of documents [Sebastiani, F., 2002]. It is a very useful operation frequently applied to determine categories for documents.
Elberrichi, Z., Rahmoun, A., & Bentaallah, M. A. (2008) mention that most of the flaws and shortcomings of the commonly used Bag-of-Words approach was eliminated by using WordNet structure instead, since, its ontology also captures the relations between words. They used two semantic relations of WordNet (synonymy and the hyponymy) to express these relations. Their categorization consists of two main stages. First step is selecting characteristic features for categories profiles, and second one is weighting the features in categories and calculating the distance between the categories profiles and the profile of the document to be classified.
For the Learning Phase, what is done is map the terms to concepts, add the hypernyms, then use a matrix of feature frequencies for features selection. After this point, weighted vectors are created for all categories a similarity measure is used to find the closest category for classification purposes.
Scott, S., & Matwin, S., 1998 use a similar but different concept with WordNet Hypernym structure. For computing hypernym density, they use a three pass approach. First pass assigns a part of speech tag to each word in corpus. Second pass list of all synonym and hypernym synsets from WordNet of all nouns and verbs are assembled. Infrequent synsets are discarded and remaining ones form a feature set. On third pass, density of each synset is computed for each example by number of occurrences of a synset divided by the number of words in document, creating a set of numerical feature vectors. A value ℎ (height of generalization) is used to limit the number of steps upward through hypernym hierarchy. In the end, each feature represents a set of either nouns or verbs. Best value of ℎ depends on characteristics of given text and characteristics of WordNet.
18 5 LATENT SEMANTIC ANALYSIS
Latent semantic analysis (LSA) is a technique in natural language processing used for analyzing relationships between a set of documents and the terms they contain. This analysis is generated by producing a set of concepts related to the documents and terms. LSA assumes that words that are close in meaning will occur in similar pieces of text. A matrix containing word counts per paragraph (rows represent unique words and columns represent each paragraph) is constructed from a large piece of text and a mathematical technique called singular value decomposition (SVD) is used to reduce the number of rows while preserving the similarity structure among columns.
Latent Semantic Analysis was born from the problem of using search words to find relevant documents. The core difficulty comes from when we compare words to locate relevant documents. The goal is to compare the concepts or meanings behind the given words. LSA attempts to solve this problem by mapping documents and the words into a “concept” zone and compare them inside this zone. [Puffinware LLC 2007 – 2010]
LSA introduces some dramatic simplifications.
Documents are represented as “bags of words”, this means that the words’ order is not important inside a document, the important thing is number of occurrences for each word in a document.
Concepts are represented as word patterns that consists of words which usually exist together in documents. For example, “leash”, “treat”, and “obey” can be seen in documents about dog training.
It is assumed for words to have only one meaning. This is obviously not the case (bow could be used as in bow and arrow or to bow in front of someone) but it makes the problem tractable.
The steps start with creating a frequency matrix. As seen in Figure 7, each word is noted with its number of occurrences in. After this point, the counts are modified to make rare words’ weight heavier. Using the formula 4.1, we calculate the Term Frequency – Inverse Document Frequency Matrix.
19
Figure 7. Count Matrix (zeros were left out for easier viewing) (Puffinware LLC 2007 - 2010)
𝑇𝐹𝐼𝐷𝐹
𝑖𝑗= (𝑁
𝑖𝑗⁄ 𝑁
∗𝑗) ∗ log(𝐷 𝐷
⁄ )
𝑖 (4.1)5.1 Singular Value Decomposition
Singular Value Decomposition (SVD) is used for empathizing strongest relationships and removing the noise. Singular value decomposition (SVD) is a factorization of a real or complex matrix. SVD of an 𝑚 × 𝑛 matrix 𝑀 containing real or complex values is a factorization of the following form.
Suppose𝑴is an𝑚 × 𝑛matrixwith entries from thefield𝐾, (a field ofreal numbersor complex numbers). Then there exists a factorization, called a SVD of𝑴, of the form [Stewart, G. W., 1993]
M = UΣV
∗
(4.2)
20 𝑼is a𝑚 × 𝑚,unitary matrix,
𝜮is a𝑚 × 𝑛diagonal matrix(non-negative real numbers on the diagonal) 𝑽∗is a𝑛 × 𝑛,unitary matrixover𝐾. (If𝐾 = 𝑹, unitary matrices areorthogonal
matrices.)𝑽∗is theconjugate transposeof the𝑛 × 𝑛unitary matrix,𝑽.
The diagonal entries,𝜎𝑖, of𝜮are known as thesingular valuesof𝑴. One of the common actions on this point is to list the singular values in descending order. In this case, the diagonal matrix,𝜮, is uniquely determined by𝑴(though not the matrices𝑼and𝑽).
These matrices are extracted from the TFIDF matrix which is mentioned earlier and used in order to create the reconstructed matrix which is later used for the Pearson’s Correlation. The U singular values are also used for classification operation later in order to minimize the time for re-creating the matrix.
21 6 METHODOLOGY
In order to find the desired topic keywords, a combination of frequency measurement and one of the previously mentioned similarity measures are used. The system can calculate similarity values using Resnik, Lin, Wu & Palmer, Jiang & Conrath, Leacock & Chodorow algorithms. Since the algorithms produce results in different intervals, the end result must be adjusted to match the frequency measure.
Before the similarity calculations, we use graphs for code organization to store and visualize the given codes into a graph. First of all, at the start of the process, the code words are entered in selected locations of the document in clusters. A cluster can contain any number of nodes. When the coding process is finished, all the given codes are added to graph as nodes with their unique senses given by the user. After that point, the system lists all the given words in the same cluster as pairs. For example, the cluster that consists of codes (a, b, c, d), the system creates a-b, a-c, a-d, b-c, b-d, c-d pairs and system adds an edge between each of them on the graph with a frequency count of one. When an edge is created, if both ends of that edge contain a sense that can be found in WordNet, the system calculates the similarity measure with the primarily selected measurement method and stores that value inside the edge. This structure can be viewed by the user to gain a visual perspective of the approach on the document. The organized codes offer a much clearer aspect in graph form than they do in the previously entered text format. After the base construction is complete we get to the frequency and similarity calculations.
Since the given senses are unique, if a cluster with a previously existing sense is given within its codes, the system links all its possible pairs to the existing node. If an already existing pair is given inside a new cluster, the system increases that edge’s count by one. The total number of pair counts is always kept in memory as new ones are added. After each cluster is added to the system, the edges’ count values are used to calculate their frequency weight and for this process, the frequency value is normalized in the following manner.
𝐸
𝑓𝑟𝑒𝑞=
𝐸𝑐𝑜𝑢𝑛𝑡22
Therefore all the edges obtain a frequency value between 0 and 1. After this point, the total value of the edge is calculated by using a geometric mean
𝐸
𝑉𝑎𝑙𝑢𝑒= √(1 + 𝐸
𝑠𝑖𝑚)
2+ (1 + 𝐸
𝑓𝑟𝑒𝑞
)
2− 1
(6.2)The system measures the value of each edge as they are assigned and if an edge surpasses this threshold, the system vouches that edge suitable for the enrichment progress. In order to improve the graph with nodes driven from the sense of users’ words, enrichment progress adds the common parent of the two codes in terms of hypernymy from the WordNet as an enrichment node. This new node is connected to both child nodes but since it was never entered by the user, these edges have a count value of zero. The logic behind this operation can be easily described with an example. When a document is talking about dogs, wolves and jackals, it’s usually safe to assume that this document is talking about canines, which is the common parent of these three given entities, also known as the least common subsume (LCS). The LCS can be considered as the general topic of the entered text therefore adding it into the graph actually ties the sense into a common point.
Each time a new cluster is added, the frequency value and therefore the total value is recalculated in order to find the stronger edges of the graph. After a period of coding on a given document, the user unconsciously creates their personal viewpoint on the document as a unique graph. This graph is the ontology of the users’ understanding and expectations on that document. The strong edges of the graph determine the potential topics for the users’ desired topic but also create a fingerprint.
Another feature of these created graph ontologies is they can be cross referenced with a graph similarity algorithm in order to match similar documents. Since it is highly likely for those two documents with same codes to be similar in content or personal interest, even if they don’t have the same designated topics, the documents will be linked with a similarity value. A possible cross graph calculation can give an even higher level and more precise keyword to the document group. As documents are further added to the system and coded with the appropriate senses, the library will dynamically grow and group the documents in general topics. As a result, the users will
23
have their libraries mapped and linked into several topics that allow faster and more organic information retrieval.
In our project, the edge values of the graphs are later flattened into a single matrix for purposes of analyzing the connections between edges across multiple documents using Latent Semantic Analysis (LSA). Using the given formula of Term Frequency - Inverse Document Frequency (TFIDF) below, the value of each point in the matrix is recalculated in a manner that strengthens the less frequent edges and filter out some of the noise.
𝑇𝐹𝐼𝐷𝐹
𝑖𝑗=(𝑁
𝑖𝑗⁄ 𝑁
∗𝑗) ∗ log(𝐷 𝐷
⁄ )
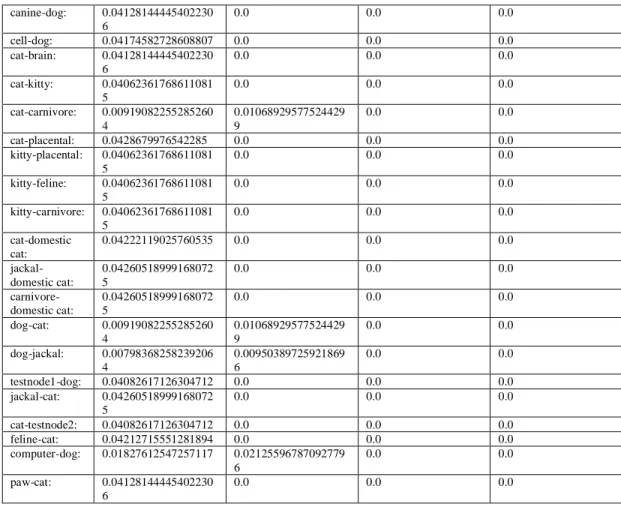
𝑖 (6.3)A sample of TFIDF matrix of four documents can be seen below. The columns represent the documents while each row represents an edge.
Table 4. A Sample TFIDF matrix
canine-dog: 0.04128144445402230 6 0.0 0.0 0.0 cell-dog: 0.04174582728608807 0.0 0.0 0.0 cat-brain: 0.04128144445402230 6 0.0 0.0 0.0 cat-kitty: 0.04062361768611081 5 0.0 0.0 0.0 cat-carnivore: 0.00919082255285260 4 0.01068929577524429 9 0.0 0.0 cat-placental: 0.0428679976542285 0.0 0.0 0.0 kitty-placental: 0.04062361768611081 5 0.0 0.0 0.0 kitty-feline: 0.04062361768611081 5 0.0 0.0 0.0 kitty-carnivore: 0.04062361768611081 5 0.0 0.0 0.0 cat-domestic cat: 0.04222119025760535 0.0 0.0 0.0 jackal-domestic cat: 0.04260518999168072 5 0.0 0.0 0.0 carnivore-domestic cat: 0.04260518999168072 5 0.0 0.0 0.0 dog-cat: 0.00919082255285260 4 0.01068929577524429 9 0.0 0.0 dog-jackal: 0.00798368258239206 4 0.00950389725921869 6 0.0 0.0 testnode1-dog: 0.04082617126304712 0.0 0.0 0.0 jackal-cat: 0.04260518999168072 5 0.0 0.0 0.0 cat-testnode2: 0.04082617126304712 0.0 0.0 0.0 feline-cat: 0.04212715551281894 0.0 0.0 0.0 computer-dog: 0.01827612547257117 0.02125596787092779 6 0.0 0.0 paw-cat: 0.04128144445402230 6 0.0 0.0 0.0
24 testnode3-testnode2: 0.04119646653447222 4 0.0 0.0 0.0 arm-testnode2: 0.04082617126304712 0.0 0.0 0.0 cat-computer: 0.04188792682967639 6 0.0 0.0 0.0 science-arm: 0.04062361768611081 5 0.0 0.0 0.0 dog-canine: 0.04251136222808305 6 0.0 0.0 0.0 dog-jackal: 0.04251136222808305 6 0.0 0.0 0.0 dog-puppy: 0.0 0.04909663895601793 6 0.0 0.0 cat-puppy: 0.0 0.04924317871501428 0.0 0.0 dog-wool: 0.0 0.04849948021068169 0.0 0.0 jackal-wool: 0.0 0.04849948021068169 0.0 0.0 wool-computer: 0.0 0.04916634600180222 5 0.0 0.0 jackal-computer: 0.0 0.04849948021068169 0.0 0.0 cat-space: 0.0 0.04734091144931589 0.0 0.0 cat-image: 0.0 0.04705619254885989 0.0 0.0 image-space: 0.0 0.04797951850420852 0.0 0.0 dog-bomb: 0.0 0.04849948021068169 0.0 0.0 jackal-bomb: 0.0 0.04849948021068169 0.0 0.0 rainbow-fly: 0.0 0.04705619254885989 0.0 0.0 dog-space: 0.0 0.04705619254885989 0.0 0.0 dog-wolf: 0.0 0.04912900572805386 0.0 0.0 wolf-space: 0.0 0.04705619254885989 0.0 0.0 dog-carnivore: 0.0 0.04924317871501428 0.0 0.0 dog-animal: 0.0 0.04909663895601793 6 0.0 0.0 dog-puppy: 0.0 0.04909663895601793 6 0.0 0.0 bomb-explosion: 0.0 0.0 0.03215154923451211 0.0 bomb-grenade: 0.0 0.0 0.03335909334656385 0.0 explosion-grenade: 0.0 0.0 0.03202739670924151 0.0 money-bazooka: 0.0 0.0 0.03202739670924151 0.0 money-grenade: 0.0 0.0 0.03202739670924151 0.0 bazooka-grenade: 0.0 0.0 0.03370591775907183 0.0 bomb-soldier: 0.0 0.0 0.01451137761527883 9 0.01999656303199461 7 bomb-terrorist: 0.0 0.0 0.01451137761527883 9 0.01999656303199461 7 explosion-soldier: 0.0 0.0 0.03202739670924151 0.0 explosion-terrorist: 0.0 0.0 0.03202739670924151 0.0 soldier-terrorist: 0.0 0.0 0.01394454680981014 3 0.01921539223687039 3 war-soldier: 0.0 0.0 0.01580880005665379 8 0.02178436225420041 6 war-atom: 0.0 0.0 0.01510279624302882 4 0.02081166339572038 5 war-cat: 0.0 0.0 0.03202739670924151 0.0 soldier-atom: 0.0 0.0 0.01504805702024740 1 0.02109068480284229 soldier-cat: 0.0 0.0 0.0332565963206892 0.0 atom-cat: 0.0 0.0 0.03255058136448129 4 0.0 war-fight: 0.0 0.0 0.03380070314843392 0.0 war-attack: 0.0 0.0 0.03354207287028946 0.0 war-terrorist: 0.0 0.0 0.03202739670924151 0.0
25 fight-attack: 0.0 0.0 0.01316360083501321 0.01813941523581819 7 fight-terrorist: 0.0 0.0 0.01580880005665379 8 0.02178436225420041 6 attack-terrorist: 0.0 0.0 0.01580880005665379 8 0.02178436225420041 6 gold-war: 0.0 0.0 0.01510279624302882 4 0.02081166339572038 5 gold-treasure: 0.0 0.0 0.03323767883976356 4 0.0 war-treasure: 0.0 0.0 0.03266990188459897 0.0 money-explosion: 0.0 0.0 0.01510279624302882 4 0.02081166339572038 5 money-fight: 0.0 0.0 0.03266990188459897 0.0 money-ISIS: 0.0 0.0 0.01566161949645004 6 0.02163816679390748 explosion-fight: 0.0 0.0 0.033428054845297 0.0 explosion-ISIS: 0.0 0.0 0.01566161949645004 6 0.02163816679390748 fight-ISIS: 0.0 0.0 0.0321551599188377 0.0 bazooka-instrumentality : 0.0 0.0 0.03370591775907183 0.0 bazooka-grenade: 0.0 0.0 0.03370591775907183 0.0 war-military action: 0.0 0.0 0.03380070314843392 0.0 war-fight: 0.0 0.0 0.03380070314843392 0.0 tree-explosion: 0.0 0.0 0.0 0.04404919435464433 tree-blast: 0.0 0.0 0.0 0.04404919435464433 explosion-blast: 0.0 0.0 0.0 0.04596038499806022 5 gold-mortar: 0.0 0.0 0.0 0.04404919435464433 gold-grenade: 0.0 0.0 0.0 0.04404919435464433 mortar-grenade: 0.0 0.0 0.0 0.04631256923465598 bomb-atom: 0.0 0.0 0.0 0.04476461290140257 atom-terrorist: 0.0 0.0 0.0 0.04476461290140257 war-dog: 0.0 0.0 0.0 0.04404919435464433 soldier-dog: 0.0 0.0 0.0 0.04572744899940143 4 atom-dog: 0.0 0.0 0.0 0.04476461290140257 money-gold: 0.0 0.0 0.0 0.04492763816428715 explosion-gold: 0.0 0.0 0.0 0.04492763816428715 gold-ISIS: 0.0 0.0 0.0 0.04425419407780081 mortar-instrumentality : 0.0 0.0 0.0 0.04631256923465598
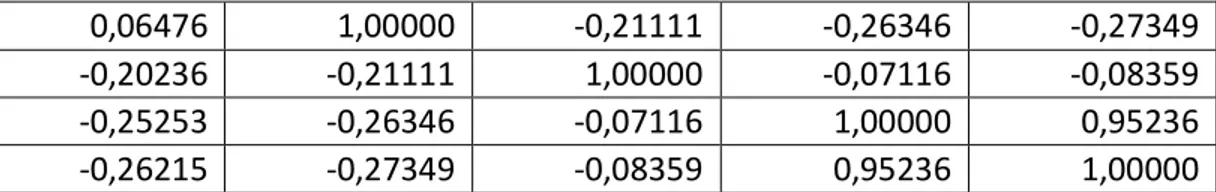
After the TFIDF matrix is created, singular value decomposition are extracted from the matrix as shown in the section 5.1. We calculate the final matrix via these three matrices using the formula 4.2. Lastly, the Pearson’s Correlation matrix is calculated in order to see the similarity between each document and label these groups of documents as our topics. With this operation we have created our training data and possible classes for upcoming documents.
Table 5. Pearson Matrix of Training Data
26
0,06476 1,00000 -0,21111 -0,26346 -0,27349
-0,20236 -0,21111 1,00000 -0,07116 -0,08359
-0,25253 -0,26346 -0,07116 1,00000 0,95236
-0,26215 -0,27349 -0,08359 0,95236 1,00000
After the training operation, when we want to classify a document, calculating all the matrices from scratch would be both time consuming and high on computational cost, therefore instead of doing everything from zero, we format our test data into a single column. This column contains the TFIDF values of the new document for only the edges that have been defined in the training data. This column is used to calculate a column with the final matrix using the training matrix’s U matrix from the SVD results. Using the formula 6.4 we create a column for our final matrix which was constructed from singular value matrices of SVD operation.
𝑈 ∗ 𝑈
𝑇
∗ 𝑉
(6.4)This column is then added to the end of original matrix as mentioned above. This new matrix is used for the new Pearson’s correlation and the highest value from the final row determines which document from the training data, this document is closest to, therefore assigning it into that class. A sample document’s result is given below. Only the lower triangular matrix is given since it is symmetrical. As it can be seen in the last row of given matrix, the document is assigned to be in the same class with second column which corresponds to the second document label in the training data.
Table 6. Pearson Correlation of Training Documents
0,063466 -0,20217 -0,21135 -0,25207 -0,26352 -0,07136 -0,26187 -0,27377 -0,08371 0,952219 0,218957 0,527189 -0,1061 -0,13321 -0,13839
27
Following charts contain the similarity results for several test documents that are used to see which document of the previous train data they are most similar to. In order to cross check and validate the results, Jaccard similarity and Cosine similarity was also used aside from Pearson’s correlation. Rows are marked with corresponding similarity measurement method; P for Pearson, J for Jaccard and C for Cosine. On each row, the bold and underlined element is the one selected to be the closest document, therefore the document is classified as the same topic as the highest similarity document.
Table 7. Similarity Chart for Test Document 1
Doc. 1 sim Doc. 2 sim Doc. 3 sim Doc. 4 sim Doc. 5 sim
P -0.1527 -0.1330 0.4227 0.0809 0.0682
J 0.0 0.0137 0.2071 0.1860 0.1760
C 0.0 0.0226 0.4891 0.2099 0.2029
Table 8. Similarity Chart for Test Document 2
Doc. 1 sim Doc. 2 sim Doc. 3 sim Doc. 4 sim Doc. 5 sim
P 0.218961 0.52718 -0.1060 -0.1332 -0.1383
J 0.0698 0.1211 0.0040 0.0 0.0
C 0.2982 0.5669 0.0006 0.0 0.0
Table 9. Similarity Chart for Test Document 3
Doc. 1 sim Doc. 2 sim Doc. 3 sim Doc. 4 sim Doc. 5 sim
P -0.1404 -0.1180 0.3760 0.0910 0.0790
J 0.0 0.0144 0.1781 0.1802 0.1695
28
In two out of three tests, all three similarity measurement methods resulted in the same classification result for the selected document. The third document’s Jaccard similarity measure classified the document as “Train data 4” while Pearson and Cosine classified it as “Train data 3”. It can be concluded that even when there are divergent results in classification process, the decision can be made by the majority of the results which supports each other.
The following graphs are created from the test code sets which include similar senses, totally irrelevant words, same words with different senses and test nodes that do not appear in WordNet. The same test groups are executed with different similarity methods and threshold values. The graphs are a simple example of a possible coding on a document that is purposely modified to include high and low value edges and used as a possible proof of concept sample.
30
31
33
34 Figure 11. Another result graph of Resnik similarity
35
Figure 12. Graph of a Test Document
36
And as a final note, the similarity measures are only as strong as the used lexical database can provide information on. Even though WordNet is the largest lexical database with over 117.000 synsets, since it is a general use dictionary, it looks weaker and weaker as you get into specific topics on your interests. (One possible action on this can be adding personalized corpora to the system to determine values when WordNet cannot understand the details but since the measurements are a delicate matter, the corpus should also be added in a delicate way with appropriate links and similarity measures.)
37
7 CONCLUSION AND FUTURE WORK
In this thesis, a potential usage of WordNet is presented for semi-automatic document classification. The given set includes sample usages for document coding and similarity measurement on these codes.
The thesis also briefly mentions the prior work that has been done in similar areas such as automatic topic, keyword extraction on documents, sentences or real time speech.
The semi-automatic approach lets users experience and extract different meanings and concepts from the same document. Since the coding of words on the document is unique to user perspective, not only the same document can be classified as different topics, but also it is possible to code catch a possibly hidden correlation between two normally unrelated documents. An automatic parser may extract the existing keywords from these two documents but it is highly possible for it to never link these two in a similar manner.
By using singular value decomposition on the TFIDF matrix and calculating the Pearson’s Correlation to the end result gave us the similarity value of the given document in relation to the training data. Since the sample size of the training data was relatively small for an accurate measurement for exact confidence, it is highly suggested to improve the train data size in the future or even adding the documents with high confidence values into the training data to expand it might be considered. One of the best approaches to this is calculating the error estimations from Pearson’s Correlation library and calculate the confidence intervals using that information.
This thesis aims to create a possible background for information to be more easily and organically ordered and accessible. Project mainly focuses on similarity between words and usage of these values to improve users’ efficiency on resource handling.
In wide scope of potential usages of this work, a possible work is using a graph similarity method not only on the users’ own documents but also with other users as well. This will allow users to find other people (most probably other academicians working on similar topics) to potentially have collaborations. For example while
38
adding codes to a document, the system can recommend the user a document with similar topic which was coded by someone else.
One of the obvious future works is completing the fully fledged program and making it market ready. Since this thesis only included several proof of concepts, it is dependent on lots of other libraries and it is hard to duplicate the setup on a different device. The process is tedious and messy. It is possible to use different base programs to exclude most of the library dependencies and also make the program a lot more user friendly.
Another approach that we did not fully test in this project was a selection variant in the step of creating enrichment nodes. Imagine we have two nodes, let’s say A and C. The relation between these words is as follows, A is hypernym of concept B and B is hypernym of C. When we want to enrich the connection between A and C, we took the LCS of these two nodes which in this case is node A and since A was already in the graph, we do not add this node. But it might also help us to add the node B in this case since it is the common point between these two concepts. The results of such a step should be further researched and tested before expanding the system with this approach.
Also as mentioned in the end of methodology chapter, it is possible to improve the results by carefully adding new corpora and knowledge bases such as Cyc since WordNet still has its limitations.
39
REFERENCES
Aggarwal, C. C., & Zhai, C. 2012, Mining text data. Springer Science & Business Media.
Bawakid, A., & Oussalah, M., 2010, September. A semantic-based text classification system. In Cybernetic Intelligent Systems (CIS), 2010 IEEE 9th International Conference on (pp. 1-6). IEEE.
Blanchard, E., Harzallah, M., Briand, H., & Kuntz, P., 2005, A Typology Of Ontology-Based Semantic Measures. In EMOI-INTEROP.
Budanitsky, A., Hirst, G. 2001, Workshop on WordNet and Other Lexical Resources, Second meeting of the North American Chapter of the Association for Computational Linguistics, Pittsburgh
Budanitsky, A., & Hirst, G., 2006, Evaluating wordnet-based measures of lexical semantic relatedness. Computational Linguistics, 32(1), 13-47.
Collins, C., 2006, WordNet explorer: applying visualization principles to lexical semantics. Computational Linguistics Group, Department of Computer Science, University of Toronto, Toronto, Ontario, Canada.
http://vialab.science.uoit.ca/portfolio/wordnet-visualization (access date: 27.08.2015)
Elberrichi, Z., Rahmoun, A., & Bentaallah, M. A., 2008, Using WordNet for Text Categorization. Int. Arab J. Inf. Technol., 5(1), 16-24.
Fellbaum, C., 1998, WordNet: An Electronic Lexical Database, Cambridge, MA: MIT Press.
Finlayson, M. A., 2014, Java libraries for accessing the Princeton WordNet: Comparison and evaluation. In Proceedings of the 7th Global Wordnet Conference, Tartu, Estonia.
40
REFERENCES
Greenbacker, C. F., Wu, P., Carberry, S., McCoy, K. F., Elzer, S., McDonald, D. D., ... & Demir, S., 2011, July, Improving the accessibility of line graphs in
multimodal documents. In Proceedings of the Second Workshop on Speech and
Language Processing for Assistive Technologies (pp. 52-62). Association for
Computational Linguistics.
Jiang, J. J., & Conrath, D. W., 1997, Semantic similarity based on corpus statistics and lexical taxonomy. arXiv preprint cmp-lg/9709008.
Li, Y., Bandar, Z., & McLean, D., 2003, An approach for measuring semantic similarity between words using multiple information sources. Knowledge and Data Engineering, IEEE Transactions on, 15(4), 871-882.
Lin, D., 1998, July, An information-theoretic definition of similarity. In ICML(Vol. 98, pp. 296-304).
Meng, L., Huang, R., & Gu, J., 2013, A review of semantic similarity measures in wordnet. International Journal of Hybrid Information Technology,6(1), 1-12. Miller, G.A., 1995, WordNet: A Lexical Database for English,
Communications of the ACM Vol. 38, No. 11: 39-41.
Mittal, K., & Jain, A., 2015, Word sense dısambıguatıon method usıng semantıc sımılarıty measures and owa operator.ıctact Journal on Soft Computing, 5(2).
Ninove, L., 2007. Graph similarity algorithms. In Seminar Presented at Department of Mathematical Engineering, University of Catholique de Louvain.
Pedersen, T., Patwardhan, S., & Michelizzi, J., 2004, May, WordNet:: Similarity: measuring the relatedness of concepts. In Demonstration papers at hlt-naacl 2004 (pp. 38-41). Association for Computational Linguistics.
41
REFERENCES
Puffinware LLC 2007 - 2010, http://www.puffinwarellc.com/index.php/news-and-articles/articles/33.html (access date: 30.08.2015)
Ramakrishnanan, G., & Bhattacharyya, P., 2003, Text representation with wordnet synsets using soft sense disambiguation. Ingenierie des Systems d Information, 8(3), 55-70.
Resnik, P., 1995, Using information content to evaluate semantic similarity in a taxonomy. arXiv preprint cmp-lg/9511007.
Resnik, P., 1999, Semantic similarity in a taxonomy: An information-based measure and its application to problems of ambiguity in natural language. J. Artif. Intell. Res.(JAIR), 11, 95-130.
Scott, S., & Matwin, S., 1998, August, Text classification using WordNet hypernyms. In Use of WordNet in natural language processing systems: Proceedings of the conference (pp. 38-44).
Scott, S., & Matwin, S., 1999, June, Feature engineering for text classification. In ICML (Vol. 99, pp. 379-388).
Sebastiani, F., 2002, Machine learning in automated text categorization. ACM computing surveys (CSUR), 34(1), 1-47.
Stewart, G. W., 1993, On the early history of the singular value decomposition. SIAM review, 35(4), 551-566.
Tiun, S., Abdullah, R., & Kong, T. E. 2001, Automatic topic identification using ontology hierarchy. In Computational Linguistics and Intelligent Text Processing (pp. 444-453). Springer Berlin Heidelberg.
Van der Plas, L., Pallotta, V., Rajman, M., & Ghorbel, H., 2004, Automatic keyword extraction from spoken text. a comparison of two lexical resources: the edr and wordnet. arXiv preprint cs/0410062.
42
REFERENCES
Warin, M., & Volk, H. M., 2004, Using WordNet and semantic similarity to disambiguate an ontology. Retrieved January, 25, 2008.
Wei, T., Lu, Y., Chang, H., Zhou, Q., & Bao, X., 2015, A semantic approach for text clustering using WordNet and lexical chains. Expert Systems with Applications, 42(4), 2264-2275.
Wiebe, J., O'Hara, T., & Bruce, R. 1998, October, Constructing bayesian networks from Wordnet for word-sense disambiguation: Representational and processing issues. In US Army Conference on Applied Statistics, 21-23 October 1998 (p. 67).
Wu, Z., & Palmer, M., 1994, June, Verbs semantics and lexical selection. InProceedings of the 32nd annual meeting on Association for Computational Linguistics (pp. 133-138). Association for Computational Linguistics.
43
CURRICULUM VITAE
Alican Öztürk was born in 1988, Izmir – Turkey. He holds a Bachelor of Science degree from Yaşar University, Computer Engineering Department after graduating in 2010. After starting his Master of Science (MSc.) education in Yaşar University, he started to study on natural language processing. He simultaneously started as a research assistant in Yaşar University in 2010 and he continues his job since then.