IOP Conference Series: Materials Science and Engineering
PAPER • OPEN ACCESS
Evaluation of Optimum Building Envelope Materials in Different Climate
Regions of Turkey
To cite this article: Sadik Yigit et al 2019 IOP Conf. Ser.: Mater. Sci. Eng. 471 062009
View the article online for updates and enhancements.
Content from this work may be used under the terms of theCreative Commons Attribution 3.0 licence. Any further distribution of this work must maintain attribution to the author(s) and the title of the work, journal citation and DOI.
Published under licence by IOP Publishing Ltd
WMCAUS 2018
IOP Conf. Series: Materials Science and Engineering 471 (2019) 062009
IOP Publishing doi:10.1088/1757-899X/471/6/062009
1
Evaluation of Optimum Building Envelope Materials in
Different Climate Regions of Turkey
Sadik Yigit 1,2, Semih Caglayan 2, Beliz Ozorhon 2
1 Istanbul Kultur University, Department of Civil Engineering, Bakirkoy, 34156, Istanbul, Turkey
2 Bogazici University, Department of Civil Engineering, Bebek, 34342, Istanbul, Turkey
Abstract. Energy-related issues have been in the centre of the policies of many governments.
Increasing the energy production or decreasing the energy consumption can provide significant economic support to countries. Thus, developments in energy industry are of prime importance for countries, especially for Turkey, where improving the energy efficiency is one of the key components of the 2023 national strategy objectives and energy policies. Energy efficiency in residential buildings can be obtained by a number of ways such as optimizing the building envelope. Design of a building envelope depends on a number of parameters including the window, wall, basement, and ceiling properties. The insulation properties of such components can radically impact the energy efficiency of a building. Selecting the optimum materials in designing the building envelope has been one of the fundamental issues in the academic field in the last decade. Providing cost efficient envelope design while satisfying relevant standards has been the common goal. The aim of this study is to find optimum materials for the building envelope design of a residential building in Turkey. Genetic algorithm is utilized for the optimization purposes. The decision variables are determined as the window type and the insulation materials to be applied on the exterior walls, ceiling, and basement. The properties and costs of the materials are obtained from the unit price list prepared by Republic of Turkey Ministry of Environment and Urbanization. The objective function is expressed as the minimization of the total cost of the building envelope materials. The constraints are stated as the limitations indicated by the Turkish Standard 825 (TS 825), “thermal insulation requirements for buildings”. The optimization environment including the genetic algorithm and heating energy calculations is generated in Matlab. A total of 30, 20, 60, and 27 alternatives are identified for the exterior walls, basement, ceiling, and window types, respectively. Optimum design solutions are determined for four climate regions of Turkey as defined by TS 825. The optimization environment could identify optimum design solution among thousands of combinations for each climate region separately. The optimization environment can be utilized by homeowners or designers to determine the building envelope with minimum cost satisfying the relevant standard. Also, the study is expected to encourage professionals in the construction industry to utilize such optimization tools to deal with design-related decisions.
1. Introduction
Among the Organization for Economic Co-operation and Development (OECD) countries, energy demand of Turkey has had the highest growth rate over the last 15 years. As the domestic resources of Turkey can only meet 26% of the total demand, energy-related problems have become more of an
WMCAUS 2018
IOP Conf. Series: Materials Science and Engineering 471 (2019) 062009
IOP Publishing doi:10.1088/1757-899X/471/6/062009
2
issue. Increasing the energy efficiency is regarded as one of the targets of Turkey’s energy strategy [1]. It can be defined as decreasing the unit amount without reducing the service quality. In Turkey’s 2023 national strategy objectives and energy policies, energy density is intended to be decreased 20% compared to that of 2011 [2]. Energy efficiency in residential buildings can be decreased in a number of ways including the optimization of the design of building envelope.
Selecting the right materials to be used in the building envelope has been intensively investigated by scholars in the academic field in the last decade. Caldas and Norford [3] developed a design optimization tool utilizing the genetic algorithm. They used the tool to determine the locations and sizes of windows in an office building. They evaluated the lighting and thermal behaviour of the building by using DOE2.1E. Magnier and Haghighat [4] optimized the thermal comfort and energy consumption of a building. The HVAC system settings, passive solar design, and thermostat programming were selected as the decision variables. It was reported that significant decrease in energy consumption and increase in thermal comfort can be obtained with the optimization approach. Bambrook et al. [5] conducted a study to optimize the design for a low energy home in Sydney. The optimization process considered the construction cost, the HVAC capital cost, and the electricity cost for space heating and cooling. The decision variables were selected as the wall and roof insulation thicknesses, the window type, the night ventilation air change rate, and the thickness of the internal thermal mass wall. Gossard et al. [6] developed a technique integrating the genetic algorithm and artificial neural network to optimize the thermophysical properties of the exterior walls of a structure. They applied the technique to a structure in two different climates, Nancy and Nice.
This study aims to determine optimum materials to be used in the building envelope of a reference building in Turkey. A number of design alternatives are considered for the window type and for the insulation materials utilized on the exterior walls, ceiling, and basement. Genetic algorithm is used to determine the optimum combination of materials for each climate region in Turkey. The unit price list prepared by Republic of Turkey Ministry of Environment and Urbanization [7] is used to obtain the properties and costs of these materials. The objective function is stated as to minimize the total cost of the materials used in the building envelope. The limitations indicated by the Turkish Standard 825 (TS 825), “thermal insulation requirements for buildings”, are considered as the constraints [8]. The material combination with the lowest total cost satisfying the constraints is regarded as the optimum solution. Optimum design solutions are determined for four climate regions of Turkey as defined by TS 825. Matlab R2017b is used to generate the optimization environment composed of the genetic algorithm and heating energy calculations. A total of 30, 20, 60, and 27 alternatives are identified for the exterior walls, basement, ceiling, and window types, respectively.
2. Methodology
The building envelope design is composed of several components such as exterior walls, ceiling, basement, and windows. Properties of each component might be effective in determining the energy efficiency of the building. In this study, an optimization code is generated to identify optimum materials to be employed in the envelope design of a reference building in Turkey.
2.1. Building properties
The building to be employed in this study is a five-storey residential building. The length, width, and height of the building are 25, 20, and 15 m, respectively. The window areas are 80, 40, 40, and 40 m2 in south, north, east, and west, respectively. Figure 1 shows the details of the properties of components (except the window) in the building envelope. It is shown that the exterior wall includes the reinforced concrete and infilled walls. The same insulation material is applied on them. The basement is in direct contact with soil. The insulation material is applied between the reinforced concrete and screed. The top of the building is a ceiling with roof. The insulation material is applied on the reinforced concrete and is protected with a cover.
WMCAUS 2018
IOP Conf. Series: Materials Science and Engineering 471 (2019) 062009
IOP Publishing doi:10.1088/1757-899X/471/6/062009
3
Figure 1. Properties of building envelope 2.2. Optimization approach
The optimization approach utilizes the genetic algorithm, which is composed of three main parts including decision variables, constraints, and objective function.
2.2.1. Decision variables. The optimization problem includes for decision variables including:
• Insulation material on the exterior wall, • Insulation material on the ceiling, • Insulation material on the basement, • Window type.
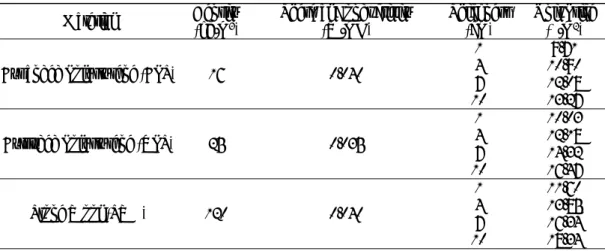
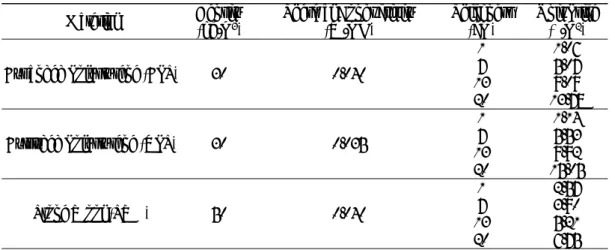
A total of 27, 30, 60, and 20 alternatives were considered as the design options for the window type and insulation materials to be applied on the exteriors walls, ceiling, and basement, respectively. The properties and costs of the materials are obtained from the unit price list [7]. Table 1, Table 2, and Table 3 show the insulation material alternatives for the exterior walls, ceiling, and basement, respectively. Each insulation thickness represents an alternative and prices of the intermediate thicknesses can be calculated by interpolation. Table 4 shows the window alternatives.
Table 1. Insulation material alternatives for the exterior walls
Material Density (kg/m3) Thermal Conductivity (W/mK) Thickness (cm) Unit Price ($/m2)
Expanded Polystyrene (EPS) 16 0.040
1 9.71 4 10.90 7 12.08 10 13.27 Extruded Polystyrene (XPS) 25 0.035 1 10.03 4 12.18 7 14.32 10 16.47 Stone Wool (SWL) 120 0.040 1 11.60 4 13.85 7 16.34 10 18.34
WMCAUS 2018
IOP Conf. Series: Materials Science and Engineering 471 (2019) 062009
IOP Publishing doi:10.1088/1757-899X/471/6/062009
4
Table 2. Insulation material alternatives for the ceiling
Material Density (kg/m3) Thermal Conductivity (W/mK) Thickness (cm) Unit Price ($/m2)
Expanded Polystyrene (EPS) 30 0.040
1 1.06 7 5.07 13 9.09 20 13.78 Extruded Polystyrene (XPS) 30 0.035 1 1.14 7 5.53 13 9.92 20 15.05 Stone Wool (SWL) 50 0.040 1 2.57 7 3.90 13 5.21 20 6.75
Table 3. Insulation material alternatives for the basement
Material Density (kg/m3) Thermal Conductivity (W/mK) Thickness (cm) Unit Price ($/m2)
Extruded Polystyrene (XPS) 30 0.035
1 1.14
7 5.53
13 9.92
20 15.05
Table 4. Properties of window types
Window Type Conductance (W/m2K) Unit Price ($/m2)
Woodwork, Single Glazing 5.1 46.86
Woodwork, Double Glazing, 6 mm 3.3 51.75
Woodwork, Double Glazing, 9 mm 3.1 53.44
Woodwork, Double Glazing, 12 mm 3.0 55.13
Woodwork, Double Glazing, 16 mm 2.8 57.35
Woodwork, Double Glazing Low E, 6 mm 2.8 58.55
Woodwork, Double Glazing Low E, 9 mm 2.3 59.39
Woodwork, Double Glazing Low E, 12 mm 2.2 60.24
Woodwork, Double Glazing Low E, 16 mm 2.0 61.09
PVC 2o Joint, Single Glazing 5.2 51.78
PVC 2o Joint, Double Glazing, 6 mm 3.4 56.14
PVC 2o Joint, Double Glazing, 9 mm 3.2 57.83
PVC 2o Joint, Double Glazing, 12 mm 3.0 59.52
PVC 2o Joint, Double Glazing, 16 mm 2.9 61.74
PVC 2o Joint, Double Glazing Low E, 6 mm 2.9 60.00
PVC 2o Joint, Double Glazing Low E, 9 mm 2.4 61.04
PVC 2o Joint, Double Glazing Low E, 12 mm 2.3 62.08
PVC 2o Joint, Double Glazing Low E, 16 mm 2.1 63.44
PVC 3o Joint, Single Glazing 5.0 54.35
PVC 3o Joint, Double Glazing, 6 mm 3.2 58.71
PVC 3o Joint, Double Glazing, 9 mm 3.0 60.40
PVC 3o Joint, Double Glazing, 12 mm 2.8 62.09
PVC 3o Joint, Double Glazing, 16 mm 2.7 64.31
PVC 3o Joint, Double Glazing Low E, 6 mm 2.7 62.57
PVC 3o Joint, Double Glazing Low E, 9 mm 2.2 63.61
PVC 3o Joint, Double Glazing Low E, 12 mm 2.1 64.65
WMCAUS 2018
IOP Conf. Series: Materials Science and Engineering 471 (2019) 062009
IOP Publishing doi:10.1088/1757-899X/471/6/062009
5
2.2.2. Constraints. The constraints are the restrictions stated by the corresponding standard, TS 825.
The maximum heating energy that a building can spend per its unit volume is restricted in TS 825. The limiting value changes according to the climate region that the building belongs to. There are four climate regions in Turkey, therefore, the optimization process is repeated for each region.
2.2.3. Objective function. The objective function of this study is to minimize the cost of materials to
be selected in the building envelope. Thus, the aim is to find a material combination with minimum cost in each region satisfying the corresponding standard.
2.3. Energy consumption
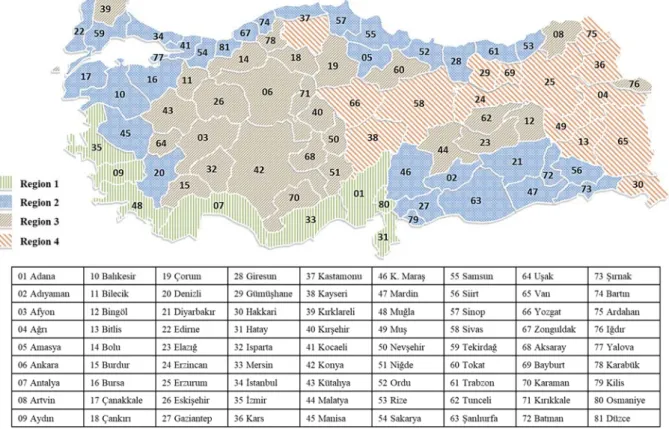
The heating energy consumption of the building is calculated according to TS 825, which is the valid standard in Turkey. The four climate regions stated in TS 825 is shown in Figure 2. As Region 1 represents the hottest cities in Turkey, Region 2 represents the coldest ones.
Figure 2. The four climate regions in Turkey The annual heating energy consumption is calculated as follows:
Qyear = ΣQm (1) Qm = [H.(θin-θout)-η.(ϕin+ϕs)].t (2) Specific heat loss (H) of a building is equal to the sum of heat loss occurred in consequence of conduction and convection (Htr) and heat loss occurred in consequence of ventilation (Hven).
WMCAUS 2018
IOP Conf. Series: Materials Science and Engineering 471 (2019) 062009
IOP Publishing doi:10.1088/1757-899X/471/6/062009
6
Heat loss occurred in consequence of conduction and convection (Htr) is calculated as in the equation below:
Htr = ΣAU = UewAew + UglAgl + UedAed + 0.8 UceAce + 0.5 UflAfl (4) Heat loss that occur in consequence of ventilation (Hven) is calculated as follows:
Hven = 0.264 x na x Vgross (5) where na is the air changing ratio, taken as 0.8 for natural ventilation.
The monthly average interior heat gain (ϕin) is calculated as follows:
ϕin ≤ 5 x An (W) (6) where An is the building usage area, which is calculated as follows:
An = 0.32 x Vgross (7) The monthly average solar energy gain (ϕs) is calculated as follows:
ϕs,j = ∑ 𝑟 . 𝑔 . 𝐼, . 𝐴 , (8) where r is the monthly average shading factor of the transparent surfaces, g is the solar energy permeation factor of the transparent elements and Agl,k is the total glazing area in direction k. In this study, r is taken as 0.8 as the building is detached. Monthly average solar radiation intensity values are shown in Table 5.
Table 5. Monthly average solar radiation intensity values (W/m2) [8]
Janu ary Februa ry Marc h April Ma y
June July Augu
st Sept em ber Octo ber No vem be r December Isouth 72 84 87 90 92 95 93 93 89 82 67 64 Inorth 26 37 52 66 79 83 81 73 57 40 27 22 Ieast/west 43 57 77 90 114 122 118 106 81 59 41 37
Solar energy permeation factor (g) is calculated as follows:
gj = Fw . g┴ (9) where Fw is the correction factor for windows, which is 0.8 and g┴ is the solar energy permeation factor measured under laboratory conditions for the rays striking the surface vertically, taken as 0.75 for colourless glass.
Monthly average usage factor of heat gain is calculated as follows:
η = 1 - e (-1/GLR) (10) where GLR is the gain/loss ratio, which is calculated as follows:
WMCAUS 2018
IOP Conf. Series: Materials Science and Engineering 471 (2019) 062009
IOP Publishing doi:10.1088/1757-899X/471/6/062009
7
GLR = (ϕin + ϕs) / H (θin - θout) (11) Inserting GLR in equation (11), η becomes:
η = 1 - 𝑒(
( )
( ) ) (12)
where θin is the monthly average indoor temperature, considered as 19 oC. Monthly average outdoor temperature values are stated in Table 6. If GLR is equal to or more than 2.5, it is assumed that no heat loss occurs in that month.
Table 6. Monthly average outdoor temperature values (oC) [8]
Region 1 Region 2 Region 3 Region 4
January 8.4 2.9 -0.3 -5.4 February 9.0 4.4 0.1 -4.7 March 11.6 7.3 4.1 0.3 April 15.8 12.8 10.1 7.9 May 21.2 18.0 14.4 12.8 June 26.3 22.5 18.5 17.3 July 28.7 24.9 21.7 21.4 August 27.6 24.3 21.2 21.1 September 23.5 19.9 17.2 16.5 October 18.5 14.1 11.6 10.3 November 13.0 8.5 5.6 3.1 December 9.3 3.8 1.3 -2.8
The limiting annual energy consumption value (Q’) is calculated (in kWh/m3) as follows:
𝑄 = ⎩ ⎪ ⎨ ⎪ ⎧14.1 ∗ 𝐴 / 𝑉 + 3.4, for Region 1 22.4 ∗ 𝐴 / 𝑉 + 7.8, for Region 2 24.4 ∗ 𝐴 / 𝑉 + 11.7, for Region 3 26.5 ∗ 𝐴 / 𝑉 + 16.3, for Region 4 (13)
3. Results and discussions
Optimum material combinations are obtained for each climate region in Turkey (Table 7). It is observed that certain material types have the priorities in certain parts. For example, even though there are three material alternatives to be used on the exterior walls and ceiling, EPS is the selected material on the exterior walls and SWL is chosen as the ceiling insulation material in all regions. The woodwork window types are selected rather than the PVC windows. The costs of the materials are found to be between 25,000-30,000 USD. Moreover, annual energy consumption values are determined to be slightly greater than the limiting annual energy values indicated by TS 825, as expected.
WMCAUS 2018
IOP Conf. Series: Materials Science and Engineering 471 (2019) 062009
IOP Publishing doi:10.1088/1757-899X/471/6/062009
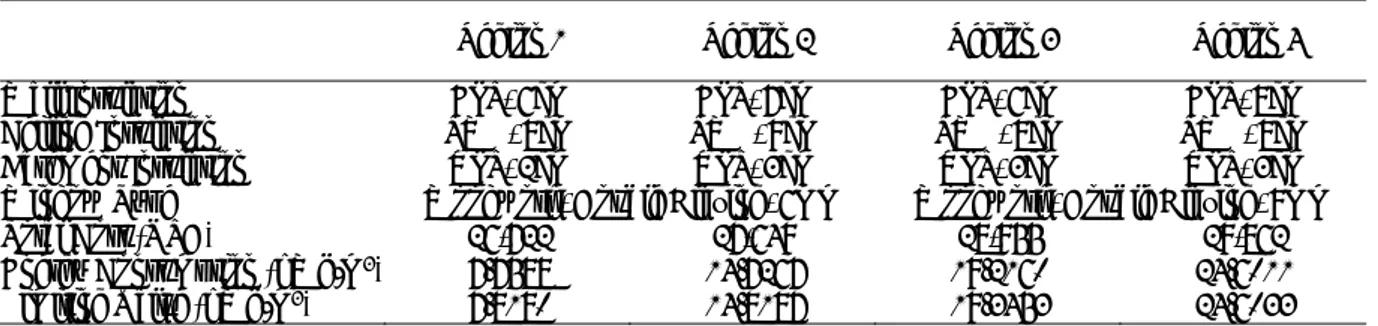
8 Table 7. Optimum material combinations
Region 1 Region 2 Region 3 Region 4
Wall Insulation EPS, 6cm EPS, 7cm EPS, 6cm EPS, 8cm
Ceiling Insulation SWL, 8cm SWL, 9cm SWL, 8cm SWL, 8cm
Basement Insulation XPS, 2cm XPS, 3cm XPS, 3cm XPS, 3cm
Window Type Woodwork, Double Glazing, 6mm Woodwork, Double Glazing, 9mm
Total Cost (USD) 26,722 27,649 28,955 29,862
Energy Consumption (kWh/m3) 7.7588 14.7267 19.2160 24.6011
Limiting Value (kWh/m3) 7.8180 14.8187 19.3453 24.6033
The execution of genetic algorithm is shown in Figure 3. It is noticed that the optimization process terminates roughly at generation 70-80. This is mainly because average relative change of the best value is lower than the tolerance function (10-8).
WMCAUS 2018
IOP Conf. Series: Materials Science and Engineering 471 (2019) 062009
IOP Publishing doi:10.1088/1757-899X/471/6/062009
9 4. Conclusions
It is possible to obtain energy efficiency in residential buildings by optimizing the building envelope. Building envelope design consists of a number of parameters such as window, wall, basement, and ceiling. Selection of these parameters can significantly affect the energy efficiency of buildings. This study aims to optimize the building envelope design of a residential building. For this purpose, genetic algorithm is utilized to detect the optimum design of each building envelope parameter for each climate region in Turkey. The decision variables are chosen as the window type and the insulation materials to be applied on the exterior walls, ceiling, and basement. The properties and costs of the materials are obtained from the unit price list prepared by Republic of Turkey Ministry of Environment and Urbanization. The objective function is determined as the minimization of the total cost of materials. The constraints are the limitations indicated by TS 825. Matlab is utilized to combine the genetic algorithm and heating energy calculation method.
Optimum design solutions are identified among thousands of combinations for each climate region. The optimization approach can be used by the design professionals to determine cheapest building design envelope materials satisfying the restrictions indicated by TS 825. Moreover, this study is expected to encourage professionals to make use of optimization approaches to enhance the effectiveness of design-related decisions. The tendency to utilize optimization tools to solve design problems in Turkey can increase the energy efficiency of buildings, which would contribute to the 2023 national strategy objectives and energy policies.
References
[1] MFA (Republic of Turkey Ministry of Foreign Affairs), “Turkey’s energy profile and strategy,” available at: <http://www.mfa.gov.tr/turkeys-energy-strategy.en.mfa>, 2018.
[2] MENR (Republic of Turkey Ministry of Energy and Natural Resources), “Energy efficiency,” available at: <http://www.enerji.gov.tr/en-US/Pages/Energy-Efficiency >, 2018.
[3] L. G. Caldas and L. K. Norford, “A design optimization tool based on a genetic algorithm,”
Automation in Construction, vol. 11, pp. 173-184, 2002.
[4] L. Magnier and F. Haghighat, “Multiobjective optimization of building design using TRNSYS simulations, genetic algorithm, and Artificial Neural Network,” Building and Environment, vol. 45, pp. 739-746, 2010.
[5] S. M. Bambrook, A. B. Sproul, and D. Jacob, “Design optimisation for a low energy home in Sydney,” Energy and Buildings, vol. 43, pp. 1702-1711, 2011.
[6] D. Gossard, B. Lartigue, and F. Thellier, “Multi-objective optimization of a building envelope for thermal performance using genetic algorithms and artificial neural network,” Energy and
Buildings, vol. 67, pp. 253-260, 2013.
[7] MEU (Republic of Turkey Ministry of Environment and Urbanization), 2018. “Unit price,” available at: <https://birimfiyat.csb.gov.tr/>, 2018.
[8] TS 825, “Thermal insulation requirements for buildings”, Turkish Standard Institution, Ankara, Turkey, 2008.
![Table 5. Monthly average solar radiation intensity values (W/m 2 ) [8]](https://thumb-eu.123doks.com/thumbv2/9libnet/4412552.75261/7.892.112.787.748.892/table-monthly-average-solar-radiation-intensity-values-w.webp)
![Table 6. Monthly average outdoor temperature values ( o C) [8] Region 1 Region 2 Region 3 Region 4](https://thumb-eu.123doks.com/thumbv2/9libnet/4412552.75261/8.892.184.707.420.668/monthly-average-outdoor-temperature-region-region-region-region.webp)