*Corresponding author.
E-mail address: [email protected], (B. Untuç)
Journal of Nuclear Sciences, Vol. 3, No.2, Dec 2016, 27-34 Copyright ©, Ankara University, Institute of Nuclear Sciences ISSN: 2148-7736
Journal of Nuclear Sciences
p-ISSN: 2147-7736, e-ISSN:2148-3981 J o ur na l h om e page: h t tp :/ / j n s . a n k a r a . e d u . t r /
DOI: 10.1501/nuclear_0000000017
MCNP5 Element Library Least Squares Method for On-line Coal Analysis
İ. A. Reyhancan
1, B. Untuç
2*, M. N. Erduran
31Institute of Energy, Istanbul Technical University, 34469, Istanbul 2Physics Department, Istanbul Technical University, 34469, Istanbul 3Computer Engineering, İstanbul Sabahattin Zaim University, 34303, Istanbul
Received 25.02.2016; accepted 02.12.2016 ABSTRACT
One of the current methods for the on-line analysis of the coal is the neutron inelastic scattering and thermal-capture analysis (NITA) for non-destructive in situ measurements of the elemental concentration of a bulk sample. A prototype apparatus (including detector, fast neutron source, bulk sample and shielding materials) was simulated by using MCNP5 (Monte Carlo N-Particle) software package. In the material card of MCNP5, the concentration of these elements of the synthetic coal sample was used by taking into consideration of the rates of the lignite coal reserve in Aegean Region of Turkey. The histograms of the relation between number of particles and energy of the gamma were converted to Gaussian
distribution by using response functions of the BGO detector. With the separate simulation of MgO, Fe2O3,CaO, Al2O3,
SiO2, Sand C, the element library spectrum was obtained in order to fit the spectrum of synthetic coal sample by using
MLR (Multiple Linear Regression) method. By using the relation between the coal sample spectrum and the fitted coal spectrum by MLR, the element library least squares (LLs) method was applied to calculate the elemental contents for the relative coal sample.
Keywords: NITA technique, MCNP5, BGO detector, MLR method.
1. Introduction
Nuclear techniques are widely used for non-destructive in situ measurements of elemental concentration of bulk sample in the mining and energy industries [1]. One of the current analysis methods is the NITA technique which relies on the detection of the gamma rays signatures coming from the neutron inelastic-scattering (NIS) and thermal-capture (TNC) reactions with target material. Usage of the NITA technique makes the detection of the fly ash and Sulfur content possible from TNC, while gamma rays of C and O are produced by NIS [2]. An on-line coal analyzer apparatus included NITA technique can be simulated by using a Monte Carlo computational simulation packages, such as GEANT4 [3,4], MCNP5 [5] and FLUKA [6]. In this paper, the on-
line coal analyzer apparatus (including detector fast neutron source, bulk sample and shielding materials) was simulated by using MCNP5 (Monte Carlo N-Particle) software package for the simulation. [7]. Five synthetic coal samples, representing the lignite coal reserve in Aegean Region of Turkey, were prepared covering the range of concentration of Carbon and ash content. These samples were simulated for the prototype geometry and then the histograms obtained from the simulations were then converted to Gaussian distribution by using BGO detector response functions [8]. In order to calibrate the spectrum of the synthetic coal sample,
MgO, Fe2O3, CaO, Al2O3, SiO2, S and C were simulated
later in the spherical fixed geometry and the spectrum of each element was used to generate the element library spectra.
28
2. MCNP5 simulation of the coal sample
MCNP5 is a powerful general-purpose modeling tool providing continuous-energy, generalized geometry, time-dependent Monte Carlo transport code. It can handle such cases as neutron only, photon only, electron only, combined neutron/photon or photon/electron transport according to characteristics of the problem of interest [9]. The process aimed to simulate the geometry of the prototype apparatus and interaction of the synthetic coal material with fast and slow neutrons,
emitting 109 neutrons as a total number of particles by
using MCNP5. In the simulation, a 14 MeV point source of neutrons which represented a D-T neutron generator of prototype apparatus were generated isotropically just above the sample container, indicated by a red dot in the schematic view of the virtual experimental set up shown in Fig. 1.
Fig.1 The schematic view of the MCNP5 simulation
geometry.
The MCNP5 average cell flux tally (or “F4 tally”) was used to detect the energies of gamma rays between 0 and 10 MeV with 1024 channels in BGO volume. The bulk
material as the combination of MgO, Fe2O3,CaO, Al2O3,
SiO2, S and C weighted 110 kg in the coal sample volume. The concentration of compounds in each set is shown in Table 1. The five synthetic coal samples including different concentration of compounds were simulated by using MCNP5 simulation package.
Table 1. The concentration of the compounds in each coal set.
Additionally, the MCNP simulation of background of prototype apparatus was also performed by using F4 tally
with 109 neutrons as a total number of particles. The
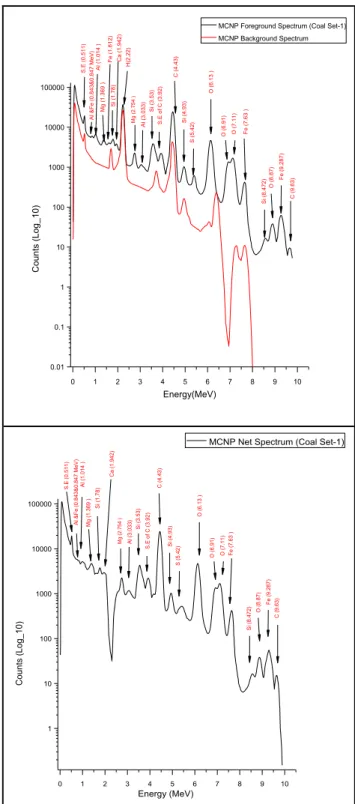
histogram results of the simulations were converted to spectrum by using BGO detector response functions, which are obtained experimentally. For the first coal sample (Set-1), the gamma rays spectrum of MCNP5 simulations is shown in Fig. 2. The upper panel shows foreground and background spectra and the lower panel the net spectrum is shown for the Coal Set-1.
Fig.2 MCNP5 gamma rays spectrum of Coal Set-1.
Neutron Generator Polyethylene Fe Pb BGO detector Coal sample 0 1 2 3 4 5 6 7 8 9 10 1 10 100 1000 10000 100000 Energy (MeV)
MCNP Net Spectrum (Coal Set-1)
Counts (Log_10) C ( 9.6 3) A l & F e ( 0.8 43 & 0.8 47 M eV ) S .E ( 0.5 11 ) A l ( 1.0 14 ) M g ( 1.3 69 ) S i ( 1.7 8) C a ( 1.9 42 ) M g (2. 754 ) C ( 4.4 3) S i ( 4.9 3) S ( 5.4 2) O ( 6.1 3 ) O ( 6.9 1) O ( 7.1 1) F e ( 7.6 3 ) S i ( 3.5 3) S .E o f C ( 3.9 2) F e ( 9.2 87 ) O ( 8.8 7) A l ( 3.0 33 ) S i ( 8.4 72 ) Compound Set 1 (%) Set 2 (%) Set 3 (%) Set 4 (%) Set 5 (%) C 76.00 69.34 62.66 56.00 49.34 SiO2 8.20 10.86 13.60 16.34 19.00 Fe2 O3 3.60 4.6 5.86 7.10 8.22 Al2 O3 3.60 4.94 6.14 7.34 8.62 MgO 1.00 1.26 1.60 1.86 2.20 CaO 3.60 4.94 6.14 7.34 8.62 S 4.00 4.00 4.00 4.00 4.00 0 1 2 3 4 5 6 7 8 9 10 0.01 0.1 1 10 100 1000 10000 100000 C ( 9 .6 3 ) Counts (Log_10) Energy(MeV)
MCNP Foreground Spectrum (Coal Set-1) MCNP Background Spectrum A l & F e ( 0 .8 4 3 & 0 .8 4 7 M e V ) S .E ( 0 .5 1 1 ) A l ( 1 .0 1 4 ) M g ( 1 .3 6 9 ) S i ( 1 .7 8 ) C a ( 1 .9 4 2 ) H (2 .2 2 ) M g (2. 754 ) C ( 4 .4 3 ) S i ( 4 .9 3 ) S ( 5 .4 2 ) O ( 6 .1 3 ) O ( 6 .9 1 ) O ( 7 .1 1 ) F e ( 7 .6 3 ) S i ( 3 .5 3 ) S .E o f C ( 3 .9 2 ) F e ( 9 .2 8 7 ) O ( 8 .8 7 ) A l ( 3 .0 3 3 ) S i ( 8 .4 7 2 ) F e ( 1 .6 1 2 )
29 The comparison of five coal sets of the foreground spectrum is presented in Fig. 3.
Fig.3 Comparison of spectrum of 5 coal sets.
3. Generating of the element library spectrum
Unlike the geometry of prototype apparatus, each of
MgO, Fe2O3, CaO, Al2O3, SiO2, S, and C compounds was
simulated separately in a spherical fixed volume shown in Fig. 4. The point neutron source of 14 MeV was inserted inside the cell#1, which was filled with air medium. The cell#2 was filled with polyethylene material in order to thermalize the neutrons.
Fig.4 The spherical fixed-geometry for elemental library
spectra.
The compounds listed in Table-1 were inserted separately to the cell#3 and whole volume was surrounded with BGO detector material inside the cell#4, and the cell#5 represents the vacuum. For this purpose, the MCNP5 average cell flux tally (or “F4 tally”) was used to obtain library of the single element spectrum. The particle history of the simulation in nps card was entered 108 as the total number of particles of the neutron source. The histograms and spectrums of the MCNP5
simulation of MgO, Fe2O3, CaO, Al2O3, SiO2, S, and C
in the fixed spherical geometry are shown in Figs 5 to 11.
Fig.5 MCNP5 Histogram and spectrum of Al2O3
compound. 0 1 2 3 4 5 6 7 8 9 10 10 100 1000 10000 100000 Counts (Log_10) Energy (MeV)
MCNP Spectrum (Coal Set-1) MCNP Spectrum (Coal Set-2) MCNP Spectrum (Coal Set-3) MCNP Spectrum (Coal Set-4) MCNP Spectrum (Coal Set-5)
Al &F e (0.843 & 0. 84 7) S. E (0.51 1 ) Al (1.014 ) Mg (1.369 ) Si (1.78) Ca (1. 94 2) H (2.22 ) Mg (2.754 ) C (4.43) Si & C (4.93 & 4.94) S (5.42 ) O (6.13 ) O (6.91 ) O (7.11 ) Fe (7.63 ) Si (3.53) S. E of C (3.92) Fe (9.28 7) O (8.87 ) Al (3.033 ) Si (8.472 ) Fe (1.61 2) C (9.63) 0 1 2 3 4 5 6 7 8 9 10 1000 10000 100000 1000000 Number of Parti cl es Energy (MeV) MCNP (Al 2O3 Histogram) 0 1 2 3 4 5 6 7 8 9 10 1000 10000 100000 1000000 Energy (MeV) Counts (Log_10) MCNP (Al 2O3 Spectrum) Al (7. 724) O ( 6.13) C ( 4.43) H ( 2.22) Al (3. 033) S.E of H ( 2.22) Al (1. 014) Al (0. 843) S.E (0.511) M g (2. 754) O ( 7.1) O ( 6.9) S.E of 6. 13 C ( 3.683) S.E of 4.43 Al (1.342 ) Al (2.59) Al (3. 465) Al (4. 133 & 4.259) Al (4. 69 & 4.733) Al (5. 41) Al (5. 134) O ( 8.87) 1 2 3 4 5
30 Fig.6 MCNP5 Histogram and spectrum of CaO
compound. Fig.7 MCNP5 Histogram and spectrum of Fe2O3.
1 2 3 4 5 6 7 8 9 10 100 1000 10000 100000 Counts (Log_10) Energy (MeV) MCNP(CaO Histogram) 0 1 2 3 4 5 6 7 8 9 10 100 1000 10000 100000 Energy (MeV) MCNP (CaO Spectrum) Counts (Log_10) C (4 .4 3 ) Ca (6 .4 2 ) O (6 .1 3 ) O (6 .9 ) O (7 .1 ) C (4 .9 4 ) S.E o f 6 .1 3 S.E o f 4 .4 3 H (2 .2 2 ) S.E (0 .5 1 1 ) Ca (1 .9 4 2 ) Ca (2 .5 7 4 ) Ca (2 .7 6 7 ) Ca (1 .3 8 9 ) Ca (3 .7 5 9 ) Ca (0 .7 2 7 ) Ca (1 .5 8 2 & 1 .6 7 ) Ca (3 .3 5 ) Ca (3 .0 8 4 ) Ca (5 .3 1 ) Ca (4 .1 8 5 ) O (8 .8 7 ) Ca (0 .8 7 8 ) Ca (1 .1 5 ) Ca (1 .0 3 9 ) 0 1 2 3 4 5 6 7 8 9 10 1000 10000 100000 1000000 Counts (Log_10) Energy(MeV) MCNP (Fe2O3 Histogram) 0 1 2 3 4 5 6 7 8 9 10 1000 10000 100000 Energy (MeV) Counts (Log_10) MCNP (Fe 2O3 Spectrum) F e (7. 63 & 7.64) O ( 6.9) O (7.1) O ( 6.13) C ( 4.43) C ( 4.94) H ( 2.22) S.E (0. 511 ) S.E of 4.43 D.E (1.022) F e (0. 847) F e (2. 721) F e (5. 92 & 6.018) S.E of 5.92 &6.018 Fe (4.21 8) F e (1. 612) C ( 3.68) F e (3. 436) Fe (3.26 7) F e (2. 52) Fe (1. 725 ) F e (1. 26) O & F e (8. 87 & 8.886 ) S.E of 8.87 & 8. 886 F e (9. 297)
31
Fig.8 MCNP5 Histogram and spectrum of SiO2
compound.
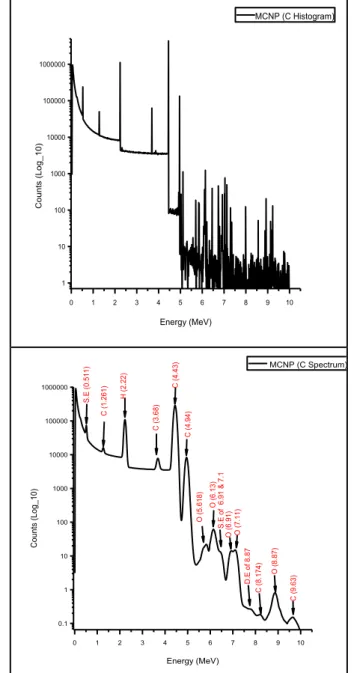
Fig.9 MCNP5 Histogram and spectrum of the Carbon
element. 0 1 2 3 4 5 6 7 8 9 10 1000 10000 100000 1000000 Counts (Log_10) Energy (MeV) MCNP(SiO 2 Histogram) 0 1 2 3 4 5 6 7 8 9 10 1000 10000 100000 S.E of 2.22 Counts (Log_10) Energy (MeV) O ( 7.1) O ( 6.9) MCNP (SiO2 Spectrum) H ( 2.22) Si (1. 78) Si 1. 273 S.E (0.511) Si & C ( 4.94) Si (3. 53) C ( 4.43) O ( 6.13) Si (2. 425) Si (6. 379) Si (5. 634) Si (7. 99) Si (8. 472) O & Si (8. 87 & 8.89) C ( 3.683) S .E of 3.53 S. E of 3.683 S.E of 4.43 Al (0. 98) A l (4 .133 ) Al (2. 754) 0 1 2 3 4 5 6 7 8 9 10 1 10 100 1000 10000 100000 1000000 Counts (Log_10) Energy (MeV) MCNP (C Histogram) 0 1 2 3 4 5 6 7 8 9 10 0.1 1 10 100 1000 10000 100000 1000000 S.E of 6. 91 & 7.1 D .E of 8.87 Energy (MeV) Counts (Log_10) MCNP (C Spectrum) S.E (0.511) C ( 1.261) H ( 2.22) C ( 3.68) C ( 4.43) C ( 4.94) O ( 6.13) O ( 5.618) O ( 6.91) O ( 7.11) C ( 8.174) O ( 8.87) C ( 9.63)
Table 2. The regression variables of compounds and regression coefficients of each coal set in MLR.
Variable Set 1 Set 2 Set 3 Set 4 Set 5
a1 (SiO2) 31.67304 34.4954 39.61692 54.20798 59.30413 a2 (Al2O3) 38.30900 69.55653 96.52681 161.82605 188.75622 a3 (CaO) 71.79926 74.14684 76.65868 79.76044 82.58825 a4 (C) 11.92658 3.28514 -1.18583 -8.81317 -12.83898 a5 (Fe2O3) -25.27001 -19.3327 -16.53293 -15.21516 -13.21699 a6 (MgO) 19.23565 27.67508 35.54155 54.98948 62.67590 a7 (S) -119.463 0.990594 -134.307 -159.5405 -2345026 -261.06018 Regression Coefficient 0.995270 0.996983 0.997562 0.998977
32 Fig.10 MCNP5 Histogram and spectrum of MgO
compound.
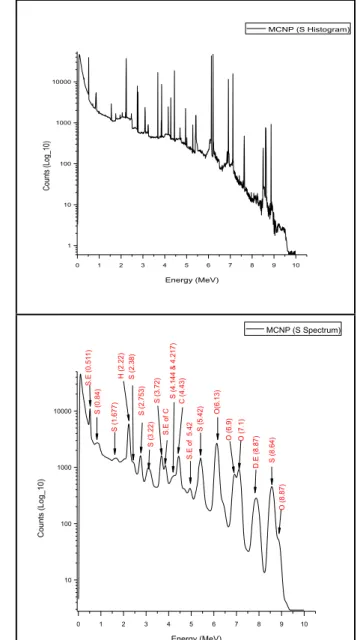
Fig.11 MCNP5 Histogram and spectrum of S element.
0 1 2 3 4 5 6 7 8 9 10 10 100 1000 10000 Counts (Log_10) Energy (MeV) MCNP (MgO Histogram) 0 1 2 3 4 5 6 7 8 9 10 1000 10000 100000 1000000 Energy (MeV) MCNP (MgO Spectrum) O (7.1) Counts (Log_10) S. E (0.51 1) C (4.43) C (4.94) O (6.13 ) O (6.9) H (2.22) Mg (3.83) Mg (1.369 ) Mg (2.754 ) Mg (3.3 & 3.4) Mg (1 .129 ) Mg (0.974 ) Mg (4.22) C (3.68) Mg (5.452 ) Mg (1.808 ) Mg (2.828 ) O (8.87 ) Mg (2.541 ) S. E of H (1.91) 0 1 2 3 4 5 6 7 8 9 10 1 10 100 1000 10000 Counts (Log_10) Energy (MeV) MCNP (S Histogram) 0 1 2 3 4 5 6 7 8 9 10 10 100 1000 10000 O ( 8.87) Energy (MeV) Counts (Log_10) MCNP (S Spectrum) H ( 2.22) S (5. 42) O(6.13) O ( 6.9) O ( 7.1) S.E (0.511) S.E of 5. 42 C ( 4.43) S.E of C S (2. 753) S (2. 38) S (8. 64) D .E (8.87) S (3. 22) S (3. 72) S (0. 84) S (4. 144 & 4.217) S (1. 677)
Table 3. The comparison of the concentration of elemental contents between prepared and calculated values for each coal set.
Net Coal Spectrum Set-1
Net Coal Spectrum Set-2
Net Coal Spectrum Set-3
Net Coal Spectrum Set-4
Net Coal Spectrum Set-5 Compound Prepared (%) Calculated (%) Prepared (%) Calculated (%) Prepared (%) Calculated (%) Prepared (%) Calculated (%) Prepared (%) Calculated (%) SiO2 8.20 8.07 10.86 10.77 13.60 13.75 16.34 16.44 19.00 19.02 Al2O3 3.60 3.56 4.94 4.87 6.14 6.22 7.34 7.40 8.62 8.61 CaO 3.60 3.56 4.94 4.87 6.14 6.23 7.34 7.40 8.62 8.61 C 76.0 75.98 69.34 69.26 62.66 62.72 56.0 56.05 49.34 49.34 Fe2O3 3.60 3.51 4.66 4.63 5.86 5.91 7.10 7.10 8.22 8.21 MgO 1.00 0.93 1.26 1.25 1.60 1.61 1.86 1.87 2.20 2.20 S 4.00 3.99 4.00 3.98 4.00 4.02 4.00 4.05 4.00 3.98 Total 100.00 99.60 100.00 99.63 100.00 100.46 100.00 100.31 100.00 99.97
33 Each one of the spectra for the chemical compounds was used to obtain the element library by utilizing Multiple Linear Regression (MLR) method. MLR is a very useful mathematical method to represent any unknown coal spectrum as the sum of relative elemental contents. Mathematical formulation of the MLR was given below in Eq. 1,
yi= yfi− ybi= ∑nj=1aijxj, i = 1, 2, 3 … 1024 (1)
where the parameter yfi is the count rate on ith channel for
the foreground spectrum of the unknown coal sample, ybi
is the background spectrum belonging to prototype
apparatus, aij is the count rate of the net spectrum at the
ith channel for the relative element library in the
spherical geometry for jth element, x
j is the relative
content of jth element. The net spectrum, y
i was obtained
by subtracting the background spectrum ybi from the
foreground spectrum yfi as shown in Fig.2. After having
applied the MLR method on the net coal spectrum yi, the
MLR and Coal Set-1 spectra were shown in Fig.12. The regression coefficients obtained from MLR and the regression variables of compounds of each coal set were shown in Table 2.
Fig.12 Comparison the MCNP5 Spectrum of Coal Set-1
with Coal Set-1 spectrum obtained from MLR method.
Since the desirable correlation between the net spectrum and the combination of element library is reached, the concentrations of the elemental contents for the related coal sample can now be calculated by using library least squares (LLs) method as given by Eq. 2.
𝑀 = ∑ (𝑦𝑖− ∑𝑛𝑘=1𝑎𝑖𝑘𝑥𝑗)
2 1024
𝑖=1 (2)
where M is the most probable value for elemental contents of the given related net coal spectrum.
By assuming the 𝑎𝑖𝑗 is constant, the partial derivative of
the term of M with respect to the elemental contents
shown by xj is set to zero given by Eq. 3 [10].
𝜕𝑀 𝜕𝑥𝑗 = ∑ (𝑦𝑖− ∑ 𝑎𝑖𝑗𝑥𝑗 𝑛 𝑘=1 ) 1024 𝑖=1 𝑎𝑖𝑗= 0 (3)
The matrix form of the Eq. 3 was shown in Eq. 4. In order to calculate the concentrations of elemental contents, the Eq. 5 was solved for X.
𝐴𝑇𝑌 − (𝐴𝑇𝐴)𝑋 = 0 (4)
𝑋 = (𝐴𝑇𝐴)−1𝐴𝑇𝑌 (5)
where X is matrix the elemental contents of the coal spectrum, A is the matrix of the combination of the single element library obtained from MCNP simulation, Y is
the matrix of the related net coal spectrum, 𝐀𝐓 is the
transpose matrix of A, (𝐀𝐓𝐀)−1is the inverse matrix of
the multiplication of 𝑨𝑻 and A. By using Eq. 5, the X
matrix was calculated for each coal spectrum, and the results showing good agreement between prepared elemental contents and calculated values are given in Table 3. It should be noted that the deviations are less than 0.5% from the prepared values of the elemental contents.
4. Results and conclusion
The prototype set-up was designed for detecting the content of elements in coal sample by using the NITA technique. The simulation results of coal sample sets were consistent with Carbon, Sulfur and ash contents in Table 1. From coal sample set 1 to set 5 respectively, the photo peak level of neutron induced gamma energy representing the carbon content was decreased, whereas gamma energies of elements of Ca, Fe, Si, Al, Mg in ash content were observed to increase. According to the simulation of the coal spectrum, gammas can be detected easily due to high reaction cross section at these gamma energies; C (4.43 MeV), O (6.13 MeV), Fe (7.63 MeV), Si (3.53 MeV), Ca (1.942 MeV), Al (1.014 MeV), Mg (1.369 MeV), S (5.42 MeV), H (2.22 MeV). Some of the elements such as S (0.84 MeV), Al (0.843 MeV) and Fe (0.847 MeV) which gamma energies are close to each other cannot be detected due to the low resolution of the BGO detector.
The correlation factor between the MLR and the coal sample spectrum was found greater than 0.99 for each coal sample. This result shows that the simulation of coal sample is consistent with the simulation of the elemental library. Since desirably good correlation is reached, this can allow us to calculate the element contents of any coal sample by using library least squares (LLs) method. According to Table 3, after using the LLs method, the calculated value of the concentration of elements was
0 1 2 3 4 5 6 7 8 9 10 1 10 100 1000 10000 100000 Counts (Log_10) Energy (MeV)
MCNP MLR Spectrum (Coal Set-1) MCNP Spectrum (Coal Set-1)
C (9 .6 3) A l & Fe (0 .8 43 & 0.8 47 M eV ) S .E (0 .5 11 ) A l ( 1.0 14 ) M g ( 1.3 69 ) S i ( 1.7 8) Ca (1 .9 42 ) M g (2. 754 ) C (4 .4 3) S i ( 4.9 3) S (5 .4 2) O (6 .1 3 ) O (6 .9 1) O (7 .1 1) Fe (7 .6 3 ) S i ( 3.5 3) S .E o f C (3 .9 2) Fe (9 .2 87 ) O (8 .8 7) A l ( 3.0 33 ) S i ( 8.4 72 ) Fe (1 .6 12 )
34 found in excellent agreement with the prepared value of the concentration of the elements.
We will consider other elements and multi-elemental measurements in the following-up studies. Further investigations must be performed to obtain elemental library of experimental spectra to determine the element contents.
Acknowledgment
This research was performed at Istanbul Technical University by TUBITAK grant 113M034 and I.T.U Scientific Research Projects Unit grant 38201.
The authors gratefully acknowledge permission for using both services and facilities of the National Center for High Performance Computing at Istanbul Technical University (grant 4003192014).
References
[1] C. S. Lim “Recent development in neutron-induced gamma activation for on line multi-elemental analysis in industry”, J. Radioanal. Nucl. Chem. 262 (2) 525-532 (2004)
[2] C. S. Lim, B. D. Sowerby “ On-line bulk elemental analysis in the resource industries using neutron-gamma techniques.”, J. Radioanal. Nucl. Chem. 264 (1) 15-19 (2005).
[3] Agostinelli S. et al “Geant4 a simulation toolkit” Nucl. Instrum. Methods Phys. Res. A (506) 250-303 (2003).
[4] Allison J. et al "Geant4 developments and applications", IEEE Trans. Nucl. Sci. 53 (1) 270-278 (2006).
[5] Breismeister J.F. “MCNP: a General Monte Carlo N-Particle Transport Code, Version 4B”, LA-12625-M. Los Alamos National Lab., New Mexico (1997). [6] Fasso A., Ferrari A., Ranft J. and Sala P. R. FLUKA:
a Multi-Particle Transport Code, CERN 2005-10, INFN/TC_05/11, SLAC-R-773 (2005).
[7] Curtis A. Palmer, Ertem Tuncalı, Kristen O. Dennen,Timothy C. Coburn, Robert B. Finkelman, “Characterization of Turkish coals: a nationwide perspective”, Int. J. Coal Geol. 60 85–115 (2004). [8] H. Vincke, E. Gschwendtner, C.W. Fabjan, T. Otto,
“Response of a BGO detector to photon and neutron sources: simulations and measurements”, Nucl. Instrum. Methods Phys. Res. Sect. A (484) 102–110 (2002).
[9] J. K. Shultis, R. E. Faw “An MNCP Primer ” Dept. of Mechanical and Nuclear Engineering Kansas State University Manhattan, (2011).
[10] W. HuiDong, L. JingBin, L. YuPing, Y. Dong, M. KeYan, Y. Kang, L. YuMin, C. DaoWen, “An experiment-library least-squares method on on-line coal element contents analysis”, Sci. China Inf. Sci, Vol.55 No.11: 2062–2069, (2012).