•
Volume 18, Number 2, pp. 299-318. 2007Copyright © 2007 anatolla Prlnted in Turkay. AII rlgt,ts raserved
1303-2917 /07 $20.00 + 0.00
Rankings of Tourism and Hospitality
Departments: A Case of Turkey
NAZMI KOZAK Anadolu Unlverslty
School ofTourlsm and Hospltallty Management
Yunus Emre Campus
26470 Eskişehir Turkey E-mall: [email protected] ABSTRACT METiN KOZAK Mugla Universlty School ofTourlsm and Hospltallty
Management Kötekli Campus 48170 Mugla Turkey E-mall: M.Kozak@ıuperonllne.com MUZAFFER UYSAL College of Hospltallty, Retall and Sport Management Unlverslty ol South Carollna Carollna Collseum, Room 1010 CI Columbla, SC 29201
USA E-mall: [email protected]
Although there has been a long tradltlon of ranklng departments on the basls of research productlvlty, thls phenomenon Is relatlvely new in tourlsm research. Thls paper develops a conceptuallzed ranklng scheme of academlc programs whlch was tested through followlng a flve-step ranklng approach and uslng both objectlve and subjectlve measures. The study flndlngs lndlcate that some departments drlft away from the league table whlle the posltlon of top departments does not really change from one approach to another. The study flndlngs also support the proposltlon that there Isa strong consistency between reputatlon rank-lngs of the quallty of departments and thelr overall ranklng. Oesplte the general slmilarlty in the reputatlon and cumulatlve welghted rankings, there Is noteworthy dlscrepancy that some departments rate much hlgher in the reputatlon ranklng than in the objective ranking. Some other departments recelve a lower perceived ranking than they recelve from objectlve measures. The paper suggests both theoretlcaı and practlcal lmpllcatlons.
Key words: quallty assessment, ranklng, performance measurement, tourlsm departmants.
Na;ım/ Kozak Is Assoclate Professor in the School ol Tourlsm and Hospltality Management, Anadolu Unlverslty, Turkay. He holds a Masters dagree in Tourlsm !rom Hacettepe Unlverslty, Turkey anda PhD in Tourlsm from Dokuz Eylul Unlverslty, Turkey. He has numerous publlcatlons about tourlsm educatlon, tourlım and hospltallty mar-keting and evaluatlon ol Journals. His llalds of lnterests lnclude tourlsm management, tourlsm and hospltallty marketing, tourlsm educatlon, and tourism Journals.
Metin Kozak Is Assoclata Prolesıor in the School ol Tourlsm and Hotel Management, Mugla Unlvarslty, Turkey. He obtalned his Master's degree in Tourlsm !rom Dokuz Eylul Unlvarslty, Turkey and a Ph.D. in Tourtsm !rom Shellleld Hallam Unlverslty, UK. He Is tha author of saveral books and has wldely publlshed in sevaral tourlsm and hospltallty Journals. His main resaarch lnterests focus on consumer behavlor, benchmarklng, parformance measurement, destlnatlon competltlveness, and Madltarranaan tourlsm.
Muzaffer Uysa/ Is a Profassor and Asıoclate Dean in the College of Hospltallty, Ratall and Sport Management, the Unlverslty of South Carollna, USA. Dr. Uysal Is a mambar of tha lnternational Academy for the Study of Tour-lsm, the Academy ol Lelsura Sclancas, and sarvas as co-edltor of Tourlsm Analysls: An lnterdlsclpllnary Journal. in addltlon, ha slts on the edltorlal boards of elght Journals. His current research lntarasts canlar on tourlım damand/supply lntaractlon, tourlsm development and marketing, and lntarnatlonal tourlsm.
INTRODUCTION
Over the past several decades, particularly in westem countries, there has been a growing interest in ranking departments, colleges and universities (Hix 2004; Federkeil 2002; Meredith 2004; Laband 1985; Scott and Mitias 1996; Davis and Papanek 1984; Smyth 1992; Dusarsky and Vernon 1998). Generally speaking, it appears that rankings and league tables of academic institutions are becom-ing one of the key information and useful instruments tools to evaluate the performance of universities, public and private funding agencies, students and faculty (Hix 2004; Federkeil 2002). The purpose of such a process is to provide orientation for specific target groups who may have an intention of being enrolled ata university. This includes those students with higher scores who apply primarily to more highly ranked universities or departments. Such a process alsa might be of help for heads of departments or university executives to examine their strengths and weaknesses to remain more com-petitive (Federkeil 2002). Therefore, ranking undergraduate and graduate programs appears to be an influential factor in the decision of a variety of interested parties, including business schools and university administrations (Dichev 1999).
Specifically in the !ast two decades, quality assessment has become one of the most prominent issues in the discussion of higher education, both in terms of science and higher education policy (Federkeil 2002). However, college rank-ing is nota new phenomenon. As early as 1870, annual reports by the United States Bureau of Education (USBE) rank ordered universities based on sta-tistical information. Raymond Hughes published "A Study of the Graduate Schools of America", the first college rankings, based ona school's reputation among others in the field (Meredith 2004). As a result, these early studies helped ta develop a niche for independently ranking modelsin sources like the Chronicle of Higher Education, and later the U.S. News and World Report (USNWR). The report of the Commissioner of Education for the Year 1886-87 lamented the shoddy reporting practices of many colleges for women on the subject of whether they possessed the authority ta grant degrees, the number of degrees they awarded each year, and the size of their college-level (Webster 1984). Afterwards, academic quality ranking existed in 1911, the USBE strati-fied hundreds of American colleges and universities into five levels, accord-ing ta the degree of their presumed quality (Webster 1984).
As noted by Meredith (2004), the combination of declining applicant pools, rising costs, andan increased premium for attending an elite school all may have contributed to the explosion of college rankings in the 1980s. in addi-tion to graduate departments, rankings of professional schools of educaaddi-tion, law, medicine as well as undergraduate programs began ta be published in that period. The audience for these rankings alsa changed. The latter stud-ies gained attentions from administrations, applicants, and researchers. The USNWR college rankings began in 1983, strictly asa survey carried aut by schools' presidents ta keep their reputations. The best colleges' issue of US-NWR, where the undergraduate college rankings are first published, is one
300 •
Anatolia: An lntemational Journal of Tourism and Hospitality Researchof their highest circulating issues of the year. This issue's profitability has led other national publications, like Business Week, to publish their own ranking of undergraduate institutions and business schools, respectively. The current USNWR college rankings can be viewed worldwide via the Internet.
Tourism Education in Turkey
Generally speaking, the higher education system in Turkey is not as large as it is in developed countries and relies heavily on state support. As of 2007, there were 115 universities {85 public and 30 private). Over the last three dec-ades, the state has involved in the process of launching public universities at the three mainstream periods. In 1982, eight new universities were opened. This number increased up to 22 in 1992. The establishment of another new 25 public universities recently has led to the discussion that the quality of higher education system is not optimistic as in its quantity. It is alsa possible to ob-serve a similar trend in the number of private universities particularly over the past decade. Since the mid-1990s, there has been an increasing demand to support the establishment of private universities in the context of student consumerism, which leads to a rapid development of mass higher education in the country. The proportion of private universities in the total system is expected to grow rapidly in the near future. As a consequence of this, com-petition among universities has begun to increase slightly, but this process is relatively much smaller than the western countries.
In a specific reference to the background of tourism education in Turkey, its history at the university level dates back to the mid-1960s when the first un-dergraduate tourism department was opened in 1966. Commencing from the 1970s, the number of these departments have begun to be growing. Three de-partments were opened up in that decade, namely Adnan Menderes, Balikesir and Mersin, all are close to the coast. When the calendar knocked the 1980s, university authorities paid particular attention to launching new departments in order to meet the increasing demand of the industry for hiring well-quali-fied employees and attracting a greater proportion of inbound tourism. This period alsa coincides with the beginning of tourism development in the
coun-try when the govemment encouraged the private sector to invest more into
this business. With the liberalization of the national economy and imposing laws and regulations from the mid-1980s onwards, private universities have been provoked. Following a period of expansion in student numbers, the !ast decade has witnessed an increase in supply of tourism departments both at public and private universities. As of 2005, when this study was completed, our records indicated a total of 27 undergraduate four-year departments all over the country (18 public and 9 private), of which 19 had Masters or PhD programs. Although the geographical distribution of these departments ap-pears to be scattered around the country, Istanbul, Ankara and Izmir are the dominating three cities in this respect.
Despite this growing number of departments both at the national and inter-national level, and alsa a great deal of methodology have been developed and
applied far many academic institutions such as economics, political sciences, business management, physics and so farth, to the authors' best knowledge, no such global or objective method exists in tourism research. Thus, this study aims to fill the gap by proposing and implementing an alternative method far ranking departments in this field. The methodology of this proposed study is based on the data gained from each department and through carrying aut surveys among faculty and industry executives. The study offers as assess-ment of strengths and weaknesses of the approaches and analyze the extent to which the results are correlated. Although this study appears to be both country and subject specific, the style of its design warrants applying asimi-lar pattem of studies not only in one country but alsa in many countries from a broader spectrum. Being not limited only ta tourism, a similar approach would alsa be the case to expand the context into other disciplines. To this end, the next section reviews the existing methods used in other fields espe-cially in economics and political sciences. The third section proposes and jus-tifies an altemative method. The final two sections present the discussion of findings as well as their theoretical and practical implications.
LITERATURE REVIEW
The ranking of universities or specific departments has been in operation in some countries far many years although it has attracted little attention in other countries (Meredith 2004; Smyth 1992; Laband 1985; Hogan 1984; Duvansky and Vemon 1998; Scott and Mitias 1996). Table 1 provides an overview of past reported ranking studies, which are primarily concentrated in the Westem countries such as US in terms of the distribution of countries. Similarly, the di-versity of disciplines has been rather limited; economics and political sciences are the pioneer disciplines taking place in such studies. Each of these studies has diversity in terms of the methodology applied. For example, Filinov and Ruchkina (2002) provide a summary list of the major three ranking models that have been mostly applied in the field: 1) media model (assessment is done by an extemal organization such as media), 2) association model (as-sessment is done by an external organization responsible far accreditation), and 3) governmental model (assessment is done by a body responsible far educational activity in the country). Taking into account all these sub-catego-ries under the practical point of view, the literature alsa suggests the academic perspective as an additional approach.
The academic approach often relies on the observation of departments on the hasis of their overall perfarmance over a lasting period of time. Scott and Mi-tias (1996) have ranked economics departments based on their productivity about doing publications. They have compiled aggregate pages and sepa-rately based on average pages per faculty member over a 10-year period. As proposed by Conroy and Dusarsky (1985), a selective yet objective measure-ment criterion is impact-adjusted equal-appointmeasure-ment pages in core journals. in fallowing years, Dusarsky and Vemon (1998) have updated these rankings to advance the research, using the same methodology. This approach begins
302 •
Anatolia: An lntemational Journal of Tourism and Hospitality ResearchTab/e 1. An overview of east rankin~ studies
No Authors Criteria Specific criteria/on Field Country
Laband (1985) Research performance Number of citations per article
Number of articles and citations Economics Canada per graduate
2 Scott and Research performance Number of article pages Economics USA
Mitias (1998) per faculty
3 Davis and Research perforrnance Number of citations Economics USA
Papanek (1984) per faculty
4 Hogan (1984) Research performance Number of article pages Economics USA per faculty
5 Smy1h (1992) Research performance Authorship of conference Economics USA papers
8 Dusarsky and Research perforrnance Number of article Economics USA
Vernon ( 1998) pages per faculty
7 Feng, Lu and Efficiency of research Number of faculty
Bi (2004) and development Number of publications General China and awards
8 Kentet al. Schoolperforrnance Perceived performance and Tourism and
(1993) prestige Hospitality USA
9 Sinha and Research perforrnance Number of citations Economics Australia
Macri (2002) Perceptions of joumal quality
10 Hix (2004) Research perforrnance Number and impact of Politicaı Global
publications sciences
11 Miller, Tien and Research performance Number of articles Political sciencesUSA
Peebler (1998) lmpact of citations
by counting the pages of articles published in eight blue ribbon journals. Davis and Papanek (1984) have examined the faculty publication record in a set of 24 'top' joumals. Separate rankings are cakulated for total and per capita contributions, and credit is accorded to the institution at which the author is employed at the time of publication. Hogan (1984) has compiled data on the volume of journal publications during the period of 1970-79 for those institutions offering graduate degrees in economics. Laband (1985) have re-ported detailed information with respect to the publishing performance of PhD students studying economics for the period of 1975-84. Moreover, Sinha and Macri (2002) have examined the research output of 27 teaching econom-ics departrnents fora 13-year period. The ranking procedure is based on two different journal ranking criteria: citations and perceptions of journal quality. in the field of tourism and hospitality ranking, to the authors' best knowl-edge, the study by Kent et al. (1993) could be the first in its category to be known. Kent et al. (1993) have followed the principle of collecting the primary data directly from faculty. Faculty members or educators were asked to com-plete a questionnaire about their own programs depending on various
subjec-tive measures: age and size of programs, size of institution, areas of speciali-zation offered, size and publishing activity of faculty, amount of endowment, and quality of departmental facilities. The respondents were asked to list the top ten undergraduate programs, the top five master's programs, and the top three PhD programs, based on the list of same variables. Alsa, from a practi-cal point of view, the industry executives were encouraged to participate in the survey. This category of respondents was simply asked to rank a similar category of departments on the following combined criteria: academic excel-lence, ability to produce effective hospitality executives and consultants, and ability to produce top leaders in the industry. As seen, the latter part relies on fallowing the line of subjective indicators.
From a practical perspective, in the US, the National Research Council (NRC) conducted the latest National Survey of Graduate Faculty in 1993, mailing surveys to random samples of key faculty from lists supplied by dean's offices in each of the 41 disciplines to be ranked. Each respondent was asked to assess 50 graduate programs in the respondent's field, with these programs selected at random from a master list of those departments granting doctoral degrees.
In these surveys, respondents were not assured of being able to assess a pro-gram that they especially liked -whether their own department or another. While the undergraduate rankings typically garner the most publicity, the study alsa ranks the 12 major graduate disciplines with the largest enroll-ments in doctoral programs, including economics. in a similar vein, rankings and league tables are produced annually in the UK by the leading "quality" newspapers using statistical data in universities and colleges published each year. Bowden (2000) reviewed a number of both national and intemational university league tables published in the UK in 1998, facusing in particular on those from The Times, Sunday Times, and Financial Times. The results of these tables are compared and same methodological objections are raised. The degree to which these league tables are useful to prospective students is considered together with their likely future development.
Again in Europe, the Center far Higher Education Development began to rank higher education institutions, after a two-year period of preparation in 1998, in co-operation with the Shiftung Watest, a national faundation far testing goods and servicesin Germany. Since 1999, the ranking has been published in co-operation with Der Stem, the weekly news magazine. Far decades, the German higher education system cultivated the myth that all German uni-versities were of equal quality. Only ln 1989 did the weekly news journal Der Spiegel ask: "Which university is the best? (Federkeil 2002). In Poland, Per-spektywy is a major professional educational organization providing rank-ings and elaborating league tables of higher education institutions. One may note that the 1990s was a period in which the country gained momentum in supporting the rapid development of private education (Siwinski 2002). The evaluation procedure is based on prestige, scientific capacity and study con-ditions of by collecting the data from exogenous sources through a question-naire survey. These features are measured by making use of 16 specific crite-ria. The organization aims to repeat the ranking every year.
Moving into the eastern part of the world, a three-tier indicator system is es-tablished far the evaluation of comprehensive strength of universities in Chi-na, in which the research and development input and research and develop-ment output are considered together (Feng, Lu and Bi 2004). The research and development input ofa university is measured by its personnel structure and research and development expense. The research and development output is usually measured by the number of published papers, number of research and applied projects. Moreover, patents and identified research and develop-ment projects are alsa important far the assessdevelop-ment of the research and devel-opment standing ofa university. The universities being measured represent 29 universities which are affiliated with the National Education Ministry of China and the data were selected from the Chinese Higher Educational Statistical Data. in Japan, based on social demand far university reform and evaluation, several agencies in the 1990s introduced new types of university ranking, e.g. Asabi Shimbun, Recruit ltd, Diamond, and Kawaii-juku Asabi Shimbun led ta the establishment of Daigaku (University) ranking which uses three parameters: education, research and contribution ta the society. Since then, a similar range of rankings has become an annual tradition in the coun-try. The purpose of Daigaku Ranking is ta provide broader information about Japanese universities far students who will take entrance exams.
Ta summarize, the ranking studies conducted by professional ar media or-ganizations are often in an attempt ta continuously update the information that the potential applicants have about the quality of departments_ In this context, as noted above, it has become a tradition ta provide a supplement in-dicating the ranking of British universities by fields. The criticism relies on the view that such reputational rankings may not reflect the best criteria far judg-ing the quality of various departments rated (Miller, Tien and Peebler 1996). Therefore, more objective measures should be used as alternatives ta reputa-tional surveys. Among these include the number of publications and impact of citations. in such a case, several studies have followed the method which weights the number of publications by the total ar per faculty (e.g. David and Papanek 1984; Scott and Mitias 1996), the extent ta which the journal is prestigious (e.g. Dusansky and Vernon 1998), and reporting information on the number of citations that those publications received (e.g. Miller, Tien and Peebler 1996; Sinha and Macri 2002). The purpose is ta measure the credibil-ity of publications and their potential benefits of expanding the research and development efforts of researchers.
Rankings Models Used in the World
An extensive review of the related literature suggests that the ranking of aca-demic institutions in the world has been assessed according ta different meth-odologies and techniques (Webster 1984). As will be implied in the following paragraphs, a variety of different ranking methods have begun ta emerge in the social sciences especially in economics and political sciences. The context
of these methods is not only subject-limited, but also varies according to the nature of each country. For example, the assessment of departments in Rus-sia is subject to the three categories of parameters: characteristics of students, characteristics of faculty, and characteristics of the conditions of education (Filinov and Ruchkina 2002). A similar line of proposition is also the case for ranking British universities by the well-esteemed newspapers (Bowden 2000). In contrast, the Chinese system is rather narrow in scope with two categories of parameters: characteristics of faculty and efficiency of research and
devel-opment studies (Feng, Lu and Bi 2004). A summary of these procedures that
have been widely applied in the literature can be listed as follows:
First, one series of studies for ranking or classifying institutions and academic departments over the years has included the profile of their students and then graduates' achievements in later life, as evidenced by their incomes, occupa-tions (e.g. Eccles 2002). Second, a further series of studies has included the research accomplishments of the faculty, as measured by academic awards and honors they have obtained and their scholarly reputations in the eyes of their peers/ and these institutions' "resources" as measures, for example, by the number of books and joumals in their libraries, the amount and qual-ity of their laboratory equipment, and the size of their instructional budgets (e.g. Webster 1984; Feng, Lu and Bi 2004). Third, the scholarly reputations of faculty have also been assessed by taking the number of articles published in top joumals (e.g. Hix 2004; Hogan 1984; Miller, Tien and Peebler 1996) or by counting either aggregate pages or the average volume of articles per faculty (e.g. Dusarsky and Vemon 1998; Scott and Mitias 1996; Jackman and Siverson 1996). Finally, an altemative approach ranks departments by the number of citations attributed to their faculty. Citations include references to joumals, books, and monographs (e.g. Davis and Papanek 1984; Laband 1985; Sinha and Macri 2002; Jackman and Siverson 1996).
Apparently, there are two approaches to ranking of departments. On the one hand, several studies provide clear support for the view that department rankings are a function of the size in terms of the number of publications and citations or the capacity of facilities or the amount of budget ete. Specifically, the production ofa larger amount of publications constitutes an important element of department quality and this leads to a perception of positive repu-tations in the eyes of both the industry and public. As seen, this approach counts "quantity", called as objective measures. On the other hand, some other studies clearly suggest that size (quantity) does not count in evaluating the actual performance of departments and their position in the league table either at the national or intemational level. Rather, faculty productivity plays a central role. Thus, the distribution of scholarly productivity across faculty hasa greater influence over department rankings. As expected, this approach is more quality-oriented, called as subjective measures. The most widely used method for data collection is peer assessment - where senior academic are asked to evaluate the quality of other departments. This can be called as a cross-ranking approach. For example, this method is used by the US National
306 •
Anatolia: An lnternational Joumal of Tourism and Hospitality ResearchResearch Council and the USNWR to rank doctoral programs in the US, and in the Research Assessment Exercise in the UK far allocation of central gov-emment research funds (Hix 1995).
METHODOLOGY
As noted earlier, our experience shows that there is no standard methodology in earlier studies. The studies are diverse in terms of the content of the cri-teria employed, the type of data collection methods used and the style of assessment developed (e.g. Feng, Lu and Bi 2004; Yonezawa, Nokatsui and Kabayashi 2002; Siwinski 2002; Kent et al. 1993). The past studies have used numerous objective and subjective measures, collected either primary or sec-ondary data or both by carrying aut questionnaire surveys (e.g. Jackson and Siverson 1996) and considered both academics and industry executives as the sample (Karl et al. 1993). Asa combination of all these approaches, this study follows the tradition of previous studies by including objective (facts) and subjective (perception) measures (e.g. Berk 1979; Greenwood and Ramagli 1980; Federkeil 2002). The assessment of subjective indicators is dependent on the inclusion of lecturers and industry executives in addition to heads of departments (e.g. Kent et al. 1993; Greenwood and Ramagli 1980). Through the literature review, one should note that some people may be interested in the total output of the department whereas some others may wish to know about the quality of education or research in that department.
The ranking scheme developed to evaluate tourism and hospitality depart-ments in Turkey covered the undergraduate education. The departure point of our ranking is based on the notion that objective performance measures (total output of programs) and subjective performance measures (perceptual evaluation of the quality of programs based on a set of performance criteria) should collectively yield the status of rankings of departments. This statement implies that the ranking scheme would naturally consist of both objective and subjective measures. Objective measures focus on the total output of depart-ments (number papers in peer reviewed joumals, total experience of faculty abroad in years, admission - replacement scores, employment ratio of gradu-ates in the sector and the like). On the other hand, subjective performance measures attempt to measure the perceived performance of departments that individuals (e.g. business executives and professionals, employers, academi-cians) report ona given department. Thus, the ranking scheme of this study is embedded in value - expectancy models of decision-making and assessment. The foundation of value - expectancy models, as articulated by Rosenberg (1956) and Fishbein (1967), implies that selecting or assessing attractiveness of an object may be a function of the relative importance (weights) of selection or attractiveness dimensions and to what extent the object in question would possess those dimensions (Smith 1991). With these comments in mind, the fol-lowing general formula of the ranking scheme of departments is developed and used:
n n EDİ
=
L
Oİ +L
(V) * (Bij)i-1 i-1
Where
EDi = overall ranking of any particular department j
Oi = standardized objective measures (Z-scores)
Vi = importance of ranking criteria (weights)
Bii = degree to which altemative department j provides characteristic i j = departments (1 to n)
= ranking criteria for objective and perception (subjective) measures (1 ton)
The survey on which this study based has been organized in four sections: Section A of the questionnaire is related to the information received directly from departments. Section B includes a 5-point ordinal scale, representing a continuum from "very important" to "not important at all" to investigate the extent to which 10 measures are perceived to be important by the respondents in general. Section C is where we have asked the respondents to evaluate all the given departments by using a point scale from zero to 100 for 10 measures listed in Section B. More specifically, Section O asks the respondents to evalu-ate all departments based on the 10 ranking measures via a 5-point ordinal scale as in Section B.
The first ranking of departments is based on "objective measures or facts" (SectionA). Data were obtained from participating departments and then data were all standardized using Z score for each measure. ünce the standardized scores were generated for each measure, then the ranking was done by add-ing sums of Z scores to come up with the overall Z score of each department, and thus, the overall ranking of the all the departments. The survey included a list of specific questions about the departments under investigation: expe-rience in applied research, articles in per review joumals (both national and intemational), total experience of faculty abroad in years, and total practical experience of faculty in years. Average scores per faculty were adjusted. For example, the total number of articles is divided by the faculty size of the de-partment. An additional parameter refers to an average score of experience in other countries per student in months, an average replacement score of the department over the last three years, distribution of foreign language courses in the curriculum and the proportion of alumni working in the industry. Al-though a total of 25 tourism departments were traced in Turkey, data were ob-tained from only 18 departments. No response was received from the heads of six departments, all belong to private universities launched in early 2000s. Data for this step were collected via e-mail in April 2005. The results of this step are labeled as "RANK-1" (see Table 2).
The discussion of findings presented as RANK-2, and RANK-3 is partly based on the evaluation of subjective measures. This process includes judgments
308 •
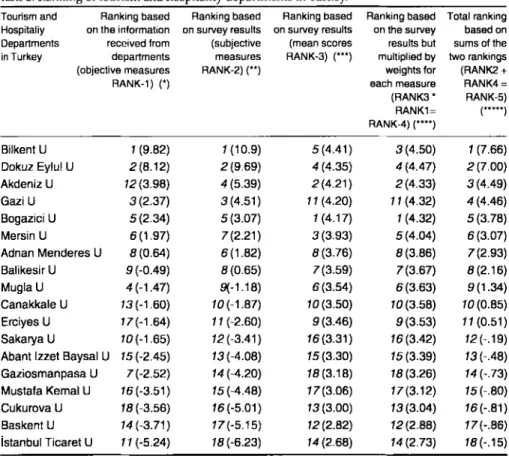
Anatolia: An lntemational Journal of Tourism and Hospitality ResearchTable 2. Ranking of tourism and hospitality departments in Turkey.
Tourism and Ranking based Ranking based Ranking based Ranking based Total ranking Hospitaliy on !he information on survey results on survey results on !he survey based on Departments received !rom (subjective (mean scores results but sums of !he in Turkey departments measures RANK-3) (*") multiplied by two rankings (objeclive measures RANK-2) (*') weightsfor (RANK2+
RANK-1) (*) each measure RANK4=
(RANK3' RANK-5) RANK1= ("**') RANK-4) ("") Bilkent U 1 (9.82) 1 (10.9) 5(4.41) 3(4.50) 1 (7.66) Dokuz Eylul U 2(8.12) 2(9.69) 4(4.35) 4 (4.47) 2(7.00) Akdeniz U 12(3.98) 4(5.39) 2(4.21) 2(4.33) 3(4.49) Gazi U 3(2.37) 3(4.51) 11 (4.20) 11 (4.32) 4 (4.46) Bogazici U 5(2.34) 5(3.07) 1 (4.17) 1 (4.32) 5(3.78) Mersin U 6(1.97) 7(2.21) 3(3.93} 5(4.04) 6(3.07) Adnan Menderes U 8(0.64) 6(1.82) 8(3.76) 8(3.86) 7(2.93) Balikesir U 9 (-0.49) 8(0.65) 7(3.59) 7(3.67) 8(2.16) Mugla U 4(-1.47) 9(-1.18) 6(3.54) 6(3.63) 9(1.34) Canakkale U 13 (-1.60) 10 (-1.87) 10(3.50) 10(3.58) 10(0.85) Erciyes U 17(-1.64) 11 (-2.60) 9(3.46) 9(3.53) 11 (0.51) Sakarya U 10 (-1.65) 12(-3.41) 16(3.31) 16(3.42) 12 (-.19)
Abanı izzet Baysal U 15 (-2.45) 13 (-4.08) 15(3.30) 15(3.39) 13(-.48) Gaziosmanpasa U 7(-2.52) 14 (-4.20) 18 (3.18) 18(3.26) 14 (-.73) Mustafa Kemal U 16 (-3.51) 15 (-4.48) 17(3.06) 17(3.12) 15 (-.80)
Cukurova U 18 (-3.56) 16(-5.01) 13(3.00) 13(3.04) 16(-.81)
Baskent U 14 (-3.71) 17(-5.15) 12(2.82) 12(2.88) 17(-.86)
İstanbul Ticaret U 11 (-5.24) 18(-6.23) 14 (2.68) 14(2.73) 18(-.15)
• "Objective measures or facts" received from the departments were ali standardized using Z score for each measure. ünce the standardized scores were generated for each measure, then the ranking was done by adding sums of Z scores to come up with the overall Z score of each depart-ment, and thus, the overall ranking of ali departments.
•• "Subjective measures or perceptions" received through a questionnaire survey conducted among faculty and industry executives were ali standardized using Z score for each measure. ünce the standardized scores were generated for each measure, then the ranking was done by adding sums of Z scores to come up with the overall Z score of each department, and thus, the overall ranking of ali departments.
••• The perceived importance of each measure for a list of 18 tourism departments was judged by those who were faculty and industry executives. This procedure induded a 5-point ordinal scale, representing a continuum from "very important" to "not important at ali". The table lists average mean scores calculated for each department.
•••• ünce we have the weights and the rating of Section D (evaluating of ali the departments) on the ranking measures (10 items), we can simply multiply the results with the weigh that came from Section C (where we have a point scale from zero to 100). The net values were found by di-viding the gross score by 10, which refers to the number of ali parameters given in Table 3. The list begins with a higher mean value followed by those with lower values subsequently.
••••• The two ranking scores have been added to come up with the overall ranking of depart-ments.
based on survey data obtained through the respondents who are described as faculty and industry executives. The questionnaire was developed based on the literature, consisting of 10 parameters. The survey was carried out via launching an HTML file on the WWW to promise anonymity. The above cat-egory of respondents was then called via e-mail ta participate in the survey. As of February 2005, 96 forms were retumed. The assessment of data in this part is related to the results of two sections in the questionnaire (Section B and C). Section B gives us the extent to which 10 measures are perceived to be important by the respondents in general. in Section C, we have asked the respondents to evaluate all the given departments by using a point scale from zero to 100 for the same 10 measures. While creating the weights, we multi-plied the results of rating of 10 measures (1 to 5) (Section B) by Section C. This would yield a weight for each measure / criterion that is labeled as RANK-2, as indicated in Table 2. A list of specific parameters considered in this respect and their weighted scores are provided in Table 3.
Table 2 reports the analysis of results derived from the empirical data on the
extent to which the parameters given in RANK-2 are perceived to be
impor-tant by the respondents. The importance of every parameter was judged by those who were faculty and industry executives under the Section D of the questionnaire. in the questionnaire, the participants were given a list of 18 de-partments to rank on the basis of the perceived value as indicated in RANK-2.
The listed measures include experience in applied research, articles in peer re-view joumals, employment opportunities of alumni, relations with the tour-ism and hospitality industry, faculty teaching practical courses, opportunity for exchange students and faculty, level of students' scores received from the central placement exams for enrollment, availability of places for training ar practical courses, distribution of foreign language courses in the curriculum, and lifespan of the department. The opinion of each respondent was given
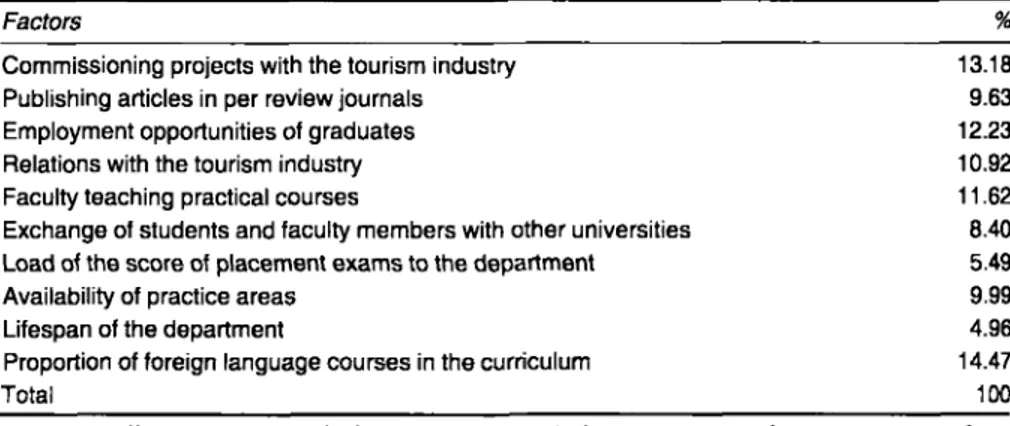
Table 3. Weighted importance of parameters for ali departments
Factors
Commissioning projects with the tourism industry Publishing articles in per review journals Employment opportunities of graduates Relations with !he tourism industry Faculty teaching practical courses
Exchange of students and faculty members with other universities Load of the score of placement exams ta the department Availability of practice areas
Lifespan of the department
Proportion of foreign language courses in the curriculum Total % 13.18 9.63 12.23 10.92 11.62 8.40 5.49 9.99 4.96 14.47 100
Note: Overall importance weight for each parameter indicates averages of parameters in evaluat-ing any hospitality and tourism program. Respondents rated the importance of ali the included parameters by assigning 100 points. Thus, rating can range from O to 100.
equal weight. The procedure includes a 5-point ordinal scale, representing a continuum from "very important" to "not important at all". Average mean scores for each department were calculated. We can have a ranking of depart-ments based on the rating of measures without the weights from RANK-2. The ranking begins with a higher mean value followed by those with lower values subsequently (RANK-3).
Once we have the weights and the rating of Section D (evaluating of all the departments) on the ranking measures (10 items), we can simply multiply the results with the weigh that came from Section C (where we have a point scale from zero to 100). The net values were found by dividing the gross score by 10, which refers to the number of all parameters given in Table 3. The reason to apply such a way is to seek the extent to which the order of departrnents based on objective measures is influenced by the consideration of the per-ceived importance by the respondents as an additional step of data analysis. The findings of this step are labeled as RANK-4.
Finally, we add the two ranking scores to come up with the overall rank-ing of the department. As in step-2, percentage scores (described as soft data or subjective measures) were weighted by multiplying with those values obtained through the primary data collection process from tourism depart-ments (described as department data or objective measures). As in step-4, mean scores of each tourism departrnent were weighted by multiplying alsa to the values of objective measures. Finally, the cumulative gross score was divided by "2" as a representative of two steps altogether. in other words, values of step-2 and step-4 were processed in this category of data assessment procedure. At the end of this procedure, mean scores for each department were calculated. As the study has been completed step-by-step, the fifth step is purely dependent on the average position of the departrnent in the prior four ranks (RANK-5).
DISCUSSION OF FINDINGS
First, it is important to emphasize that we used a listserv of tourism profes-sionals that consisted of 1,000 individuals both in business and academia. Of the retumed questionnaire (n=96), almost 75 percent (n=73) represented academia and 25 percent (n=23) represented the business. Of those affiliated with 18 tourism departrnents in the country, we had 73 respondents (38 PhDs and 33 masters) representing academia. it is our assessment that most of these individuals represent most of the departments that were evaluated. Although the response rate may appear to be low, given the membership of the tourism professionals list, members were encouraged to complete the questionnaire if they "felt comfortable" with the educational institutions listed in the ques-tionnaire. These 23 business respondents may be "major employees" - and alsa may have felt comfortable evaluating the programs, unlike the ones who did not respond to the study.
A summary of results for all rank categories is given in Table 2, which depicts all departrnents listed in order of an overall ranking. As reported above, the
first column gives the ranking based on the data directly obtained through communication with the department (Step-1). The next column gives the ranking based on how the participants perceived the perfarmance of all departments in order (Step-2). The fallowing column lists the departments based on the results of primary data obtained through an e-mail survey car-ried aut among scholars and industry executives (Step-3). The faurth column represents the final score that was yielded through multiplying the mean val-ues of the perceived significant parameters with the scores of objective meas-ures (Step-4). Column 5 presents the order of departments depending on the reorganization of scores given in columns 2 and 4 (Step-5).
Generally speaking, Table 2 provides evidence to support that the ranking of universities has remained between the older departments in the upper half (the first eight departments) and the new departments in the lower half (the remaining 10 departments). Specifically, far per capita (the first faur columns) and total (the fifth column) rankings, it is equally clear from the table that the top five universities are almost the same. These are Bilkent, Dokuz Eylul, Ak-deniz, Gazi and Bogazici. For total rankings, Bilkent U is the leader and close-ly fallowed by Dokuz Eylul, Akdeniz, Gazi and Bogazici. Obviousclose-ly, none of these institutions are post-1992 universities. There could be several specula-tions ta be arisen far such a result. First, Bilkent U is the first private university in the country, established in 1985. The tourism department of Bilkent U is often known far the quality of its training or education models rather than the credibility of its contribution ta the tourism research from an academic per-spective. The subsequent two departments alsa have a background of 15 and 20 years respectively in tourism research and education. While Dokuz Eylul U is more research-oriented due to its well established graduate programs, Akdeniz U is more industry-oriented because of its location in the city of
An-talya. Antalya and its vicinity, the center of inbound tourism, have a host of first class hotels and resorts.
Equally interesting is ta note that Bogazici U is also faund ta rank in the first five although it has relatively a new brand name undergraduate tourism de-partment, just launched in 2000. Despite this, Bogazici U has recorded a fast-growing progress to pace the majority of all tourism and hospitality depart-ments that are more mature. The recipe behind this success may be attributed ta a long-standing historical background of Bogazici U in general which alsa somehow directly ar indirectly contributes ta the perfarmance of its tourism department in particular and a positive scholarly reputation of its faculty. Gazi U is known ta be the first tourism department at the undergraduate lev-el. Its progress could also be considered as a success because its mission is just ta provide a superior education to its students who are expected ta become a lecturer or teacher at vocational high schools after their graduation. This mis-sion explains how the tourism department at Gazi U differentiates itself from its counterparts operating in the same field. Meanwhile, the objectives of oth-er departments are ta provide a supoth-erior education ta their students that will make them highly competitive and desirable employment candidates in the
job market. As a result, these departments often fallow an academic program which allows them to combine both theory and practice in their curriculum.
There are some exceptions that we should emphasize in this paper. Far ex-ample, while the tourism department at Akdeniz U is represented as the 13th in RANK-1, it has been among the top departments in all other ranking meth-ods. This finding refers to the speculation that the department at Akdeniz U hasa more positive image within the tourism community despite the fact that it hasa declining perfarmance in terms of maintaining its academic activities. A similar pattern of differences is alsa found far Erciyes U when data are com-pared between the five ranking methods under consideration. in contrast, such academic institutions as Mugla, Gaziosmanpasa, Sakarya and Istanbul Ticaret appear to become good perfarming departments according to the findings of the data given in the first column (RANK-1); however, their tour-ism departments subsequently drop significantly to the second half because they each had relatively a small number of faculty. An additional speculation may include that while these departments progress well in terms of academic issues, there appears to be a lack of an established image in the tourism com-munity with respect to the departments of the aforementioned schools.
As to expanding the discussion further about those departments taking place at lower levds, the results might be disappointing far them. The major-ity of these departments have a lifespan of almost 15 years or less, e.g. Mugla,
Canakkale, Sakarya, Abant İzzet Baysal, Gaziosmanpasa, Mustafa Kemal,
and Cukurova. Except far Cukurova, the rest institutions were launched in 1992. Baskent and Istanbul Ticaret, launched early in 2000s, are among those private institutions that are still growing in the country both in size and scope. Exceptions for public institutions include Mersin U (launched in 1979), Adnan Menderes U (launched in 1974), Balikesir U (launched in 1974), and Erciyes U (launched in 1984). While the first three takes place in the first half, Erciyes U as from older departments is in the middle. The reason could be that these departments were split from their main university administrations and cam-puses when the law to launch new universities was put into effect in 1992. As a result, the performance of these departments was weakened due to losing their motivations and having some financial as well bureaucratic burdens far a while. This led to gaining less amount of research funding, attracting more number of students far admission and working with a relatively lower qual-ity of facilities.
Comparing the second and fifth columns, it is obvious that the results of RANK-2 (per-capita rankings) and RANK-5 (total rankings) correspond closely to each other. Exceptions include two universities which have replaced each other from one column to another. Departing from this finding to be con-sidered as evidence, one may note that the degree to which the ranking of tourism departments is largely dependent on the extent to which they are perceived by the tourism community who can be detailed as tourism scholars and industry members. However, there are alsa several cases where some de-partments rate much higher in the reputational ranking than in the objective
ranking- for example, Akdeniz U. In other cases, some departments receive a lower ranking than they deserve according to objective indicators, e.g. Mugla U, Gaziosmanpasa U and lstanbul Ticaret U. in most cases, from an optimis-tic point of view, the latter departrnents have improvement in recent years, so their reputation may become more noticeable in the future.
As an additional stage of the study, some business professionals were alsa approached to talk over the phone and see how they would look at the order
of these departments. in order to augment our study and increases its
cred-ibility, approximately 100 business professionals were simply contacted (but only six agreed to participate) and asked to evaluate the departrnents over the phone using the identical list of departments used during the survey. The general feedback from these indivudauls was alsa very consistent with the current rankings of programs and thus providing further validation of the rankings of the departments.
CONCLUSIONS AND IMPLICATIONS
Although there has been a long tradition of ranking departrnents on the ba-sis of research productivity, this phenomenon is relatively new in tourism research. Thus, ranking of academic institutions is currently a timely issue in the agenda of scholars or heads who are keen on continuous improvement of their departrnents (Filinov and Ruchkina 2002). in this study, we have spe-cifically evaluated tourism departrnents by using both objective (facts) and subjective (perceptions) measures and following a five-step methodological approach. The study findings suggest a strong relationship between the repu-tational rankings of the quality of departments and their overall ranking. This finding may point to the fact that the reputations of departments may be at-tributed to the public's positive perceptions of their quality. A similar relation-ship alsa exists, although limited, between reputational rankings and more objective measures of departrnent quality (see Bilkent, Dokuz Eylul, Gazi, Bogazici in colurnns 1 and 2 of Table 2). Despite the general similarity in the reputational and total rankings, there is noteworthy discrepancy between the rankings given in columns 3, 4 and 5 of Table 2.
Generally speaking, the study findings indicate that some departrnents drift away from the league table while the position of top departrnents does not really change. This evidence can be potentially considered asa helpful instru-ment for lower performing schools and departrnents to upgrade their strate-gies and improve their reputations either within the country or around the world. Such an effort might be of help to maintain quality standards and to be more open to the international academic community as well as to the intema-tional admission, scholarship and funding programs. The results alsa assist us to distinguish which schools are more teaching oriented while the others are research oriented. In line with the rule of market segrnentation strategy in this context, it would be helpful for students or even for scholars to choose which departrnent to continue for their future career. Otherwise, it would be
waste of time and energy fora prolific scholar who is keen on the quality of research outputs ta apply fora position in a more teaching oriented depart-ment or vice versa.
Several reasons could be speculated to explain as to why such a gap has ap-peared among the departments under investigation. First, faculty at lower ranking schools or departments might be required ta teach more courses while being not encouraged for contribution to the expansion of tourism research from an academic perspective. Second, despite the fact that the last decade has witnessed an increase in supply of tourism departments and de-mand of applications, the lack of sufficient funding, infrastructure, lecturers and academic atmosphere in some departments should alsa be taken into ac-count asa main barrier particularly for those departments that were launched early 1990s. A final remark leads to describing that survey-based rankings might be of more subjective. Although some departments have good reputa-tions either within or out of the country due to their long standing histori-cal background in higher education or their growing popularity in the last few years, the findings of this study suggest that such a reputation does not always reflect publication productivity ora betler position in the table. One may suggest that such departments revisit their missions in the future unless they are coincided with their current performance.
Recalling that ranking is a very new topic in tourism, there is a possibility that some scholars and department heads may react to the results of such rankings and deny these results as being superficial, arbitrary or lacking a real meas-urement of quality. However, as a consequence of atlempts to increase their proportions in terms of budgets, quality of research and admission of stu-dents, it has become an obligation to evaluate their performance and competi-tive positions in the table of national or international leagues. The authorities will evaluate their performance to see where their strengths and weaknesses lie and use others to benchmark. For example, Meredith (2004) has suggested a positive relationship between the performance of departments and their pricing decisions for admission of students. in other words, a betler position might be an important criterion to influence the amount of admission fees. it seems that tourism departments in Turkey have no motivation ta involve in developing methods ta become more competitive and gain a higher position. The findings of this study may be of help to revitalize education and research and also avoid the speculation that once lecturers / professors are hired, they do not make any contribution ta the literature until they are retired and that they repeat the same lectures for decades, as experienced in other countries such as Japan some years ago. There is a possibility that an increasing number of universities will lead ta stimulating the transparency in terms of the quality of both research and education.
As noted elsewhere in the paper, the tourism literature lacks undertaking a similar patlern of research although the past research has contributed to a wider category of subject fields such as economics, political sciences and so forth. This study would be valuable from two perspectives. One is that it
develops a well conceptualized ranking scheme. Second, using this "betler ranking method", there is an intention to rank or evaluate tourism depart-ments in Turkey. One may believe that others in varying disciplines can alsa benefit from the ranking scheme that is being developed in this study. There-fore, this study differentiates itself from its counterparts and does add to the body of research on ranking in several aspects. First, the study is known to be among the first in its category in the field of tourism research. Next, the study findings indicate that approaches to using methods far ranking are not fully consistent with one another. Rankings given in columns 3, 4 and 5 are wor-thy of consideration in this respect. Finally, the study extends the context of existing methodologies from an additional perspective which refers to both the productivity of research outputs and the quality of education (Hix 2004; Miller, Tien and Peebler 1996; Kari et al. 1993). Asa consequence, we hope that an overall evaluation of this study provides an additional help to advance the attempts towards ranking the performance of departments in such areas as economics and so forth.
Given that both the tourist market worldwide is substantial and likely to grow in the future, a similar pattem of trends has been in the agenda of many public and private institutions to open new tourism departments worldwide to counterbalance the lack of qualified employees and efforts to develop new working methods or standards. Therefore, anticipating a more fierce com-petition within the academic world, efforts to understand the ranking of tourism departments is likely to become especially important in the future's growing academic environment in international tourism. Building ona list of earlier studies in economics as indicated elsewhere in the paper, this study has provided a first step toward developing a conceptual model on ranking of tourism departments and testing its practical application into the practice. in addition to ranking of tourism journals (e.g. McKercher 2005) or prolific scholars in tourism (e.g. Ogaratnam et al. 2005; Ryan 2005), despite of few at-tempts (e.g. Ogaratnam et al. 2005), ranking of tourism departments is an area of work that still remains to be explored in the field because the development of tourism asa scientific discipline is very new in the world. in this context,
a more extensive, comprehensive and systematic study which can include ali
tourism schools and departments around the globe should be carried aut to develop an intemational table of league in tourism research.
Finally, given the importance and impact of rankings, one may recall that all approaches to rankings have some limitations. Far example, the development of tourism as a scientific discipline is very new in Turkey, as in many coun-tries. This leads to problems in tracing the required data and its solid inter-pretation. Thus, several limitations should be taken into consideration. One obvious criticism is that the peer assessment method (academics are asked to evaluate the quality of other departments) is more subjective due to the lack of expertise in the field (Berk 1979; Greenwood and Ramagli 1980). Next, the study has evaluated tourism departments by the performance of their current faculty. As emphasized in the context of stock / flow approaches by Sinha and
Macri (2002), the mobility of faculty may create bias which cannot be easily adjusted. As a main methodological problem, the difference between current affiliation (time of survey) and listed affiliation (time of publication) may be-come a moderating factor on ranking departments (Miller, Tien and Peebler 1996). Moreover, an additional list of parameters may alsa be introduced, e.g. financial activities, characteristics of students and graduates, and the capac-ity of school facilities. Last but not the least, without unknown reasons, few scholars and department heads reacted to the survey and appeared to dis-courage the participation of their colleagues. Asa consequence of this, despite some obliged, some other academics did not reply. All these limitations point to the efforts of future research to be wider both in size and scope.
REFERENCES
Berk, R. A. (1979). The Construction of Rating Instruments far Faculty Evaluation: A Review of Methodological Issues, Joumal of Higher Education, 50(5): 650-669.
Bowden, R. (2000). Fantasy Higher Education: University and College League Tables, Quality in Higher Edııcation, 6(1): 41-60.
Conroy, M. E. and Dusansky, R. (1985). The Productivity of Economics Departments in the U.S.: Publications in the Core Joumals, Joumal of Economic Literatııre, 33(4): 1966-1971.
Davis, P. and Papanek, G. F. (1984). Faculty Rating of Major Economics Departments by Citations,
Anıerican Economies Review, 74(1): 225-230.
Dichev, 1. (1999). How Good are Business 5chool Rankings? The Jourııal of Business, 72(2): 201-213. Dusansky, R. and Vernon, C. J. (1998). Rankings of U.S. Economics Departments, Joumal of
Eco-nomics Prospectives, 12(1): 157-170.
Eccles, C. (2002). The Use of University Rankings in the United Kingdom, Higher Edııcation in
Eıırope, 27(4): 423-432.
Federkeil, G. (2002). 5ome Aspects of Ranking Methodology- The CHE-Ranking of German Uni-versities, Higlıer Education in Europe, 27(4): 389-397.
Feng, Y.J., Lu, H. and Bi, K. (2004). An AHP/DEA Method far Measurement of the Efficiency of R&D Management Activities in Universities, Intemational Transactions in Operational
Re-searclı, 11: 181-191.
Filinov, N. B. and Ruchkina, 5. (2002). The Ranking of Higher Education Institutions in Russia: 5ome Methodological Problems, Higher Edııcation in Europe, 27(4): 407.421.
Fishbein, M. (1967). Attitude and the Prediction of Behavior. in Fishbein M (ed) Readings in At-titude Tlıeory and Measuremeııt (pp.477-492). NY: John Wiley.
Graves, P. E., Marchand, J. R. and Thomas, R. (1982). Economics Departmental Rankings: Re-search Incentives, Constraints and Efficiency, Americmı Economic Review, 72: 1131-1141. Greenwood, G. E. and Ramagli, H. J. (1980). Alternatives to 5tudent Ratings of College Teaching,
Joımıal of Higher Edııcation, 51(6): 673-684.
Hix, 5. (2004). A Global Ranking of Political 5cience Departments, Political Studies Review, 2: 293-313.
Hogan, T. D. (1984). Economics Departmental Rankings: Comment, Americaıı Economics Review, 74(4): 827-833.
Jogaratnam G. et al. (2005). An analysis of Institutional Contributors to Three Major Academic Tourism Journals: 1992-2001, Tourism Management, 26(5): 641-648.
Kent, W. E. et al. (1993). Colleges' Hospitality Programs: Perceived Quality, Comel/ Quarterly, 34(6): 90-95.
Laband, D. N. (1985). A Ranking of the top Canadian Economies Departments by Research Pro-ductivity of Graduates, Canadian Joımıal of Economies, 18(4): 904-907.
McKercher, B. (2005). A Case for Ranking Tourism Journals, Tourism Management, 26(5): 649-651. Meredith, M. (2004). Why do Universities Complete in the Ratings Game? An Empirical Analysis
of the Effects of the US News and World Report College Rankings, Researclı in Higlıer Edu-cation, 45(5): 443-450.
Miller, A. H., Tien, C. and Peebler, A. A. (1996). Department Ratings: An Altemative Approach, Political Science and Politics, December: 704-717.
Rosenberg, M. (1956). Cognitive Structure and Attitudinal Effect, Journal of Abnornıal and Social
Psyclıology, 53: 367-372.
Ryan C. (2005). The Ranking and Rating of Academics and Joumals in Tourism Research, Tourism Management, 26(5): 657-662.
Smith, L.J. S. (1991). Tourisnı Aııalysis: A Handbook (2nd edition) NY: Longman - John Wiley. Scott, L. C. and Mitias, P. M. (1996). Trendsin Rankings of Economics Departments in the US: An
Update, Economic Inqııiry, 34: 378-400.
Sinha, O. and Macri, J. (2002). Rankings of Australian of Economics Departments: 1988-2000, The
Ecoııomics Record, 28(241): 136-146.
Siwinski, W. (2002). Perspektywy- Ten Years of Rankings, Higher Edııcation iıı Europe, 26(4): 389-406.
Smyth, O. J. (1992). Participation Profile of the Southern Economic Association Annual Meetings, Southern Ecoııomic /ounıal, 59(2): 1-9.
Webster, D. S. (1984). The Bureau of Education's Suppressed Rating of Colleges: 1911-1912, His-tory of Education Qııarterly, 24(4): 499-511.
Yonezawa, A., Nakatsui, I. and Kobayashi, T. (2002). University Rankings in Japan, Higlıer Edııca
tion in Europe, 27(4): 373-38.
Submitted : 01 August 2007
Resııbnıitted : 05 October 2007 Accepted : 15 October 2007
Refereed anonynıously