Assessing the Currency Crises in Turkey
Elif Çepni
+and Nezir Köse
+++Dogus University, Acıbadem, Zeamet sok. No: 21
34722 Kadıköy/İstanbul [email protected] ++Gazi University, İ.İ.B.F. 06500 Beşevler/Ankara [email protected] Abstract
This study presents the significance of the currency crises, discusses the related literature and applies a model of economic vulnerability to Turkey during 1985Q2-2004Q2. The common approach in currency crisis literature is to focus on the performance of thresholds for a set of early warning indicators. Following the explanation of “Index of Speculative Pressure” (ISP), Granger causes of the ISP is discussed. The study shows that, current account/ GDP ratio, M2/international reserves ratio, real credit growth and current account/foreign direct investment ratio are Granger causes of the ISP at 1 % level. Then by using Vector Auto Regression (VAR) model, the ISP index is forecasted. The study shows that the combination of VAR(1)+VAR(2)+VAR(5) models generate relatively better forecast values than all other single models. Finally the study estimates dynamic probit and logit models by using maximum likelihood to predict currency crises. It shows that logit model gives a better performance than the probit, for a better prediction of the probabilities of the Turkish currency crises. The most important contribution of this study is to show that the logit model has a very high performance in the prediction of Turkish currency crises. It can be used to foresee forthcoming currency crises. Also the forecast of the ISP (as a level) is giving very successful results. It is observed that the ISP and forecasted ISP values are almost moving together or very close to each other.
JEL Classification: C25, E44, F3, F47.
Elif Çepni and Nezir Köse / Central Bank Review 1 (2006) 37-64
38
1. Introduction
The volatility of exchange rates around the world has tended to grow with the massive growth in “hot money” since the early 1970s. There are many reasons of this volatility including; a growth in international financial markets encouraging the international transfer of money, a liberalisation of international financial movements combined with easier computer transfer funds, a massive growth in speculative activities of trading companies, banks and other financial institutions, the growing belief that rumour and “jumping on the bandwagon” are more important determinants of currency buying or selling than cool long-term appraisal.
Today it has become increasingly difficult for countries to counteract speculation on their own. The scale of foreign exchange markets movements makes any significant speculation too great for individual countries to resist.
Notwithstanding most governments and firms dislike highly volatile exchange rates, most of them insisting in staying flexible exchange rate regime. Turkey is not an exception. During 1990s, economic crisis started to affect the Turkish economy with increasing frequency. After the adoption of Structural Adjustment and Stabilization Program (which is called 24 January 1980 Decisions), Turkey liberalized its economy to integrate with the world economy. In line with this goal, a lot of new laws were passed to liberalize foreign trade and financial movements. Decree no.32 on the protection of the value of the Turkish currency which went into effect on 11 August 1989 has formed the legal framework necessary for the transformation of the Turkish currency to “convertibility (Çepni, 2003).
With this decree, the liberalization of the foreign exchange regime and capital movements was to a large extent completed. After switching to a free floating regime, Turkey started to encounter with more frequent crises. While external factors played a significant role (1991 Gulf crises, 1999 earthquakes etc), the main reasons of these crises were: the development of an unsustainable domestic debt dynamic and unhealthy structure of the financial sector, with particular problems caused by the state banks and by the failure of structural problems.
At the end of 1999, Turkey embarked upon an ambitious Stabilization programme, aimed at achieving single digit inflation by 2002. A nominal anchor was set for reducing inflation expectations, sounder public finance and wide-ranging structural reforms designed to liberalize and modernize the economy.
Elif Çepni and Nezir Köse / Central Bank Review 1 (2006) 37-64 39
Significant progress was made during 2000. But a severe banking crisis blew up in late November, accompanied a massive capital outflow.
The challenge for banking reform is particularly arising from “unlimited Turkish lira-deposit insurance” introduced after the 1994 crisis. This insurance is the main source of banking system moral hazard (Policy Reassessment, 2001).
Notwithstanding the economic programme adopted at the beginning of 2000 achieved a lot of pre-determined goals of the economic policy, through the end of the year it caused growing concerns about he sustainability of the exchange rate regime.
On 21 November 2000, there was more than 1.4 billion $ demand for foreign currency, therefore, the Central Bank stopped providing liquidity and the overnight interest rate (simple annual) reached its peak of 800 percent on December 4, 2000. Political uncertainties and the cautious approach of international capital towards emerging markets as a result of developments in Argentina led to a decrease in capital inflow to Turkey especially in the second half of 2000.
The capital outflow only halted and devaluation fears allayed by the announcement on 6 December of a large IMF package planning to give $7.5 billion additional loan from the Supplemental Reserve Facility, (SRF) in addition to $5 billion from the World Bank.
On February 19th 2001, Bülent Ecevit, the prime minister was accused by Ahmet Necdet Sezer, the president for his half-hearted pursuit of corrupt politicians and not doing enough to fight corruption at National Security Council meeting. There was a scheduled domestic debt auction of the Treasury on February 20, 2001, the day before the maturing of $5 billion domestic dept. the auction aimed at borrowing approximately $ 5 billion which was almost 10 percent of the domestic debt.
This untimely row caused much more serious crisis than the November 2000 crisis. The markets took the news badly, fearing that infighting might topple the government and these developments brought Turkey’s much-needed economic and political overhaul to an untimely end. Jittery investors started pulling billions out of the country, seriously denting the Central Bank’s reserves of foreign exchange.
On the 19th of February the Central Bank’s reserves declined by $5.1 billion dollars within 2 hours. The stock market (ISE National 100) lost 18% of its value on the 21st of February ended the day at 7180.
Elif Çepni and Nezir Köse / Central Bank Review 1 (2006) 37-64
40
On the 22nd of February the repo interest rates were achieved to 7500% which gave the average 4400% for the mentioned day. In order to obstruct this climb in the interest rates, the Central Bank sold money at 1000% interest rate level. Nothing was enough to restore the confidence in the market. With every passing day, the uncertainty and the degree of the loss in the confidence started to increase. In the end, the government had no choice but the abandon the lira’s “crawling peg”.
The Turkish exchange rate system was a “crawling peg” which allowed the external value of the lira by no more than 15 % against a currency basket comprising the dollar and euro a year. The Turkish government was not the only looser when the country’s currency collapsed on the 22nd of February. The IMF which helped design the Turkish exchange rate regime as a part of an $11.5 billion lending programme was accused for writing wrong prescriptions (Turkey in Turmoil, 2001).
There are many countries that are facing with similar crises on the world. Because of such dangers, currency crises have been the subject of an extensive economic literature, both theoretical and empirical. Still there exist a lot of unsolved issues; each new set of crises presents new puzzles.
An exchange rate regime remains nearly as controversial as it was at the outset. Sharply different regimes continue to coexist, from currency boards to relatively free floating. Exchange rate policy lies at the nexus of all strategic policy choices (Begg et al., 1999, 1).
In most countries exchange rate policy was dominated by the trade off between disinflation and external competitiveness.
At a casual glance, the IMF’s attitude towards exchange rates seems extraordinarily erratic. In 1997 the Fund urged Asian countries to devalue or float their currencies. In 1998 it lent billions to Russia and Brazil to try to help them maintain their exchange rates. It has praised Hong Kong for its super-strict currency board, and feted Singapore for its flexible managed float. Given that exchange-rate regimes are by definition central to currency crises, such different approaches cannot all be ideal (global finance, fix or float, 1999).
It is one area where the trade-offs cannot be fudged. In a world of increasingly mobile capital, countries cannot fix their exchange rate and at the same time maintain an independent monetary policy. They must choose between the confidence and stability provided by a fixed exchange rate and the control over
Elif Çepni and Nezir Köse / Central Bank Review 1 (2006) 37-64 41
policy offered by a floating rate. Traditionally, the deciding factor in a country’s choice has been its vulnerability to external shocks, such as sudden shifts in commodity prices. A floating currency allows a country to adjust to external shocks through the exchange rate. In countries with a fixed currency, domestic wages and prices will come under pressure instead.
Most academics now believe that only radical solutions will work: either currencies must float freely, or they must be tightly tied (through a currency board or, even better, currency union). Unfortunately the academics rarely agree on the best solution.
Policymakers prefer to play down exchange rates. Any regime can work, they argue, provided it is backed by sound economic fundamentals. That is true but trite. Of course a country will benefit from sound fiscal and monetary policies; but, as recent events have shown, a country’s choice of exchange-rate regime clearly affects its vulnerability to crises. Asian countries got into trouble because of their exchange-rate pegs, and were then thrown into chaos by the volatility of floating rates.
Different countries will have taken different routes to achieving the “impossible trinity” of integration, regulation and sovereignty. Those in regional unions will have given up sovereignty for integration; those with floating rates will have maintained sovereignty, but often at the cost of restricting integration with the rest of the world (global finance, fix or float, 1999).
The international monetary and financial system has evolved incrementally from the gold standard to the gold-exchange standard, to the Bretton Woods gold-dollar system, and now to the post-Brettton Woods “nonsystem”.
With the outbreak of the Asian crisis, a new urgency came to be attached to efforts to reform and strengthen the international financial system. The international system is a dense network of social, economic, and financial institutions. As with any complex mechanism, there are limits on the feasible changes to any one component so long as the others remain in place.
The prevailing system is widely criticized but it is not discredited. To achieve such a consensus is immensely complicated by the number of governments and interest groups involved. In contrast to the situation during the Second World War, the world today is a more multipolar place. There is the G-3, the G-7, the G-10, the G-20, and a host of other (Eichengreen, 2002, 3).
Elif Çepni and Nezir Köse / Central Bank Review 1 (2006) 37-64
42
Financial markets are markets in information, and information by its nature is asymmetric and incomplete. Sharp changes in asset prices, sometimes so sharp as to threaten the stability of the financial system and the economy will occur from time to time. It follows that crises have always will be and that they remain a particular problem in developing countries. Bordo et al. (2001) shows that currency, banking and twin crises are hardly perennials as well (twin crises are when currency crises and banking crises come together, a twin crises is said to occur when there are currency and banking crises in the same or immediately adjoining years) (Eichengreen, 2002, p.5).
In this paper, after the presentation of the significance of the topic (currency crises) in this introduction part, related literature on the theory of currency crisis will be discussed in the forthcoming part and finally a model of economic vulnerability will be applied to Turkey in the last part. The common approach in currency crisis literature is to focus on the performance of thresholds for a set of early warning indicators.
2. Theory
Currency crisis literature comprises different types of analysis. But these analyses can be categorized under two main headings. The first category focuses on “the prevention of the crisis” whereas the second one concentrates on “how to manage a crisis once it occurs”.
Studies that can be put into the first category try to find an answer for “how crises can be prevented or what can be done to avoid or minimize crises” and studies that can be put into the second category try to find an answer for “if it occurs, what is the best policy response that must be given to resolve and manage crisis”.
It can be said that a number of useful steps have been taken on prevention side but little has been achieved in terms of how to manage and resolve crises (Eichengreen, 2002).
Studies on the prevention side can be categorized under different titles as well. Our categorization is based on the studies presented at a National Bureau Economic Research Conference held in 2001.
The first category consists of studies on “the role of the current account and trade flows in financial crises”. Whether large deficits increase the probability of a
Elif Çepni and Nezir Köse / Central Bank Review 1 (2006) 37-64 43
currency crisis or not, are trade linkages important determinants of country vulnerability to crises (this is also called the contagion effect showing the transmission of currency crises across countries) or not and similar questions are tried to be answered.
The second category consists studies on the role of financial players (including banks, large hedge funds, private sector investors and speculators). Whether the exchange and interest rate polices in the advanced countries affect capital flows to emerging countries, whether the presence of large agents increases a country’s vulnerability to a crisis and similar questions arise in these studies. Some policy makers and analysts express their concern that the activity of large players in small markets (big elephants in small ponds) may trigger crises that are not justified by fundamentals, destabilizing foreign exchange and other asset markets, creating systemic risk, and threatening the stability of the international financial system (Corsetti et al., 2001).
The third category includes studies concentrating on the role of financial liberalization. The importance of capital controls and whether capital controls are working or not analysed by many studies. It has been argued that unrestricted capital mobility was at the centre of global financial instability. It is believed that speculators focus exclusively on the short run (also speculators are often affected by rumours) and tend to flee countries at the first signs of trouble. Many economists believe that restricting capital mobility can reduce the frequency and depth of financial crises.
The fourth categorization focuses on the role of capital flows. The balance sheet effects and crony capitalism are the main points in these studies. In a world with increased capital mobility, currency crises have very important balance sheet effects. If the corporate sector has significant liabilities expressed in foreign currency, devaluation can generate massive bankruptcies. Most probably this will cause an increase in local banks’ nonperforming loans. Moreover if the extent of “crony capitalism” is big in a country the negative effects will be more severe. If banks lend to friends and “cronies” and tend to inflate the value of collateral, in the downturn they cannot recover easily. Empirical evidence shows that banks’ difficulties can grow quickly and become very costly to clean up. Restructuring the corporate and the banking sectors could cost a lot for the country.
Elif Çepni and Nezir Köse / Central Bank Review 1 (2006) 37-64
44
The traditional models of currency crises follow the seminal work by Paul Krugman (1979), and Maurice Obstfeld (1986). The alternative view on currency crises stems from the writings of Hyman Minsky (1982, 1977,1975) championed by Charles Kindleberger (1996) in his classic work Manias, Panics and Crashes. Krugman’s work has been simplified and extended by several authors including Flood and Garber (1984), Connolly and Taylor (1984), Calvo (1987), Krugman and Rotemberg (1991), Flood, Garber and Kramer (1996) (Saqib, 2002).
Generally three varieties of financial crisis are mentioned in literature. The first one is the early literature describing crises triggered by unsustainable policies. The model first laid out by Krugman in 1979 and refined by Flood and Garber in 1984. Krugman model (1979) is an example of a “first generation” speculative attack model. Alternatively such models are sometimes called “canonical currency crisis models”.
The canonical currency crisis model explains such crises as a result of a fundamental inconsistency between domestic policies, typically the persistence of money-finance budget deficits and the attempt to maintain a fixed exchange rate. In these models, the breakdown of the fixed exchange rate system is inevitable because the authorities are attempting to pursue two policies which are not compatible in the long-run, the maintenance of a fixed exchange rate and the creation of domestic credit at a faster rate than that compatible with maintaining fixed exchange rate (Fane, 2000, 87). Standard example is the expansionary monetary policy leading to inflation and creating pressure on the exchange rate (devaluation) which the central bank can only resist to a certain extent.
The inconsistency can be temporarily papered over if the central bank has sufficiently large reserves, but when these reserves become inadequate speculators force the issue with a wave of selling (Krugman, 1997).
The theory of first generation models provides some useful insights to understand the balance of payments crisis. In the first place is the identification of the relevant macroeconomic fundamentals whose variation in a certain trend helps to foresee the crisis. Related to this is its demonstration of speculative attacks that are fully anticipated, as opposed to irrational panics. Secondly, given particular values of fundamentals, timing of the crisis can be fixed. Finally, crisis is unavoidable. In other words, first generation models are subject to unique equilibrium (Saqib, 2002).
Elif Çepni and Nezir Köse / Central Bank Review 1 (2006) 37-64 45
Fundamental based crises can be predicted. The usual signals were flashing: large and growing budget deficits, matched by large and growing current account deficits. For this kind of crisis, early warning signals can work but they can be fairly trivial and readily missed.
Following Flood and Garber (1984) and Obstfeld (1986), the second generation models note that the crises in foreign exchange market are due to rational and self-fulfilling expectations, which can be triggered by random events. Speculative attacks may be self fulfilling, in the sense that multiple equilibriums are possible, any one of which can be sustained indefinitely provided that everyone believes that it will be sustained (Fane, 2000, 91). Currency crises can occur without necessarily being caused by fundamental factors. Even currencies that are stable can be targets of a speculative attack.
There is a “good” equilibrium where markets do not attack the currency and the authorities’ preference is to maintain the peg, which is possible since the fundamentals allow the survival of the regime. Simultaneously there exists a “bad” equilibrium where an attack, if it were to occur, would succeed.
There may exist several (or an infinity of) “bad” equilibriums corresponding to various sizes of the post crisis depreciation. The cause of multiple equilibria is that; markets act on the basis of expectations of a particular outcome. What makes a crisis occur is the belief that it can occur. Expectations that are ex ante unjustified are validated ex post by the outcome that they have provoked.
The EMS (European Monetary System) crisis of 1992-1993, the Mexico crisis of 1994-1995 and the Asian crisis (Thailand excepted) all exhibit features compatible with the assumption of self fulfilling attacks (The Exchange Rate: Threats, 1999, p.61).
There are many possible ways in which multiple equilibriums can arise. For example an expectation of devaluation may be self fulfilling if it results in money wages being set at higher levels than those that would be set if workers and employers were confident that the exchange rate would not be devalued. The reason is that if money wages have been set at relatively high levels, the authorities are under more pressure to reduce unemployment by devaluing than if wages had been set at lower levels. In this example “herding” behaviour is in the self interest of employers and employees (Fane, 2000, 92).
Elif Çepni and Nezir Köse / Central Bank Review 1 (2006) 37-64
46
What sets self fulfilling crises off is a difficult question to answer. Anything could in principle be the trigger. That is “sunspot” dynamics, in which any arbitrary piece of information becomes relevant if market participants believe it is relevant.
Both the canonical currency crisis model and the second generation models presume that foreign exchange markets are efficient, that they make the best use of the available information. What difference might inefficient markets make to the study of currency crises? The most obvious difference is the possibility of “herding”. In the context of a currency crisis, this means that a wave of selling, whatever its initial cause, could be magnified through sheer imitation and turn quite literally, into a stampede out of the currency.
According to theorists herding might be arising from “bandwagon effects” driven by the awareness that investors have private information or might be arising from “principal-agent” problem. Much of the money that has been invested in crisis-prone countries is managed by agents rather than directly by principals.
Kehoe and Chari (1996) have argued that bandwagon effects and markets with private information create a sort of “hot money” that at least sometimes causes foreign exchange markets to overreact to news about national economic prospects.
Related with principal-agent problem, we can imagine a pension fund manager investing in emerging market funds. She will have far more to lose from staying in a currently unpopular market and turning out to be wrong than she does gain from sticking with the market and turning out to be right. To the extent that money managers are compensated based on comparison with other money managers, then may have strong incentives to act alike even if they have information suggesting that the market’s judgement is in fact wrong (Krugman, 1997).
The Asian crisis led to a proliferation of “third generation” models, quite different from the first or the second generation because in the major crisis countries of Asia, neither of these stories seems to have much relevance. These attempts caused the introduction of the third generation models. In these models the core of the problem lies in the banking system (Krugman, 1999). Third generation crises are financial factors dominated crises.
There are three main variants of the third generation crises. One version involves moral-hazard driven investment, which leads to an excessive build up of external debt and then to a collapse. It implies that there should be over-investment and excessive risk-taking by entrepreneurs with access to guaranteed finance, but also
Elif Çepni and Nezir Köse / Central Bank Review 1 (2006) 37-64 47
that the availability of implicit guarantees should tend to crowd out legitimate investment that bears the full burden of risk.
A second version put an emphasis especially to financial fragility. These are bank run centred models (open economy version). The second version, largely associated with the 1998 study of Chang and Velasco, is built around open-economy versions of the Diamaond-Dybving bank-run model. In this model, investors face a choice between short-term investments with a low rate of return and long-run investments with a higher rate of return. Unfortunately, the long run investments yield relatively little if they must be liquidated prematurely, and investors are assumed to be unsure ex ante about when they will want to consume. Financial intermediaries can resolve this dilemma by pooling the resources of many investors and relying on the law of large numbers to avoid holding more short-term assets than necessary. However, such intermediaries then become vulnerable to self-fulfilling panics, in which fear of losses leads depositors to demand immediate payment, forcing destructive liquidation of long-run assets that validates these fears (Krugman, 1999). But some economists argue that the bulk of the bad loan problem is a consequence of the crisis, of the recessions and currency depreciations that followed the collapse of capital inflows.
The third version of the third generation models stresses the balance-sheet implications of currency depreciation. These models attempt to combine moral hazard driven bubble with a balance sheet driven crisis when the bubble burst. The deterioration of balance sheets played key role in the Asian crisis. The explosion in the domestic currency value of balance sheets is having a disastrous effect on firms. The prospects for recovery are generally very difficult because of the weak financial condition of firms. Their capital is wiped out by the combination of declining sales, high interest rates, and a depreciated currency. These balance sheet problems are in turn a cause of the problem of non-performing loans at the banks, they are not a banking problem per se, and even a recapitalization of the banks would still leave the problem of financially weakened companies untouched.
To explain financial crises, apart from first, second and third generation models, there is another model called Kindleberger Minsky model in the literature of currency crises.
Kindleberger (1996) describes three phases of a process that leads to a financial crisis namely mania, panic and crash. Manias take place at the same time of
Elif Çepni and Nezir Köse / Central Bank Review 1 (2006) 37-64
48
business cycle expansion when economic agents change from liquid to real or financial assets. Panics are characterised by stampede, race for changing real or financial assets into money. Crash is the final outcome of the process preceded by panic and mania.
Compared to these phases, a model is summarised in five different stages which are, displacement, boom, overtrading, revulsion and tranquillity.
The crisis starts out with an exogenous shock, significantly large and pervasive, to the macroeconomic system. Minsky calls it “displacement”. The source of displacement can be an invention, political event, war, crop failure, policy change and etc. Displacement alters profit opportunities in at least one sector of the economy. This sector could be new or already in existence.
In the boom phase, money supply enlarges through the expansion of bank credit. The third stage is called “overtrading” and refers to the process of ever increasing investment and income. Overtrading involves: speculation, buying for resale rather than use or income. As individuals and firms see others making profit, they tend to join the trend.
The fourth stage is called “revulsion”. As the boom continues, interest rates, prices, profits, velocity of circulation, all continue to increase. Gradually or suddenly with the persistence of distress, speculators realise that the market cannot go higher. The crisis looms. This realisation may turn into a stampede, race of liquidation. Bankruptcies, insolvent banks, unearthing of a fraud or a swindler are some specific signals. The final stage is called “tranquillity”. The panic continues to feed itself, until the market realises that sufficient money will be available to meet the demand for cash (despite the fact that panic cannot go on forever) (Saqib, 2002, p.12).
Although all above mentioned models have made serious contributions to the literature, all have some deficiencies. There is no hard and fast rule about the timing of crises. It is surprising how long basically unsustainable situations can endure, notably if an election is in sight. It is clear that the more the crisis is postponed, the worse the balance sheet and the larger the fallout, once it does happen.
3. Measuring Financial Crises
During 1995-2001, over a dozen emerging market experienced severe financial crises. Numerous empirical studies seek to identify causes for past crises and
early-Elif Çepni and Nezir Köse / Central Bank Review 1 (2006) 37-64 49
warning indicators that might be used to avoid crises. What has changed in the economic environment, are these crises different from earlier crises, what are the indicators of vulnerability which could be used as leading indicators of crises, is it possible to predict crises and many more questions arose and are tried to be answered by many studies.
Goldstein (1996), Kaminsky et al. (1997), and Goldstein and Reinhart (1998) are at the forefront of this effort, with several other papers.
The presumption behind this research effort is that crises should be foreseen. Stemming from the predictions of first, second and third generation models, a fairly large number of empirical studies on the determinants of currency crisis have emerged. These studies can be classified under two categories. First category investigates the determinants of crises in a single country analysis. While the second focuses on multi-country analysis. Generally the country specific studies suggest that domestic macroeconomic indicators play a key role in undermining an exchange rate peg.
Domestic credit growth, exchange rate misalignments, foreign exchange reserve losses, debt structure, expansionary fiscal and monetary policies are some of the leading indicators suggested by these studies.
The definition of the crisis changes from study to study. Table 2 (single country literature) and Table 3 (multiple country literature) in the annexes summarize the studies showing indicators of currency crises in single country literature and in multiple country literature.
If crises are first generation or second generation, we can use theory and past experience to identify these weaknesses that make attacks possible and attempt to estimate models to be used for forecasting.
Since these weaknesses are necessary but not sufficient conditions for a crisis to occur, the forecasting properties of such models can be misleading. If we use the terminology of statistical tests, leading crisis indicators face type I errors when they fail to predict attacks that occur and type II errors when they predict attacks that do not occur.
There are weaknesses of current methods. Today various methodologies and variables are used to characterize the period preceding currency crises and to assess the probability of such crises.
Elif Çepni and Nezir Köse / Central Bank Review 1 (2006) 37-64
50
Generally the classification of the main indicators by category used in empirical works is as follows:
Current account: real exchange rate, current account balance, trade balance, exports, imports, terms of trade, price of exports, savings, and investment.
International variables: foreign real GDP growth, interest rates, and price level. Financial liberalization: credit growth, change in the money multiplier, real interest rates, and spread between bank lending and deposit interest rates.
Other financial variables: central bank credit to the banking system, gap between money demand and supply, money growth, bond yields, domestic inflation, "shadow" exchange rate, parallel market exchange rate premium, central exchange rate parity, position of the exchange rate within the official band, and M2/international reserves.
Real sector: real GDP growth, output, output gap, employment/unemployment, wages, and changes in stock prices.
Fiscal variables: fiscal deficit, government consumption, and credit to the public sector.
Institutional/structural factors: openness, trade concentration, dummies for multiple exchange rates, exchange controls, duration of the fixed exchange rate periods, financial liberalization, banking crises, past foreign exchange market crises, and past foreign exchange market events.
Political variables: dummies for elections, incumbent electoral victory or loss, change of government, legal executive transfer, illegal executive transfer, left-wing government, and new finance minister; also, degree of political instability (qualitative variable based on judgment) (Kaminsky et al., 1998).
Signal approach monitors the evolution of a number of economic variables. When one of these variables deviates from its normal level beyond a certain “threshold” value, this is taken as a warning signal about a possible currency crisis within a specified time period time.
4. Data and Empirical Results
The list of the variables used in this study will be as follows:
1. The Weighted Index of Speculative Pressure (ISP): In the currency crisis literature (especially by following Kaminsky, Lizondo and Reinhart (1998)) Index
Elif Çepni and Nezir Köse / Central Bank Review 1 (2006) 37-64 51
of Speculative Pressure (ISP) is used to define currency crisis. The same way will be followed in this study as well.
ISP is a weighted average of three variables namely, quarterly percentage change in exchange rate(e), percentage change of a headline interest rate (r) , quarterly percentage change of international reserves (ir). (ISP= w1.e + w2.r – w3..ir). (Kroska, 2000).
Eichengreen et al. showed that different weights do not have significant impact on the empirical results and to avoid a necessity to estimate weights which, ideally, would change over time, the weights are generally standardised (w1=w2 =w3 = 1) in some studies.. Alternatively in some models weights are taken as inversely proportional to the standard deviation of each of the three variables. A period of excessive market volatility is defined as the period during which the index rises above a pre-specified threshold based on the previous n observations.
The index captures either a successful attack (a sharp devaluation), or a successful defence (the exchange rate remains unchanged but the monetary authorities deter an attack by a combination of interest rate increases and foreign market interventions), or an unsuccessful defence (all three variables move sharply).
In order to find a probability of crisis, the threshold levels must be determined. If index value exceeds the threshold level, a crisis signal is issued.
In some empirical applications, periods in which the index is above its mean by more than three standard deviations are defined as crises. In some of them crises defined with 2 standard errors. When the threshold is lowered, the number of warning signals misses real crises but detects milder events. If we decrease бn the size of the deviation of index from its sample mean, more foreign exchange market tensions could be labelled as crises.
ISP = σ − ∆ σ + ∆ σ − ∆ − − 1 * 1 * 1 * 1 1 1 irt ir ir t r t e r r e e
σ e is the standard deviation of the exchange rate, σ r is the standard deviation of the interest rate and σ ir is the standard deviation of the international reserves.
If the ISP ≥ µn + t(n,q). бn than this is taken as a crisis. Where µn is the sample mean and бn is the sample standard deviation of the ISP based on the previous n observation (Kroska, 2000).
Elif Çepni and Nezir Köse / Central Bank Review 1 (2006) 37-64
52
In this study, periods in which the index is above its mean by more than two standard deviations are defined as crises. The weighted ISP values can be found in Table 1 of the appendix.
2. Real Exchange Rate (RER): (CPI of USA/ CPI of Turkey) (Nominal Exchange rate).
Data is obtained from “International Financial Statistics” CD-ROM produced by the IMF.
3. Industrial Production Index of Turkey (INDTR): Seasonally adjusted industrial production index of Turkey whose base year is 1995 (1995=100) was obtained from IFS CD-ROM of the IMF.
4. Foreign Direct Investment as a ratio of the Gross Domestic Product (FDIGDP): Foreign Direct Investment shows the inflow to Turkey not reflects the “net” value and it is expressed as (FDI/GDP)*100.
5. Current Account as percentage of GDP (CAGDP): Data is obtained from the electronic data delivery system of the Central bank of Turkey (CBRT).
6. M2 as a ratio of international reserves (M2IR): Data was obtained from the CD-ROM of International Statistics of the IMF.
7. Terms of Trade (TT): It is calculated as “exports price index/imports price index” and data was obtained from the electronic data delivery system of the CBRT.
8. Industrial Production Index of the European Union (15 Countries) (INDEU): Seasonally adjusted industrial production index whose base year is 1995 (1995=100) was obtained from Eurostat.
9. Real Credit Growth (RCG): First the value of credits (public+private) was found and than by using Consumer Price Index of 1987 the nominal values of credits were corrected for the inflation. RCG= Total Credits/CPI (1987).
10. Foreign Direct Investment +Current Account (FDICA): Data obtained from the electronic data delivery system of the CBRT.
11. Trade Balance (TB): (Export-Import): Data was obtained form the CD-ROM of International Statistics of the IMF.
Elif Çepni and Nezir Köse / Central Bank Review 1 (2006) 37-64 53
5. The Granger Causes of the Index of Speculative Pressure
A better term for Granger causality is precedence. Therefore, this test can be used for determining preceding indicators of ISP. We may also use the results of Granger causality for evaluating forecasting performance of ISP since it is concerned with one-ahead forecast accuracy.
Sims, Stock and Watson (1990) have shown that nonstandard distribution must be applied for sequential testing procedure if the variables are nonstationary. Therefore, Granger causality test is valid only approximately or not be valid at all for nonstationary variables. To overcome this problem, Toda and Yamamoto (1995) proposed an alternative approach for testing coefficient restrictions of a level (possibly nonstationary) model. Their procedure considers a lag augmented or modified Wald (M-Wald) test which has conventional asymptotic chi-square (χ²) distribution when a VAR (p+dmax) is estimated where dmax is the maximal order of integration suspected to occur in the system. In other words, this lag augmentation procedure provides standard asymptotic although the time series have integration/cointegration properties, and therefore, can be applied without a priori information about the presence (absence) and location of unit roots.
In this study, we have investigated causal relations between ISP and other variables using Toda-Yamamoto (1995) approach. This method is applicable under different scenarios such as the VAR’s may be stationary, integrated of an arbitrary order, or cointegrated of an arbitrary order. By relying on this property, we have not performed an investigation on the existence of unit roots or cointegrating relations among relevant variables. The results of Granger causality test are given in Table 5.1.
Table 5.1
The Results of Pairwise Granger Causality Tests (Toda-Yamamoto Approach)
Null Hypothesis Lag Wald p-value
RER does not Granger Cause ISP 8 17.7551 0.0231 INDTR does not Granger Cause ISP 1 2.9097 0.0880 FDIGDP does not Granger Cause ISP 1 0.0696 0.7919 CAGDP does not Granger Cause ISP 4 20.5260 0.0004 M2IR does not Granger Cause ISP 2 14.4722 0.0007 TT does not Granger Cause ISP 5 10.9933 0.0515 INDEU does not Granger Cause ISP 2 0.6849 0.7100 RCG does not Granger Cause ISP 1 16.0826 0.0001 CAFDI does not Granger Cause ISP 4 16.9033 0.0020 TB does not Granger Cause ISP 2 7.3014 0.0260 Optimal lag length is determined by AIC.
Elif Çepni and Nezir Köse / Central Bank Review 1 (2006) 37-64
54
CAGDP, M2IR, RCG, CAFDI are Granger causes of ISP at %1 level. There is also Granger causality from RER and TB to ISP at %5 level. Since the hypothesis of Granger non-causality from INDTR, FDIGDP and INDEU to ISP cannot be rejected at the conventional level of significant, we conclude that these variables can be excluded from VAR model for forecasting of ISP.
6. Forecasting of ISP from VAR Model
A crucial aspect of empirical research based on the vector autoregressive (VAR) model is the choice of the lag order, since all inference in the VAR model is based on the chosen lag order. Hafer and Sheehan (1989) find that the accuracy of forecasts from VAR models varies substantially for alternative lag lengths. Lutkepohl (1993) indicate that selecting a higher order lag length may lead to a higher mean square forecast errors and choosing a lower lag order may result with the autocorrelated errors. To overcome this issue, in a recent paper of Granger and Jeon (2004), they consider the model selection procedures and compare their forecasting performance by employing a set of monthly US macro series in the level and first difference forms. They suggest the equally weighted combination of the forecasts obtained through AR(4) and models specified via Schwarz Criterion (SC) and Akaike Information Criterion (AIC).
In this study, we consider the forecasting performances of level-VAR models whose lags are chosen by two information criteria (AIC, SC) and a sequential testing procedure (M-Wald). Since SC never choose a longer lag length than AIC for any reasonable and two model selection procedures are used as the most popular criteria for estimating order of VAR model, we compare ISP forecasting performance of level-VAR models whose lags are chosen by these criteria.
In M-Wald procedure, optimal lag-length is acquired by testing down from a maximum 5-lag system until any one of the null hypothesis is rejected at the 5 percent level. After this sequential testing procedure being applied, the appropriate lag is chosen as 2 in level-VAR model. On the other hand, lag length are determined as 1 and 5 by SC and AIC respectively.
Root Mean Square Error (RMSE), Mean Absolute Error (MAE) and Theil Inequality Coefficient (TIC) are used to compare the VAR(1), VAR(2) and VAR(5) models in terms of their ISP forecast performances. These criteria are calculated for the in-sample and shown in Table 6.1.
Elif Çepni and Nezir Köse / Central Bank Review 1 (2006) 37-64 55
Table 6.1
Forecast Error Statistics of Competing Models
Models Root Mean Square Error Mean Absolute Error Theil Inequality Coefficient
VAR(1) 1.7508 1.2846 0.4732
VAR(2) 1.5774 1.1862 0.3979
VAR(5) 1.4029 1.1322 0.3374
By relying on forecast error statistics, it can be said that the VAR(5) model in level produces the most accurate forecast for ISP. We can improve our forecasts by combining the VAR models which have difference lag. We consider only linear combination of forecasts here. We consider the combination of forecasts using the following regression allowing assumption of unbiased forecasts with uncorrelated forecast error: t t , 3 3 t , 2 2 t , 1 1 0 t
w
w
f
w
f
w
f
ISP
=
+
+
+
+
ε
where f1t, f2t, f3t are forecasts generated by VAR(1), VAR(2), VAR(3). Combined forecasts are computed from the approaches mentioned above. Forecast error statistics are found for the in-sample period and summarized in Table 6.2.
Table 6.2
Combined Forecasts
Combined Models Root Mean Square Error Mean Absolute Error Theil Inequality Coefficient
VAR(1)+VAR(2) 1.5718 1.1826 0.4030
VAR(1)+VAR(5) 1.3977 1.1078 0.3450
VAR(2)+VAR(5) 1.3978 1.1084 0.3451
VAR(1)+VAR(2)+VAR(5) 1.3976 1.1079 0.3450
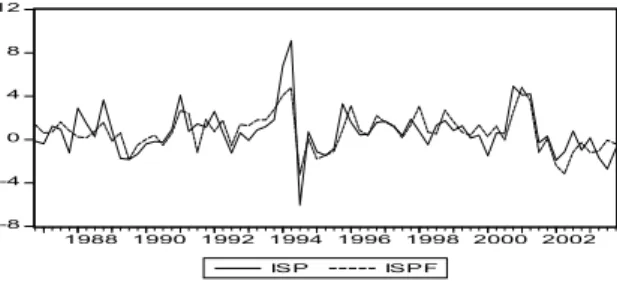
The results obtained by combining the VAR(1), VAR(2) and VAR(5) models show that the use of the combination of these models generate relatively better forecast values than all the other single models. Combination of these models produces almost 0.38% reduction in RMSE relative to the best single model (i.e., VAR(5) model) forecasts. Actual values (ISP) and forecasts (ISPF) obtained from combined VAR models are graphed in Figure 6.1
Fig. 6.1. Actual and Forecast Values of ISP
-8 -4 0 4 8 12 1988 1990 1992 1994 1996 1998 2000 2002 ISP ISPF
Elif Çepni and Nezir Köse / Central Bank Review 1 (2006) 37-64
56
7. Predicting Currency Crises Probabilities: Dynamic Logit and Probit Models We based our definition of crises on %5 threshold point whose value is 4.04. ISP is expressed as a binary variable and named ISP* it is determined by the following threshold values: ≤ > = 04 . 4 ISP 0 04 . 4 ISP 1 ISP *
The observations for 1991.Q1, 1994.Q1, 1994.Q2, 2000.Q4, 2001.Q1 and 2001.Q2 are larger than threshold value. Thus, dependent variable ISP* is equal to 1 for 6 observations, 0 otherwise.
To forecast currency crises probabilities, we estimated logit and probit models using the lagged independent variables, which are RER, CAGDP, TB, M2IR, RCR, CAFDI. Since the lagged explanatory variables RCR and CAFDI are not statistically significant at 10% level for all lags (when the maximum lag length is selected as 5), they are eliminated in our models. While RER and M2IR are statistically significant for only lag one, CAGDP and TB are obtained statistically significant for only lag three at %10 level. Estimation results of logit and probit models are given in Table 7.1.
Table 7.1
Estimation Results of Logit and Probit Models
Dependent Variable: ISP*
Sample (adjusted): 1985Q4 2003Q4 Logit Model
Variable Coefficient z-Stat.
RERt-1 -0.000030 -2.466175
CAGDPt-3 -1.335922 -1.847269
TBt-3 -0.001964 -2.285944
M2IRt-1 0.813738 1.826321
Probit Model
Variable Coefficient z-Statistic
RERt-1 -0.000016 -2.681253
CAGDPt-3 -0.725518 -1.821190
TBt-3 -0.001041 -2.430522
M2IRt-1 0.454529 1.894993
Table 7.2 shows the observed and predicted values from the logit and probit models when the success cutoff point is equal to 50%. The logit model is more effective at predicting 0’s than the probit model. Nevertheless, two models have
Elif Çepni and Nezir Köse / Central Bank Review 1 (2006) 37-64 57
same percent accuracy at predicting 1’s. The adjusted count R2 is equal to 0.80 for the logit model whereas 0.67 for the probit model.
Table 7.2
Goodness of Fit Statistics
The Results of Logit Model The Results of Probit Model
Estimated Equation Estimated Equation ISP*=0 ISP*=1 Total ISP*=0 ISP*=1 Total
P(ISP*=1)<=0.5 67 1 68 P(ISP*=1)<=0.5 66 1 67 P(ISP*=1)>0.5 0 5 5 P(ISP*=1)>0.5 1 5 6 Total 67 6 73 Total 67 6 73 Correct 67 5 72 Correct 66 5 71 % Correct 100 83.33 98.63 % Correct 98.51 83.33 97.26
Adj. Count R2=0.80 QSP=0.04092 Adj. Count R2=0.67 QSP=0.04329
We also calculate a summary measure of goodness of fit for currency crises based on a suggestion by Brier (1950). Brier’s quadratic probability score is calculated as
∑
= − = T 1 t 2 * * ISP ) Pˆ IS ( T 2 QSPwhere
IS
Pˆ
t* stands for estimated probability of currency crises at time t and T is sample size. Note that QSP is scaled so that it lies between 0 and 2. QSP acts as a rough analogue of RMSE, with value of QSP close to 0 indicating greater accuracy of forecast (Kumar et al., 2003). The QSP values for logit and probit model in %5 crises definition are calculated as 0.04092 and 0.04329 respectively. Comparing the goodness-of-fit of logit and probit models in sample, it is evident that the former is better in all cases. Therefore, logit model is preferable for the prediction of currency crises in terms of probability. The probabilities obtained by the probit model are given in Table7.3. In the logit model out of 68 no crisis period 67 and out of 5 crisis period 5 were predicted successfully.Elif Çepni and Nezir Köse / Central Bank Review 1 (2006) 37-64 58
Table 7.3
The Probabilities of Currency Crises Obtained from Logit Model
Periods Probabilities of crises Periods Probabilities of crises Periods Probabilities of crises 2001Q1 0.998641 1993Q3 0.003936 1994Q4 0.000012 1994Q1 0.985230 1986Q4 0.002470 2003Q1 0.000010 1994Q2 0.919430 1993Q2 0.001744 1995Q4 0.000006 2000Q4 0.748343 1987Q1 0.001665 1997Q2 0.000003 2001Q2 0.674739 1992Q1 0.001643 1999Q3 0.000003 1991Q2 0.475442 1997Q4 0.001391 1988Q4 0.000002 2001Q3 0.299383 2003Q3 0.001154 1989Q1 0.000000 1996Q3 0.283900 1996Q1 0.000959 2003Q2 0.000000 1991Q3 0.144769 1992Q4 0.000783 1995Q3 0.000000 1991Q1 0.054221 1996Q2 0.000680 2002Q4 0.000000 2003Q4 0.043525 1991Q4 0.000426 1989Q2 0.000000 1992Q2 0.041749 1987Q3 0.000413 2001Q4 0.000000 1993Q4 0.023316 1987Q2 0.000358 1989Q4 0.000000 2000Q1 0.020545 1994Q3 0.000311 1999Q4 0.000000 1992Q3 0.019561 2000Q2 0.000270 2002Q3 0.000000 1993Q1 0.018197 1998Q2 0.000232 1989Q3 0.000000 1999Q1 0.017031 1997Q3 0.000169 2002Q2 0.000000 1997Q1 0.012753 1996Q4 0.000163 1995Q1 0.000000 1988Q3 0.008771 1999Q2 0.000139 1995Q2 0.000000 1998Q1 0.008129 1990Q2 0.000083 2002Q1 0.000000 1990Q4 0.007915 1988Q1 0.000075 1985Q4 0.000000 1987Q4 0.007488 1990Q3 0.000040 1986Q1 0.000000 1998Q3 0.007241 1988Q2 0.000031 1986Q2 0.000000 1998Q4 0.006564 1990Q1 0.000013 1986Q3 0.000000 2000Q3 0.006537 8. Conclusion
Currency crises are formidably expensive; even more so is a history of recurrent crises. The costs arrive in three ways: a substantial increase in public debt associated with the crises, a loss of output and distributions, and the possibility of socially controversial redistribution of income and wealth.
In currency crises, because the government will bail out banks and often even companies, public debt increases substantially and with those future tax liabilities. The deterioration in public finance also arises from a period of high interest rates in
Elif Çepni and Nezir Köse / Central Bank Review 1 (2006) 37-64 59
the run up to the crises and in the stabilisation case. It will also arise from the fall in output and hence tax revenues in the crises period. Moreover, the increases in debt may itself bear the seeds of future crises if it occurs in a situation where the government does not have the ability to meet higher debt service burden by taxation or reduction in spending. There is always a large loss of reserves, which are sacrificed during the defence part of the crisis. A crisis deteriorates a country’s credit rating as well (Dornbusch, 2001).
Turkey is facing with currency crises more frequently especially after liberalizing its financial sector in the post 1980 period. From this perspective it is very important to analyze whether Index of Speculative Pressure and early warning indicators are informative or not for Turkey.
In this study first we find the main determinants of the ISP index by using Granger Causality Test and then we tried to forecast the ISP index by using VAR model and then instead of levels by using threshold values we attached 1 and 0 values to index numbers and obtained the probabilities of having crises and finally we compared the performance of dynamic logit and probit models for the prediction of the probability of a crisis.
This study shows that current account/GDP ratio, M2/international reserves ratio, real credit growth and current account/foreign direct investment ratio have greater impact on the ISP index. Also it shows that the combination of VAR(1)+VAR(2)+VAR(5) models give us better forecast values then other single models (for the prediction of level values).
After predicting the probabilities of crises (by using probit and logit models) in the final step we compared the goodness of fit values obtained from both dynamic logit and probit models. This comparison showed that logit model is generating better performance than the probit in forecasting currency crises in Turkey. The probabilities of currency crises obtained from logit model are given in Table.7.3.
The most important contribution of the study is to show that the logit model has a very high performance in the prediction of Turkish currency crises. It can be used to foresee forthcoming currency crises.
Also the forecast of the ISP (as a level) is giving very successful results. Figure 6.1 shows that the ISP and forecasted ISP are almost moving together or very close to each other.
Elif Çepni and Nezir Köse / Central Bank Review 1 (2006) 37-64 60
Foreseeing currency crises is of vital importance especially for countries that are facing with such crises more frequently. It seems “how crises can be prevented is more important than “how to manage a crisis once it occurs”.
But it seems near-impossible to create models that neither miss too many crises that have occurred nor predict too many that never happen. This makes some economists highly sceptical of all early-warning indicators. Richard Portes, an economist at the London Business School, calls them “one of the most egregious examples of data-mining in all of empirical economics”.
That may be too harsh. If nothing else, the models help policymakers to keep an eye on indicators that have proved prescient in the past and give traders yet another number to track. But, as the University of Maryland’s Ms. Reinhart admits: “It is naive to think that these things can help predict the exact timing of a crisis.” For investors and traders such models should, at most, be an extra tool, not a substitute for country analysis and market judgment. As another economist involved admits: “They are fancy tools, but I wouldn’t trade on them.” (The Perils of Prediction, 1998).
Elif Çepni and Nezir Köse / Central Bank Review 1 (2006) 37-64 61
References
Begg, D., Halpern, L. and Wyplosz C. 1999. Monetary and Exchange Rate Policies, EMU and Central and Eastern Europe, Forum Report of the Economic Policy Initiative no.5, Eastwest Instıtute. Corsetti, G., Pesenti, P. and Roubini, N. 2001. The Role of Large Players in Currency Crises, ed
S. Edwards and A. Frankel, National Bureau of Economic Research, The University of Chicago Press.
Çepni, E. 2003. The Economy of Turkey in Retrospect, Beta Basım Yayım A.Ş.
Dornbusch, R. 2001. A Premier on Emerging Market Crises, Preventing Currency Crises in Emerging Markets, ed S. Edwards and J. A. Frankel, National Bureau of Economic Research, The University of Chicago Press.
Eichengreen, B. 2002. Financial Crises and What to do About Them, Oxford University Press, 2002. Fane, G. 2000. Capital Mobility, Exchange Rates and Economic Crises, Edward Elgar Publishing
Limited.
Global Finance: Fix or Float. January 28, 1999. The Economist Survey.
Granger, G.W.J. and Jean, Y. 2004. Forecasting Performance of Information Criteria with Many Macro Series, Journal of Applied Statistics 31,1227-1240.
Hafer, R.W. and Sheehan R.G. 1989. The Sensitivity of VAR Forecasts to Alternative Lag Structures. International Journal of Forecasting. 5: 399 - 408.
Kaminsky, G., Lizondo, S. and Reinhart, C. 1998. Leading Indicators of Currency Crises, IMF Staff Papers,Vol.45, No.1.
Kroska, L. 2000. Assessing Macroeconomic Vulnerability in Central Europe, European Bank for Reconstruction and Development Working Paper No.52.
Krugman, P. 1997. Currency Crises, http://web.mit.edu/krugman/www/crises, 06.03.2003.
1999. Balance Sheets, The Transfer Problem and Financial Crises, http://web.mit.edu /krugman/www/FLOOD, 10.08.2005.
Kumar, M., Moorthy U. and Perraudin W. 2003. Predicting Emerging Market Currency Crashes. Journal of Empirical Finance. 10: 427–454.
Lütkepohl, H. 1993. Introduction to Multiple Time Series, Second Edition, Springer-Verlag, Berlin. Policy Reassessment in Light of the end-2000 Financial Crisis. 2001. OECD Economic Surveys;
Turkey;http://www.oecd.org.
Saqib, O.F. 2002. Interpreting Currency Crises, German Institute for Economic Research Discussion Papers 303, Berlin.
Sims, C., Stock J. and Watson M. 1990. Inference in Linear Time Series Models with Some Unit Roots. Econometrica. 58: 113-144.
The Exchange Rate: Threats and Responses, Monetary and Exchange Rate Policies, EMU and Central and Eastern Europe. 1999. Forum Report of the Economic Policy Initiative, no.5, Centre for Economic Policy Research.
The Perils of Prediction. July 30, 1998. The Economist.
Toda, H. and Yamamato T. 1995. Statistical Inference in Vector Autoregressions with Possibly Integrated Processes. Journal of Econometrics. 66: 225-250.
Elif Çepni and Nezir Köse / Central Bank Review 1 (2006) 37-64 62
Appendix Table 1
The Weighted Index of Speculative Pressure
Period ISP (Weighted) Period ISP (Weighted) Period ISP (Weighted) Period ISP (Weighted) 1985.Q2 0.0225 1990Q2 -0.1800 1995Q2 -1.4633 2000Q2 0.5917 1985.Q3 -0.5463 1990Q3 -0.2300 1995Q3 -0.8274 2000Q3 0.5810 1985.Q4 0.8504 1990Q4 0.9254 1995Q4 3.2880 2000Q4 4.9133 1986Q1 -0.1264 1991Q1 4.0800 1996Q1 1.6002 2001Q1 4.1100 1986Q2 -0.4518 1991Q2 0.7714 1996Q2 0.4321 2001Q2 4.1991 1986Q3 0.0150 1991Q3 1.4492 1996Q3 0.5226 2001Q3 -0.2930 1986Q4 -0.1450 1991Q4 1.1377 1996Q4 1.5947 2001Q4 0.3293 1987Q1 -0.3830 1992Q1 2.6092 1997Q1 1.7022 2002Q1 -1.8903 1987Q2 1.2304 1992Q2 0.6451 1997Q2 1.1961 2002Q2 -1.1166 1987Q3 0.9392 1992Q3 -1.2370 1997Q3 0.3785 2002Q3 0.7788 1987Q4 -1.2037 1992Q4 0.6346 1997Q4 1.8902 2002Q4 -0.9579 1988Q1 2.8989 1993Q1 -0.0513 1998Q1 0.7520 2003Q1 0.1539 1988Q2 1.4786 1993Q2 0.8940 1998Q2 -0.4680 2003Q2 -1.6636 1988Q3 0.2733 1993Q3 1.2042 1998Q3 1.3143 2003Q3 -2.7032 1988Q4 3.6460 1993Q4 1.8441 1998Q4 1.7456 2003Q4 -0.8170 1989Q1 0.8736 1994Q1 6.7920 1999Q1 0.8344 2004Q1 -1.1946 1989Q2 -1.7301 1994Q2 9.0998 1999Q2 1.2734 2004Q2 0.4442 1989Q3 -1.8215 1994Q3 -6.0236 1999Q3 0.1492 1989Q4 -1.3328 1994Q4 0.7213 1999Q4 0.4072 1990Q1 -0.3898 1995Q1 -1.1088 2000Q1 -1.4820 Mean 0.6283 Standard Deviation 2.0742 Threshold Value 4.0403
Elif Çepni and Nezir Köse / Central Bank Review 1 (2006) 37-64 63
Table 2
Indicators of Currency Crises: Single Country Literature
Study Indicator(s) Comments
Blanco and Garber (1986) (1) Domestic credit growth Very significant [Mexico, 1973-1982]
Cumby and Van Wijnbergen (1) Domestic credit growth Very significant (1989) [Argentine, 1978-1981]
Goldberg (1994) (1) Domestic credit growth; Very significant: (1), [Mexico, 1980-1986] (2) Exchange rate misalignments; (2); Significant: (3),
(3) Relative prices; (4), (5)
(4) External credit; (5) Demand for money
Pazarbaşıoğlu and Ötker (1) Domestic credit; (2) Real exchange rate; Very significant (1997) [Mexico, 1982-1994] (3) Foreign reserves; (4) Real output growth;
(5) Inflation differential; (6) Expansionary
monetary and fiscal policies
Ötker and Pazarbaşıoğlu (1) Domestic credit;(2) Budget deficit; Significant: (1)-(4) (1997) (3) Unemployment rate; for all except Denmark [1992-1993 ERM crisis: (4) Foreign price level
Belgium, Denmark, France, Ireland, Italy, Spain]
Elif Çepni and Nezir Köse / Central Bank Review 1 (2006) 37-64 64
Table 3
Indicators of Currency Crises: Multi-Country Literature
Study Indicators Comments
Frankel and Rose (1996) [Over 100 countries, 1971-1992]
(1) Debt composition [commercial bank, concessional, variable-rate, short-term, FDI, Public sector]; (2) External variables [international reserves to mothly imports, current account, external debt, real exchange rate]; (3) Domestic macroeconomic variables [government budget, domestic credit growth, real output per capita growth]; (4) Foreign interest rate; (5) Developed countries growth rate
Significant: FDI, international reserves, domestic credit growth, foreign interest rate; real exchange rate; Not significant; government budget, current account
Klein and Marion (1997) [17 countries, 1957-1990]
(1) Macroeconomic variables [real exchange rate; net foreign assets, multiple exchange rate]; (2) Structural factors [openness, geographical trade concentration]; (3) Political factors [executive transfers, coups]
Significant: real exchange rate, openness, geographical trade concentration, executive transfer
Esquivel and Larrain (1998) [30 countries, 1975- 1996]
1) Seignorage; (2) Current account balance; (3) Terms of trade shock; (4) Real Exchange rate; M2/Reserves; (5) Per capita income growth; (6) Contagion effects
Significant: seignorage, real exchange rate, terms of trade shocks, contagion, current account balance, international reserves, income growth
Kaminsky, Lizondo, Reinhart (1998) [20 countries, 1970-1995]
(1) International reserves;(2) Domestic credit; (3) Domestic inflation; (4) Real exchange rate; (5) Credit to public sector; (6) Trade balance; (7) Money growth; (8) Fiscal deficit; (9) Export performance; (10) Real GDP growth
Very significant: (1)-(5); Significant: (6)-(10)