Investigating academic veterinarians’ knowledge of biostatistics:
a web-based survey
Gökhan OCAKOĞLU
1, İlker ERCAN
1, Mehmet Onur KAYA
2, Ender UZABACI
3, Fatma Ezgi CAN
1 1Department of Biostatistics, Faculty of Medicine, Uludag University, Bursa; 2Department of Biostatistics, Faculty of Medicine,Bezmialem Vakif University, Istanbul; 3Department of Biostatistics Faculty of Veterinary Medicine, Uludag University, Bursa/Turkey.
Summary: The primary aim of our study, web-based survey, is to gain an understanding of veterinarians’ statistical knowledge and how it varies by focus area. The secondary aim is to address the following question: when should biostatistics be taught in veterinary education? A total of 155 veterinarians from 41 countries participated in this study. The results indicate that while veterinarians place an emphasis on biostatistics education, the majority state that biostatistics education should be taken both at the undergraduate and postgraduate level and the participants also believe that taking a biostatistics course is useful for their occupation. In biostatistics education, the topic of sampling, which plays a significant role at the planning stage of any study, should be considered particularly important. A biostatistics education should also emphasize the necessity of consulting to a biostatistician when planning a study.
Key words: Biostatistics course, biostatistics knowledge, veterinary medicine, web-based survey.
Akademik veteriner hekimlerin biyoistatistik bilgisinin incelenmesi: web tabanlı bir araştırma
Özet: Web-tabanlı çalışmamızın birincil amacı veteriner hekimlerin istatistik bilgisini anlamak ve istatistik bilgisinin çalışma alanlarına göre nasıl değiştiğini incelemektir. İkinci amaç şu soruya yanıt aramaktadır: Veteriner hekimliği eğitiminde biyoistatistik ne zaman öğretilmelidir? Çalışmaya 41 ülkeden 155 veteriner hekim katılmıştır. Sonuçlar veteriner hekimlerin biyoistatistik eğitimine önem verdiğini, bu eğitimin hem lisans hem lisans üstü seviyesinde verilmesi gerektiğini ayrıca biyoistatistik dersi almanın meslekleri için yararlı olduğuna inandıklarını göstermektedir. Biyoistatistik eğitiminde, çalışmaların planlama aşamasında önemli bir rol oynayan örnekleme konusu özellikle dikkate alınmalıdır. Biyoistatistik eğitiminde ayrıca bir çalışmanın planlanırken biyoistatistik uzmanına danışılmasının gerekliliği vurgulanmalıdır.
Anahtar sözcükler: Biyoistatistik bilgisi, biyoistatistik dersi, veteriner hekimlik, web-tabanlı araştırma.
Introduction
Statistics is required at every stage of research, from planning to completion, in order to produce scientifically important and reliable results [11]. Therefore, researchers should have at least a basic understanding of statistics. In addition to basic statistical knowledge, researchers should also be aware that specific statistical methods related to study design and their own study field could help the progression of their career.
One of the most important considerations in this context is the need on the part of researchers to obtain a consultation from a biostatistician when necessary [5]. This consideration is important because researchers sometimes gain self-confidence by using user-friendly statistical software. Moreover, this newfound confidence can bring about a series of mistakes [2, 11].
Many of the articles we read are accompanied by statistics, and the most cogent information is usually contained in the appropriate journals; however, the
usefulness of these journals relies on the reader having a proper understanding and knowledge of the statistical methodology underlying study design and data analysis [16, 18]. To read, understand, evaluate, and contribute to the biomedical literature, the veterinarian in practice will require more insight into statistical methods [3].
The primary aim of this study, an international web-based survey, is to gain an understanding of veterinarians’ statistical knowledge and how it varies by focus area (basic, preclinical, clinical, zootechnics and animal nutrition and food hygiene and technology). The secondary aim is to address the following question: when in veterinary education should biostatistics be taught?
Materials and Methods
In the present study, veterinarian data were obtained by a web-based survey. The participants were selected randomly from the PubMed database for the years 2005– 2013 using the keywords “veterinary school/faculty of
veterinary/school of veterinary medicine/school of veterinary and veterinary faculty” by screening veterinary journals. The participants were invited to participate in the survey via e-mail. The participating veterinarians were directed to the survey web page, which was designed for this study, and their responses were recorded in a web-based database.
In the first part of the questionnaire the subjects were asked whether a biostatistics course would be useful for their future careers (completely disagree: 0; completely agree: 4), at which semester or semesters biostatistics should be administered, and how much importance they placed on biostatistics (not important: 0; very important: 10).
In the second section of the questionnaire, the subjects were asked which statistical methods, tests and techniques they knew out of 54 methods and techniques. Only their general knowledge about the procedures was assessed. In the questionnaire, methods, tests and techniques were grouped as “general statistics knowledge”, the topics from undergraduate courses were defined as “the topics included by curriculum”, and the subjects that were not taught in undergraduate courses were classified as “the topics out of curriculum”. Subgroup statistical methods, tests and techniques were classified as follows: “parametric tests”, “non-parametric tests”, “multivariate methods”, “sampling methods” and “survival analysis methods”. The statistics knowledge of each participant was converted to a ratio by dividing the number of methods, tests and techniques that the participant knew by the total number of methods, tests and techniques in that subject group. The survey can be reached directly by entering the internet address (URL:http://www.uludag biyoistatistik.com/survey/veterinary-survey.htm).
In this study, the Shapiro-Wilk normality test was applied to determine whether the variables were normally distributed. For comparison, the Kruskal-Wallis test, the Mann-Whitney U test, the Pearson Chi Square and Fisher-Freeman-Halton tests were applied using a significance level of α=0,05. After post-hoc comparisons, a Bonferroni correction was applied and the resulting significance level was taken into consideration. Due to the use of nonparametric tests for comparison, data were represented with median (minimum-maximum) values for each subject group.
Results
Invitation e-mails were sent to participants via turboSMTP (by Delivery Tech Corp.) smtp mail server. Of the 6567 e-mail invitations sent, 1827 were rejected by the server due to e-mail addresses being either incorrectly spelled or no longer valid, leaving an estimated 4740 email recipients. Those who responded with the intention of participating numbered 207,
reflecting a response rate of 4.38%. In addition 207 participants also reflect the rate of 42.24% among who opened (n=490) the invitation e-mail. Of the 207 participants, 52 were excluded from the study due to their inappropriate completion of the survey.
A total of 155 veterinarians from 5 continents and 41countries [from Africa (n=17, 10.97%): Cameroon(1), Egypt(3), Ethiopia(1), Nigeria(7), South Africa(3), Tunisia(1), Zimbabwe(1); from America (n=20, 12.90%): Argentina(1), Brazil(6), Colombia(2), Mexico(2), USA(9); from Asia (n=42, 27.10%): China(4), India(3), Iran(9), Pakistan(5), South Korea(2), Taiwan(1), Thailand(5), Turkey(13); from Europe (n=68, 43.87%): Austria(1), Belgium(5), Bulgaria(1), Croatia(2), Czech Republic(2), Denmark(2), Finland(2), France(3), Germany(2), Greece(4), Italy(20), Lithuania(1), Netherlands(2), Poland(5), Portugal(1), Serbia and Montenegro(1), Slovenia(1), Spain(14), Ukraine(1), United Kingdom(8); from Oceania (n=8, 5.16%): Australia(8)] were participated in our study. Of those, 88 were academic staff, including 37 assistant professors, 28 associate professors and 23 full professors. Rest of the participants who had also academic career but were not academic staff distributed as follows: [Doctor of Philosophy (n=35, 22.60%), Doctor of Philosophy student (n=27, 17.40%), Master of Science (n=4, 2.60%), Master of Science Student (n=1, 0.60%). Mean age of the participants were 40.93 ± (10.03) with the gender distribution of female: 49 (31.60%) / male: 106 (68.40%). Median work experience was 16(4-50) years.
The distribution of participant responses by the time periods in which they were administered a biostatistics course as follows: 42.60% (n=66) of the participants stated that they administered both at the undergraduate & postgraduate level, 32% (n=50) stated that they administered at the postgraduate level, 21.30% (n=33) stated that they administered at the undergraduate level and 3.90% (n=6) stated that they never administered a biostatistics course. Each of the participants who did not pursue a biostatistics course (3.90%, n=6) stated that a biostatistics course should be administered. Of these participants, 16.70% (n=1) stated that a course should be offered at the undergraduate level, 50% (n=3) stated that a course should be offered at the postgraduate level, and 33.30% (n=2) stated that one should be offered both at the undergraduate and postgraduate levels.
The distribution of participant responses by the preferred time periods for administering biostatistics course are distributed as follows: 56.80% (n=88) stated that biostatistics course should be administered both at the undergraduate and postgraduate level, 29% (n=45) stated that the course should be administered only at postgraduate period, for 13.50% (n=21) preferred choice was undergraduate level and 0.60% (n=1) stated that no need to administer biostatistics course.
It was found that SPSS is the most preferred statistical software used for statistical analysis. The complete order of software preference was found as follows respectively: SPSS 32.90(n=51), SAS 21.90%(n=34), R %11(n=17), STATA 7.10%(n=11), STATISTICA 7.10%(n=11), MS EXCELL %4.50(n=7),
MINITAB 3.90%(n=6), GRAPHPAD PRISM
3.20%(n=5), STATISTIX 1.90(n=3) and other softwares 6%(n=10) (EPI INFO, GENSTAT, GRAPHPAD INSTAT, INFOSTAT, MEDCALC, OPEN EPI, PAST, PHYLIP, SIGMASTAT, STATGRAPHICS).
The comparison of usefulness of taking a biostatistics course demonstrated that there was no difference between academic (4[0-4]) and non-academic staff (4[0-4]) responses (p=0.830). The participants were agreed that taking a biostatistics course would be useful
for their future careers. The comparison of the importance of biostatistics in veterinary science also demonstrated that participants also agreed on the importance of biostatistics. There was no difference between academic (9[2-10]) and non-academic staff (9[1-10]) responses (p=0.221). Regardless the academic status all the participants stated that “biostatistics course would be useful for their future careers” with median point 4(0-4). Furthermore all participants also agreed on the importance of biostatistics in veterinary science with the point 9(1-10).
The statistical knowledge levels of veterinarians by research area and statutes were given in Table-1, Table-2 respectively. Attitudes about veterinarian use of biostatistical consultation are given in Table-3.
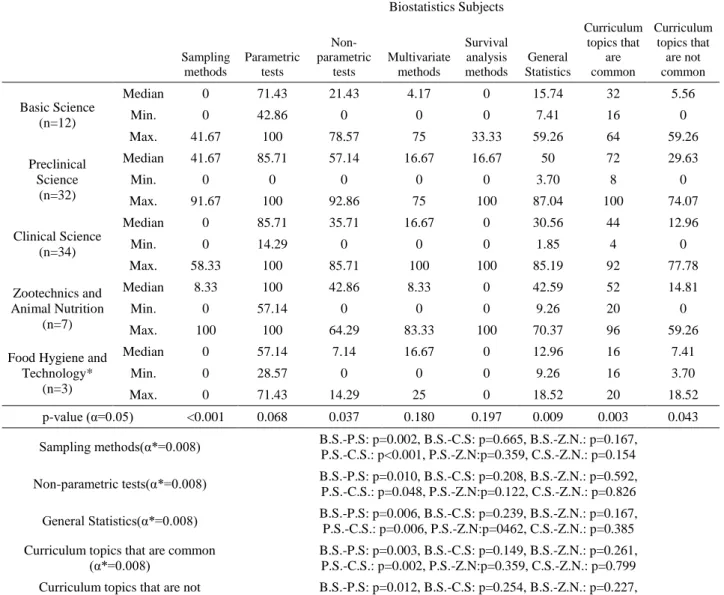
Table 1. Comparisons of the level of biostatistics knowledge possessed by academic staff according to research area Tablo 1. Araştırma alanlarına göre akademik personelin sahip olduğu biyoistatistik bilgi düzeyinin karşılaştırılması
Biostatistics Subjects Sampling methods Parametric tests Non-parametric tests Multivariate methods Survival analysis methods General Statistics Curriculum topics that are common Curriculum topics that are not common Basic Science (n=12) Median 0 71.43 21.43 4.17 0 15.74 32 5.56 Min. 0 42.86 0 0 0 7.41 16 0 Max. 41.67 100 78.57 75 33.33 59.26 64 59.26 Preclinical Science (n=32) Median 41.67 85.71 57.14 16.67 16.67 50 72 29.63 Min. 0 0 0 0 0 3.70 8 0 Max. 91.67 100 92.86 75 100 87.04 100 74.07 Clinical Science (n=34) Median 0 85.71 35.71 16.67 0 30.56 44 12.96 Min. 0 14.29 0 0 0 1.85 4 0 Max. 58.33 100 85.71 100 100 85.19 92 77.78 Zootechnics and Animal Nutrition (n=7) Median 8.33 100 42.86 8.33 0 42.59 52 14.81 Min. 0 57.14 0 0 0 9.26 20 0 Max. 100 100 64.29 83.33 100 70.37 96 59.26
Food Hygiene and Technology* (n=3) Median 0 57.14 7.14 16.67 0 12.96 16 7.41 Min. 0 28.57 0 0 0 9.26 16 3.70 Max. 0 71.43 14.29 25 0 18.52 20 18.52 p-value (α=0.05) <0.001 0.068 0.037 0.180 0.197 0.009 0.003 0.043 Sampling methods(α*=0.008) B.S.-P.S: p=0.002, B.S.-C.S: p=0.665, B.S.-Z.N.: p=0.167, P.S.-C.S.: p<0.001, P.S.-Z.N:p=0.359, C.S.-Z.N.: p=0.154 Non-parametric tests(α*=0.008) B.S.-P.S: p=0.010, B.S.-C.S: p=0.208, B.S.-Z.N.: p=0.592, P.S.-C.S.: p=0.048, P.S.-Z.N:p=0.122, C.S.-Z.N.: p=0.826 General Statistics(α*=0.008) B.S.-P.S: p=0.006, B.S.-C.S: p=0.239, B.S.-Z.N.: p=0.167, P.S.-C.S.: p=0.006, P.S.-Z.N:p=0462, C.S.-Z.N.: p=0.385 Curriculum topics that are common
(α*=0.008)
B.S.-P.S: p=0.003, B.S.-C.S: p=0.149, B.S.-Z.N.: p=0.261, P.S.-C.S.: p=0.002, P.S.-Z.N:p=0.359, C.S.-Z.N.: p=0.799 Curriculum topics that are not
common(α*=0.008)
B.S.-P.S: p=0.012, B.S.-C.S: p=0.254, B.S.-Z.N.: p=0.227, P.S.-C.S.: p=0.034, P.S.-Z.N:p=0.872, C.S.-Z.N.: p=0.404
*: Food Hygiene and Technology was not included in the analysis due to insufficient sample size. B.S.:Basic Sciences, P.S.: Preclinical Sciences; C.S.: Clinical Sciences; Z.N.: Zootechnics and Animal Nutrition.
*: Besin Hijyeni ve Teknolojisi, örneklem genişliğinin yeterli olmaması nedeni ile analize dahil edilmemiştir. T.B.: Temel Bilimler, K.Ö.B.: Klinik Öncesi Bilimler, K.B.: Klinik Bilimler, Z.H.B.: Zootekni ve Hayvan Besleme.
Discussion and Conclusion
Although there are a multitude of studies (7, 8, 10, 17, 19) assessing an education in statistics and biostatistics in the field of medicine and dentistry, there are fewer studies [4, 6] in other disciplines, particularly in veterinary science.
In present study, 3.90% of the participants stated that they did not take a biostatistics course during their education. The veterinary physicians who did not take a biostatistics course remarked that a biostatistics course should be offered, which illustrates the deficiency that they feel in not being offered such a course. Most of the participants (42.60%) stated that they completed a biostatistics course both at the undergraduate and postgraduate level. Biostatistics is considered a difficult subject to teach, particularly to veterinary and medical students who do not see its direct relevance to their professional practice. In addition to this perception, it is a commonly held idea that a biostatistics education involves serious challenges (7, 8, 10, 17, 19).
In present study, the recommendations pertaining to the ideal semester for biostatistics courses focus primarily on the undergraduate and postgraduate education period. In similar studies targeted toward researchers in the fields of medicine (8, 10) and dentistry (17), most of the participants stated that biostatistics courses should be administered at both the undergraduate and postgraduate levels, although exclusively at the postgraduate level according to medical researcher opinion and exclusively at the undergraduate level according to dentistry researcher opinion. It is observed in present study that the opinions are of the same order as those found in similar studies in the literature. The main objective of undergraduates is success in statistical courses, and students, therefore, cannot gain a clear understanding of the importance of biostatistics; when they participate in research after graduation, even if only temporarily, there is considerable motivation to obtain a sufficient understanding of basic statistical methodology (1).
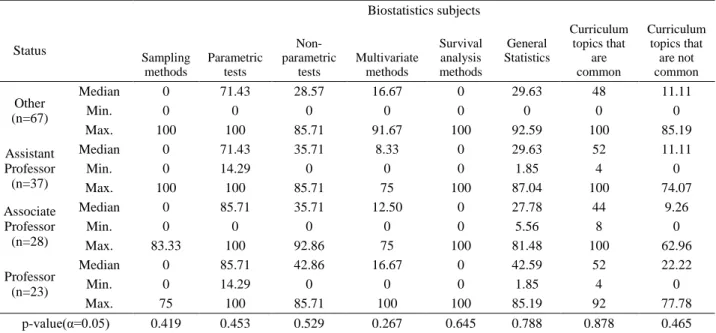
Table 2. Comparisons of the level of biostatistics knowledge by academic and non-academic statutes. Tablo 2. Akademik ve akademik olmayan statüye göre biyoistatistik bilgi seviyesinin karşılaştırılması.
Biostatistics subjects Status Sampling methods Parametric tests Non-parametric tests Multivariate methods Survival analysis methods General Statistics Curriculum topics that are common Curriculum topics that are not common Other (n=67) Median 0 71.43 28.57 16.67 0 29.63 48 11.11 Min. 0 0 0 0 0 0 0 0 Max. 100 100 85.71 91.67 100 92.59 100 85.19 Assistant Professor (n=37) Median 0 71.43 35.71 8.33 0 29.63 52 11.11 Min. 0 14.29 0 0 0 1.85 4 0 Max. 100 100 85.71 75 100 87.04 100 74.07 Associate Professor (n=28) Median 0 85.71 35.71 12.50 0 27.78 44 9.26 Min. 0 0 0 0 0 5.56 8 0 Max. 83.33 100 92.86 75 100 81.48 100 62.96 Professor (n=23) Median 0 85.71 42.86 16.67 0 42.59 52 22.22 Min. 0 14.29 0 0 0 1.85 4 0 Max. 75 100 85.71 100 100 85.19 92 77.78 p-value(α=0.05) 0.419 0.453 0.529 0.267 0.645 0.788 0.878 0.465
Table 3. A comparison of the preferred stage for biostatistical consultation based on non-academic and academic staff responses. Tablo 3. Akademik ve akademik olmayan personel yanıtlarına dayanan biyoistatistiksel konsültasyon için tercih edilen dönemin karşılaştırılması Consultation Stage Statement Number %(n) Other (n=67) Academic Staff(n=88) p-value (1) I receive consultation at the stage of designing the study (1)-(2)-(3) 4.50(3) 10.20(9) 0.306 (2) I receive consultation during the research (1)-(2)-(3)-(4) 7.50(5) 2.30(2) 0.240 (3) I receive consultation during the statistical analysis and interpretation (1)-(2)-(3)-(4)-(5) 9(6) 2.30(2) 0.077 (4) I receive consultation after writing and while proofreading the manuscript (5) 0(0) 1.10(1) 1 (5) I receive consultation if the manuscript that I submitted to a journal is not
accepted because of statistical analysis (6) 10.40(7) 13.60(12) 0.724
Statistical software packages of varying degrees of sophistication are currently available. The choice of software is determined by the nature of the analysis to be performed, preference for a certain interface and user familiarity with statistical analysis programming [15]. As expected, most of the veterinarians in this study prefer user-friendly programs (66%). Investigating the statistical software preferences of participants, we found SPSS to be the preferred software (32.90%). In similar studies (8, 17), SPSS was also found to be the most common statistical software for performing analysis.
In this study, non-academics and academics stated the importance of biostatistics in veterinary medicine and its usefulness as a tool of the profession. In similar studies, participants also stated the important role of biostatistics in the fields of medicine (8) and dentistry (17). In this study, among academics, it was accepted opinion that biostatistics is a useful tool for all sub-research areas.
It is important to examine the statistical methods commonly applied in the health sciences and their respective subfields to teach the appropriate methods to a target group enrolled in biostatistics courses. In other words, it may be unnecessary to teach the same set of statistical methods to every field within the health sciences (17). In the present study, there are significant differences in knowledge among veterinarians of basic science, preclinical science, clinical science and zootechnics and animal nutrition, specifically with regards to sampling methods, non-parametric tests and general statistics methods, curriculum topics that are both common and uncommon, while there is no significant difference with regards to parametric tests, multivariate methods and survival methods. From the findings in the present study, it can be concluded that the academic staff knowledge level of pre-clinical science is higher than the level of the staffs of clinical science and basic science in terms of sampling methods, non-parametric tests, and general statistics methods, curriculum topics that are both common and uncommon.
There was no difference among academic staff of varying statutes in terms of veterinarian knowledge of biostatistics subjects. Ercan et al. (8) reported similar findings exhibiting no difference among different statuses of academic staff in the field of medicine. However, Ocakoglu et al. (17) reported significant differences in the dentistry field among the different statuses of academic staff with regard to knowledge of parametric tests, nonparametric tests, survival analysis, general statistics, common and uncommon curriculum topics.
Researchers hope that the data collected from given samples and its interpretation will accurately reflect the conditions found in the general population or group (16). For this reason, to make a consistent, efficient and unbiased prediction at the end of a study, it is important to apply sampling techniques accurately. Concerning
veterinarian knowledge of sampling techniques, there was no difference among academic staff of different statuses. A similar situation had occurred in similar studies (8, 17). An almost complete unawareness of sampling techniques on the part of a researcher is somewhat unsettling because sampling is the first important topic considered during the planning stage of a study (17). Researchers need to learn statistical test methods to obtain results, but there is no obligation to learn sampling techniques.
In the present study, although there was no difference between academic staff the knowledge level of all veterinary academic staff regarding multivariate statistical methods was low which supports the findings of this study. Ercan et al. (10) obtained the same pattern of results in their study of medical physicians. They interpreted these results to mean that these methods require an advanced and proficient grasp of mathematics. Researchers in the health sciences may believe their statistics knowledge to be sufficient and as a consequence may not consult a statistician (17).
There was no difference between academic and non-academic veterinarians in terms of the attitude of veterinarians about using biostatistical consultation. It was found that 14.70% of veterinarians use biostatistical consultation from the stage of “designing the study” to the stage of “statistical analysis and interpreting”; 11.30% use biostatistical consultation from “designing the study” to the stage of “after writing and proofreading the manuscript”; 5.62% use biostatistical consultation in all stages of the research process; 1.10% of veterinarians use consultation only in cases where the manuscript is not accepted because of statistical analysis; and 24% of veterinarians stated that they do not seek biostatistical consultation at any stage. In this study, it was found that the rate of veterinarians using biostatistical consultation during their research process was critically low. Ercan et al. [8] and Ocakoglu et al. (17) reported similar results for the field of medicine and dentistry. It is important to declare to the researchers that they are urged to consult a biostatistician at the design stage and are reminded that no experiment should ever be started without a clear idea of how the resulting data are to be analyzed (12).
Researchers generally make mistakes in the step of data collection, tabulation and statistical analysis (9, 11). Even the statistical packages now available are not used with proper understanding of the data and method of analysis, and this may lead to erroneous results (13). The researchers sometimes apply the same statistical tests or methods that they have used before, and they tend to apply statistical tests and methods that are applied in similar studies (11). However, it is important to remember that the design of each study and the characteristics of the data obtained may be different and specific to a particular study, so each study may require different statistical methods with which the researchers
may be unfamiliar (17). In this aspect, collaboration of statisticians is essential.
Although statistics is anathema to many, it is an essential tool for those involved in veterinary science, as well as in biological, medical, and health science problems (18). In sum, while veterinary physicians place an emphasis on biostatistics education, the majority state that biostatistics education should be taken at the undergraduate and postgraduate level, and few of them believe that biostatistics education should be at the undergraduate level. Therefore, biostatisticians should be a part of every faculty of veterinary medicine, and courses in biostatistics should be part of both the undergraduate and graduate veterinary programs (3). In biostatistics education, the topic of sampling, which plays a significant role at the planning stage of any study, should be considered particularly important (17). A biostatistics education should also emphasize the necessity of consulting with a biostatistician when planning a study (17).
One of the main limitations of this study is the low response rate (<10%). However, our response rate of 4.38% is similar to that of web-based studies in previous research aimed at cardiologists (4%) (21), medical providers (4%) (20), primary care physicians (5.7%) (22), dental physicians (9.1%) (17) and a group of urologists (9.3%) (14). When similar studies are considered, our response rate is acceptable.
The present study is significant in terms of the international scope of its intent and has originality due to the uniqueness of this scope. Present study provides information regarding the level of biostatistical knowledge of veterinarians by research area and academic position and as well as providing guidance regarding the ideal semester for administering a biostatistics course and the appropriate statistical methods that should be taught in veterinary schools. Therefore, the current study also offers guidance for education planners in veterinary schools, in addition to staff who administer biostatistics courses and researchers.
References
1. Altman DG, Bland JM (1991): Improving doctors'
understanding of statistics. J. R. Statist. Soc. A, 154: 223-267.
2. Bearman J (1969): The teaching of biostatistics: minimum
goals for veterinary students. (Symposium on education in
veterinary public health and preventive medicine) St. Paul, Minnesota, 18-22 March, 1968, pp: 43.
3. Bellamy J (1983): Coming to grips with statistics. Can J Comp Med, 47: 385.
4. Boyle CR (1999): A problem-based learning approach to
teaching biostatistics. J Stat Educ., 7: 1-22.
5. Deutsch R (2002): "What sample size do I need?" ...or ... a
biostatistical consultant’s role as an educator.
(Proceedings of the American statistical association, section on teaching statistics in health sciences) American statistical association: alexandria, VA; 758–763.
6. Dhand N, Thomson P (2009): "Scenario-based approach
for teaching biostatistics to veterinary students," next steps
in statistics education. (Proceedings from the 2009 IASE
satellite conference) Durban, South Africa: International association for statistics education retrieved from: https://www.stat.auckland.ac.nz/~iase/publications/sat09/8_3. pdf (18 January 2014).
7. El Tantawi MM (2009): Factors affecting postgraduate
dental students’ performance in a biostatistics and research design course. J Dent Educ., 73: 614-623.
8. Ercan I, Ocakoglu G, Ozkaya G, et al (2013): An
international survey of physicians’ knowledge of biostatistics. Turkiye Klinikleri J Med Sci., 33, 401-409.
9. Ercan I, Ocakoglu G, Sigirli D, et al (2012): Assessment
of submitted manuscripts in medical sciences according to statistical errors. Turkiye Klinikleri J Med Sci., 32:
1381-1387.
10. Ercan I, Ozkaya G, Ocakoglu G, et al (2008):
Determining biostatistics knowledge of students and physicians in medical school. InterStat, 2008, January, 7.
11. Ercan I, Yazici B, Yang Y, et al (2007): Misusage of
statistics in medical researches, Eur J Gen Med., 4: 127-133.
12. Festing MF, Altman DG (2002): Guidelines for the
design and statistical analysis of experiments using laboratory animals. ILAR J., 43: 244-258.
13. Gangadharan P (2007): "Priorities for Teaching in
Agricultural Statistics and Computer Applications". (XV.
National conference of agricultural research statisticians) New Delhi, India: Published by RCMU, 3-4 December, 2007, pp: 134-136.
14. Kim HL, Hollowell CM, Patel RV, et al (2000): Use of
new technology in endourology and laparoscopy by American urologists: internet and postal survey. Urology,
56: 760-765.
15. Montiani-Ferreira F, Cardoso FF, Petersen-Jones S (2004): Basic concepts in statistics for veterinary
ophthalmologists. Veth Ophthalmol., 7: 79-85.
16. Moskowitz E (2007): Statistics in dentistry: who needs
them? NYS Dental Journal, 73: 4.
17. Ocakoglu G, Ercan I, Gunel Karadeniz P (2013):
Knowledge of dentists about biostatistics: a worldwide survey. e-Journal of Dentistry, 3: 361-370.
18. Petrie A, Watson P (1999): Statistics for veterinary and
animal science. Blackwell Science Ltd, Oxford, UK, pp: xi.
19. Polychronopoulou A, Eliades T, Taoufik K, et al (2011):
Knowledge of european orthodontic postgraduate students on biostatistics. Eur J Orthod., 33: 434-440.
20. Russell RA, Meyer MT, Scanlon MC, et al (2013): The
state of telemedicine in wisconsin. WMJ, 112: 152-153.
21. Swetz KM, Cook KE, Ottenberg AL, et al (2013):
Clinicians' attitudes regarding withdrawal of left ventricular assist devices in patients approaching the end of life. Eur J Heart Fail., 15: 1262-6.
22. Yasmeen S, Romano PS, Tancredi DJ, et al (2012):
Screening mammography beliefs and recommendations: a web-based survey of primary care physicians. BMC Health Serv Res., 12: 32.
Geliş tarihi: 11.07.2014/ Kabul tarihi: 24.09.2014
Address for correspondence:
Dr. Gökhan Ocakoğlu Department of Biostatistics,
Faculty of Medicine, Uludag University, Bursa/ Turkey