J Cardiovasc Thorac Res, 2015, 7(4), 154-157
doi: 10.15171/jcvtr.2015.33 http://journals.tbzmed.ac.ir/jcvtr
Evaluation of the P Wave Axis in Patients With Systemic Lupus
Erythematosus
Rezzan Deniz Acar1*, Mustafa Bulut1, Şencan Acar2, Servet Izci1, Serdar Fidan1, Mahmut Yesin1, Suleyman Cagan Efe1 1Kartal Kosuyolu Education and Research Hospital, Department of Cardiology, Istanbul, Turkey
2Department of Internal Medicine, Bilim University, Istanbul, Turkey
Introduction
The arrhythmias have higher incidence in patients with systemic lupus erythematosus (SLE) than in the general population due to the rhythm and conduction disturbanc-es.¹ The major causes of the dysfunction of sinus or AV nodes in SLE are the small vessel vasculitis and the infil-tration by fibrous or granulation tissue. Sinus tachycardia, atrial fibrillation and atrial ectopic beats are most frequent and transient supraventricular arrhythmias which may be related to myocarditis and exacerbations of SLE.²
P wave axis is one of the routinely reported variables on the printout of most electrocardiograms (ECGs) that may be the most practical clinical tool for evaluation of car-diovascular disease and may provide better predictive val-ue than the currently used P wave indexes. The P wave is the first positive deflection on the ECG and represents atrial depolarisation. Normal P wave axis is between 0° and +75°. However, the relationship between P wave ab-normalities and the cardiovascular death has been deter-mined before.³
The left atrium (LA) size was found that it largely influ-ences diastolic LV filling which reflects the duration and severity of the diastolic dysfunction.4 The previous stud-ies demonstrate that the advanced diastolic dysfunction is
strongly associated with increased mortality.5-7
The aim of our study is to evaluate the P wave axis in ECG, left atrial function and association between the disease ac-tivity score in patients with SLE.
Materials and Methods
Study Protocol
We planned a study with 43 experimental subjects and 32 control subjects by using the PS Power and Sample Size Program. In a previous study the response within each group was normally distributed and the population means of the experimental and control groups were equal with probability (power) 0.803. The Type I error probability as-sociated with this test of null hypothesis was 0.05.
The experimental subjects fulfilled at least four of the American College of Rheumatology criteria for SLE.8 The screening for coronary artery diseases was undertaken in all cases. Among patients with SLE included in the study, 38 patients had normal cardiac stress test, 3 patients had normal myocardial perfusion SPECT and 2 patients had normal coronary angiogram. Patients with known cor-onary artery disease, left bundle branch block in ECG, arrhythmia, pericarditis, pulmonary hypertension, con-gestive heart failure, stroke and peripheral arterial disease *Corresponding author: Rezzan Deniz Acar, Email: [email protected]
© 2015 The Author(s). This is an open access article distributed under the terms of the Creative Commons Attribution License (http://creativecommons. org/licenses/by/4.0), which permits unrestricted use, distribution, and reproduction in any medium, provided the original work is properly cited.
Original Article Publishing Group TUOMS Article info Article History: Received: 22 June 2015 Accepted: 23 November 2015 epublished: 26 November 2015 Keywords: P Wave Axis
Systemic Lupus Erythematosus Left Atrial Volume
Left Atrial Strain
Abstract
Introduction: P wave axis is one of the most practical clinical tool for evaluation of cardiovascular disease. The aim of our study was to evaluate the P wave axis in electrocardiogram (ECG), left atrial function and association between the disease activity score in patients with systemic lupus erythematosus (SLE).
Methods: Standard 12-lead surface ECGs were recorded by at a paper speed of 25 m/s and an amplifier gain of 10 mm/mV. The heart rate (HR), the duration of PR, QRS, QTd (dispersion), the axis of P wave were measured by ECG machine automatically.
Results: The P wave axis was significantly increased in patients with SLE (49 ± 20 vs. 40 ± 18, P = 0.037) and the disease activity score was found positively correlated with P wave axis (r: 0.382, P = 0.011). The LA volume and the peak systolic strain of the left atrium (LA) were statistically different between the groups (P = 0.024 and P = 0.000). The parameters of the diastolic function; E/A and E/e’ were better in the control group than the patients with SLE (1.1 ± 0.3 vs. 1.3 ± 0.3, P = 0.041 and 6.6 ± 2.8 vs. 5.4 ± 1.4, P = 0.036, respectively).
Conclusion: P wave axis was found significantly increased in patients with SLE and positively correlated with SELENA-SLEDAI score. As the risk score increases in patients with SLE, P wave axis changes which may predict the risk of all-cause and cardiovascular mortality.
Please cite this article as: Acar RD, Bulut M, Acar Ş, Izci S, Fidan S, Yesin M, Efe SC. Evaluation of the P wave axis in Patients with Systemic Lupus Erythematosus. J Cardiovasc Thorac Res 2015;7(4):154-157. doi:10.15171/jcvtr.2015.33
P Wave Axis in SLE
J Cardiovasc Thorac Res, 2015, 7(4), 154-157 155 were excluded. Also, none of the patients had a history
of dissection, any previous cardiac surgery or any clini-cal disorders known to compromise myocardial function such as diabetes mellitus, renal impairment, anemia, thy-roid or liver disorder. In addition, smoking and excessive alcohol consumption were considered as exclusion cri-teria. We also excluded the patients with other forms of autoimmune diseases. SLE disease activity was assessed using the SELENA-SLEDAI score.9,10 It was evaluated by the past history, physical examination, laboratory findings and consultation with their rheumatologists.
The control group consisted of 32 individuals without significant differences in age, sex, weight or height from the patients with SLE. The control group was evaluated carefully and the individuals with the similar demograph-ic characteristdemograph-ics were enrolled the study.
Electrocardiography
Standard 12-lead surface ECGs were recorded by ‘The Cardiac Science Burdick Atria 6100 EKG Machine’ at a paper speed of 25 m/s and an amplifier gain of 10 mm/ mV. The heart rate (HR), the duration of PR, QRS, QTd (dispersion), the axis of P wave were measured by ECG machine automatically.
Echocardiography
Two-dimensional grayscale harmonic images at a frame rate of 60 to 80 frames/s were obtained in the left lateral decubitus position using a commercially available system (Vivid 7, GE, Horten, Norway). The LV ejection fraction was calculated by Simpson's biplane method of discs ac-cording to the American Society of Echocardiography.11 Pulsed-wave Doppler at the tip of mitral valve leaflets al-lowed us to measure the early (E) and late (A) diastolic filling velocities and we calculated the E/A ratio. Also, the peak early diastolic myocardial tissue velocity was mea-sured by tissue Doppler imaging of the lateral mitral an-nulus (e’) and E/e' was calculated. The diameters of the LA were measured; the maximum anterio-posterior diameter (D1), superior-inferior diameter (D2) and medial-lateral diameter (D3). LA volume was calculated by the formula; D1×D2×D3×0.523. To measure the peak systolic longiti-dunal left atrial strain by 2-dimensional speckle tracking echocardiography, the gray scale image of apical 4-cham-ber and 2-cham4-cham-ber views were obtained with the frame rates of 50-80 Hz. The process was recorded with software (EchoPAC, GE Healthcare, Horten, Norway), allowing off-line analyses.
Statistical Analysis
Statistical analyses were performed using SPSS software version 15.0 (SPSS Inc., Chicago, IL). Data are presented as mean ± standard deviation for continuous variables and as proportions for categorical variables. For all statistical analyses, a two-tailed P < 0.05 was considered significant. Simple correlations were evaluated by Pearson’s r correla-tion coefficients. Independent samples t test was used to test differences between groups.
Table 1. Demographic Properties, Clinical Characteristics of Both the SLE Patients and the Control Group
SLE patients (n=43) (Mean ± SD) Control Group (n=32) (Mean ± SD) P Value Age (y) 35.7 ± 13.7 35.9 ± 10.0 0.962 Gender (n) 8 male (18 %) 7 male (21 %) 0.519 Weight (kg) 70.2 ± 11.7 76.5 ± 9.6 0.052 Height (cm) 163 ± 8.0 166 ± 7.7 0.106 Hypertension (n) 11 (25 %) 9 (28 %) 0.682 Abbreviations: n, number; SD, standart deviation; SLE, systemic lupus erythematosus.
Results
Of the 43 patients with SLE enrolled in this study, 8 were male (18%). Demographic properties and echocardio-graphic parameters of both the SLE patients and the con-trol group are shown in Table 1.
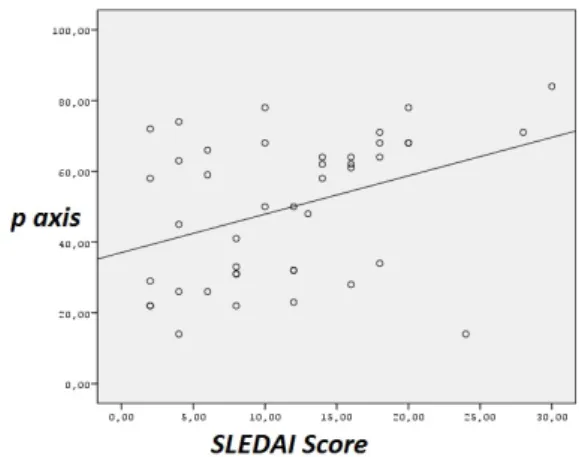
The HR, the duration of PR, QRS, and the axis of QRS and T wave were not statistically significant. The P wave axis was significantly changed in patients with SLE (49 ± 20 vs. 40 ± 18, P = 0.037) and the disease activity score was found positively correlated with P wave axis (r = 0.382, P = 0.011, Figure 1) However, the QTd was significantly increased in patients with SLE (42 ± 21 vs.33 ± 16, P = 0.046; Table 2) The LA volume and the peak systolic strain of the LA were statistically different between the groups (P = 0.024 and P = 0.000). The left ventricular end diastolic volume (LVED volume) and ejection fraction (EF) of the patients with SLE and the control group were similar (93.8 ± 20.7 vs. 91.6 ± 20.8, P = 0.659, 60.9 ± 10 vs. 64.7 ± 5.5, P = 0.073, respectively). The Sm lateral and Sm septal with tissue Doppler echocardiography were significantly lower in SLE (9.4 ± 2.0 vs. 12.3 ± 2.2, P = 0.000 and 8.1 ± 1.3 vs. 10.4 ± 1.4, P = 0.000, respectively). Also, the parameters of the diastolic function; E/A and E/e’ were better in the control group than the patients with SLE (1.1 ± 0.3 vs.1.3 ± 0.3,
P = 0.041 and 6.6 ± 2.8 vs. 5.4 ± 1.4, P = 0.036, respectively)
(Table 3).
Figure 1. The Positive Correlation Between the P Wave Axis and the SLE Disease Activity Score (SELENA-SLEDAI). (r = 0.382, P = 0.011).
Acar et al
J Cardiovasc Thorac Res, 2015, 7(4), 154-157
156 Discussion
P wave axis was found significantly changed and posi-tively correlated with SELENA-SLEDAI score in patients with SLE, in this study. The determination of P wave axis is important because in the analysis from the NHANES III survey, abnormal P wave axis was found associated with an increased risk of all-cause and cardiovascular mortality in a representative sample from the US population.12 The principal role of the LA is to modulate and augment the left ventricular filling trough the late diastole like a booster pump. An emerged parameter in assessing LA function is longitudinal strain which is a robust, well val-idated and reproducible technique for the measurement of LA longitudinal deformation. The impairment of left atrial function has many serious consequences. Sasaki et al has reported that decreased LA peak systolic strain was also independently associated with LA appendage dysfunction in patients with acute ischemic stroke.13 Li et al recently demonstrated that according to the Systemic Lupus International Collaborating Clinics/American Col-lege of Rheumatology Damage Index (SDI), patients with
a SDI ≥ 1, left atrial mechanical function and volume were found impaired in SLE patients with an increased dis-ease activity. They reported the impairment in left atrial performance by using real-time 3-D echocardiography (RT3DE) technology.14 We found significantly decreased values of the left atrial peak systolic strain by using 2–di-mensional speckle tracking echocardiography and larger volumes of the LA than the control group. Kurt et al were demonstrated that diastolic heart failure is associated with larger LA volumes and decreased LA peak systolic strain.15 The major problem caused an increase in LA volume and decrease in LA peak systolic strain in patients with SLE may be the reduced diastolic reserve due to the abnormal myocardial relaxation.
According to a study by Win et al, there was an association between p wave duration and increase in LA volume and decrease in LA emptying fraction and reservoir function but they did not find any association with P wave axis.16 Likewise, we could not find any association between the P wave axis and the LA volume and LA peak systolic strain. Also, increased QTd can be seen because of myocardial involvement even in the absence of clinical cardiac man-ifestations in patients either with SLE and other rheuma-tologic disorders such as rheumatoid arthritis and anky-losing spondylitis.17-20 In our study, QTd which predicts the increased risk of ventricular tachyarrhythmias was found significantly increased in patients with SLE alike the literature.
SLE disease activity score was found positively correlated with the P wave axis degrees which means that; as the SLE activity getting impaired, P wave axis degree increases that may also increase the risk of all-cause and cardiovascular mortality in patients with SLE.
Study Limitations
First of all, the number of our patients is few. Second, the long term monitoring to detect the possible arrhythmia or the risk of mortality is lacking. Altough SLE patients did not have abnormal P wave axis, we should emphasize that they were in the remission period. The P wave axis degrees are greater than the control group even in the lack of disease activity. The most important limitation of our study is, we did not compare them with the SLE patients in the active period.
Conclusion
P wave axis was found significantly changed in patients with SLE and positively correlated with SELENA-SLEDAI score. The LA volume was increased and the LA peak sys-tolic strain was decreased in patients with SLE, but there was not any association with the P wave axis. Consequent-ly, as the risk score increases in SLE, P wave axis changes which may predict the risk of all-cause and cardiovascular mortality.
Ethical issues
Written informed consent was obtained from each sub-ject, and the institutional ethics committee approved the Table 3. The Echocardiographic Parameters of Both the SLE
Patients and the Control Group SLE Patients (n=43) (Mean ± SD) Control Group (n=32) (Mean ± SD) P Value LVd (cm) 4.7 ± 0.44 4.5± 0.36 0.196 LVs (cm) 2.7 ± 0.35 2.5 ± 0.36 0.128 IVS (cm) 0.90 ± 0.12 0.91 ± 0.12 0.801 Posterior wall (cm) 0.79 ± 0.12 0.78 ± 0.11 0.629 LVED volume (ml) 93.8 ± 20.7 91.6 ± 20.8 0.659 EF % 60.9 ± 10 64.7 ± 5.5 0.073 E/A 1.1 ± 0.3 1.3 ± 0.3 0.041 E/e’ 6.6 ± 2.8 5.4 ± 1.4 0.036 LA volume 30 ± 4.3 28 ± 4.2 0.024 LA strain 19.2 ± 1.5 20.9 ± 1.5 0.000 Sm lateral 9.4 ± 2.0 12.3 ± 2.2 0.000 Sm septal 8.1 ± 1.3 10.4 ± 1.4 0.000 Abbreviations: n, number; SD, standard deviation; SLE, systemic lupus erythematosus; LVd, left ventricle diastolic diameter; LVs, left ventricle systolic diameter; IVS, interventricular septum; LVED, left ventricle end-diastolic diameter; EF, ejection fraction; LA, left atrium; Sm: peak systolic velocity.
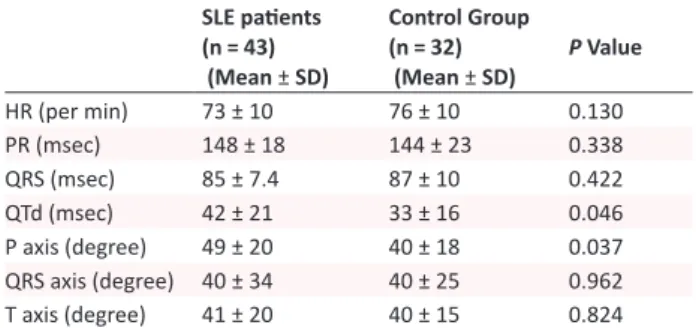
Table 2. Evaluation of the ECG Parameters of Both the SLE Patients and the Control Group
SLE patients (n = 43) (Mean ± SD) Control Group (n = 32) (Mean ± SD) P Value HR (per min) 73 ± 10 76 ± 10 0.130 PR (msec) 148 ± 18 144 ± 23 0.338 QRS (msec) 85 ± 7.4 87 ± 10 0.422 QTd (msec) 42 ± 21 33 ± 16 0.046 P axis (degree) 49 ± 20 40 ± 18 0.037 QRS axis (degree) 40 ± 34 40 ± 25 0.962 T axis (degree) 41 ± 20 40 ± 15 0.824 Abbreviations: n, number; SD, standart deviation; SLE, systemic lupus erythematosus; HR, heart rate.
P Wave Axis in SLE
J Cardiovasc Thorac Res, 2015, 7(4), 154-157 157 study protocol.
Competing interests
Authors declare no conflict of interest in this study. References
1. Teixeira RA, Borba EF, Bonfá E, Martinelli Filho M. Arrhythmias in systemic lupus erythematosus. Rev Bras Reumatol 2010;50(1):81-89.
2. Abu-Shakra M, Urowitz MB, Gladman DD, Gough J. Mortality studies in systemic lupus erythematosus: results from a single center. I. Causes of death. J Rheumatol 1995;22(7):1259-1264.
3. Kaykha A, Myers J, Desser KB, Laufer N, Froelicher VF. The prognostic importance of isolated P-Wave abnormalities. Clin Cardiol 2010;33(6):87-93. doi: 10.1002/clc.20628.
4. Simek CL, Feldman MD, Haber HL, Wu CC, Jayaweera AR, Kaul S. Relationship between left ventricular wall thickness and left atrial size: comparison with other measures of diastolic function. J Am Soc Echocardiogr 1995;8(1):37-47. doi: 10.1016/S0894-7317(05)80356-6.
5. Nijland F, Kamp O, Karreman AJ, van Eenige MJ, Visser CA. Prognostic implications of restrictive left ventricular filling in acute myocardial infarction. J Am Coll Cardiol 1997;30(7):1618–1624. doi: 10.1016/S0735-1097(97)00369-0.
6. Moller JE, Sondergaard E, Poulsen SH, Egstrup K. Pseudonormal and restrictive filling patterns predict left ventricular dilation and cardiac death after a first myocardial infarction. J Am Coll Cardiol 2000;36(6):1841-1846. doi: 10.1016/S0735-1097(00)00965-7.
7. Cerisano G, Bolognese L, Buonamici P, Valenti R, Carrabba N, Dovellini EV, et al. Prognostic implications of restrictive left ventricular filling in reperfused anterior acute myocardial infarction. J Am Coll Cardiol 2001;37(3):793–799. doi: 10.1016/ S0735-1097(00)01203-1.
8. Hochberg MC. Updating the American College of Rheumatology revised criteria for the classification of systemic lupus erythematosus. Arthritis Rheumatol 1997;40:1725.
9. Bombardier C, Gladman DD, Urowitz MB, Caron D, Chang CH. Derivation of the SLEDAI. A disease activity index for lupus patients. The Committee on Prognosis Studies in SLE. Arthritis Rheum 1992;35(6):630–640. doi: 10.1002/art.1780350606. 10. Buyon JP, Petri MA, Kim MY, Kalunian KC,
Grossman J, Hahn BH, et al. The effect of combined estrogen and progesterone hormone replacement therapy on disease activity in systemic lupus erythematosus: a randomized trial. Ann Intern Med 2005;142(12pt):953–962. doi:10.7326/0003-4819-142-1.
11. Lang RM, Bierig M, Devereux RB, Flachskampf FA, Foster E, Pellikka PA, et al. American Society of Echocardiography's Guidelines and Standards Committee; European Association of Echocardiography Recommendations for Chamber Quantification: A Report from the American Society of Echocardiography’s Guidelines and Standards Committee and the Chamber Quantification Writing Group, Developed in Conjunction with the European Association of Echocardiography, a Branch of the European Society of Cardiology. J Am Soc Echocardiogr 2005;18:144014-63.
12. Li Y, Shah AJ, Soliman EZ. Effect of electrocardiographic P-wave axis on mortality. Am J Cardiol 2014;113(2):372-376. doi: 10.1016/j. amjcard.2013.08.050.
13. Sasaki S, Watanabe T, Tamura H, Nishiyama S, Wanezaki M, Sato C, et al. Left atrial strain as evaluated by two-dimensional speckle tracking predicts left atrial appendage dysfunction in patients with acute ischemic stroke. BBA Clin 2014:2;40-47. 14. Li K, Wang R, Dai M, Lu J, Zou Y, Yang X.
Evaluation of left atrial function by real-time 3-D echocardiography in patients with systemic lupus erythematosus. J Rheumatol 2015;42(2):196-201. doi: 10.3899/jrheum.140304.
15. Kurt M, Wang J, Torre-Amione G, Nagueh SF. Left atrial function in diastolic heart failure. Circ Cardiovasc Imaging 2009;2:10-5. doi: 10.1161/ CIRCIMAGING.108.813071.
16. Tiffany Win T, Ambale Venkatesh B, Volpe GJ, Mewton N, Rizzi P, Sharma RK, et al. Associations of electrocardiographic P-wave characteristics with left atrial function, and diffuse left ventricular fibrosis defined by cardiac magnetic resonance: The PRIMERI Study. Heart Rhythm 2015;12:155-162. doi: 10.1016/j.hrthm.2014.09.044.
17. Yildirir A, Aksoyek S, Calguneri M, Aytemir K, Kabakci G, Ovunc K, et al. QT dispersion as a predictor of arrhythmic events in patients with ankylosing spondylitis. Rheumatology 2000;39(8):875-879. doi: 10.1093/rheumatology/39.8.875.
18. Pirildar T, Sekuri C, Uyuk O, Kemal Tezcan U. QT dispersion in rheumatoid arthritis patients with and without Sjogren’s syndrome. Clin Rheumatol 2003;22(3):225-228. doi. 10.1007/s10067-003-0707-4.
19. Cindas A, Gokce-Kutsal Y, Tokgozoglu L, Karanfil A. QT dispersion and cardiac involvement in patients with rheumatoid arthritis. Scand J Rheumatol 2002;31(1):22-26.
20. Yavuz B, Atalar E, Karadag O, Tulumen E, Ozer N, Akdogan A, et al. QT dispersion increases in patients with Systemic lupus erythematosus. Clin Rheumatol 2007;26(3):376-379. doi: 10.1007/s10067-006-0364-5.