PERFORMANCE OF TURKISH MUTUAL FUNDS
M. SERHAT YÜCEL
106626006
ĠSTANBUL BĠLGĠ UNIVERSITY
INSTITUTE OF SOCIAL SCIENCES
FINANCIAL ECONOMICS – QUANTITATIVE FINANCE
PROF. DR. BURAK SALTOĞLU
2010
Performance of Turkish Mutual Funds
M. Serhat Yücel
106626006
Prof. Dr. Burak Saltoğlu :
Jury 1
:
Jury 2
:
Date of Approval
:...
Number of Pages: 102
Keywords (Turkish)
Keywords (English)
1) Alfa
1) Alpha
2) Performans ölçümü
2) Performance measurement
3) Hayatta kalma etkisi
3) Survivorship bias
4) Performans sürekliliği
4) Performance persistence
5) Hisse seçim kabiliyeti
5) Stock picking ability
iii
Abstract
This study focuses on the stock picking ability of Turkish fund managers and the persistence of their superior performance, if any. Equity focused pension and mutual funds existed through 2004 to 2009 in Turkey are analyzed. First, the effect of survivorship bias is calculated, then well known performance measurements models are applied and finally, persistence of superior performance is discussed. We have found that, Turkish fund managers poses a certain stock picking ability, but the timing inability is higher. Although there is no evidence of general performance persistence, the performance persists for certain outliers and this outlier persistence is higher in bad performing funds.
Özet
Bu çalıĢma, Türkiyedeki fon yöneticilerinin hisse senedi seçebilme
kabiliyeti ve performanslarının sürekliliğini ölçmeye çalıĢmaktadır. 2004 – 2009 yılları arasında varolan hisse odaklı emeklilik ve yatırım fonları incelenmiĢtir. Ġlk adımda, sadece dönem sonuna kadar hayatta kalabilmiĢ fonlar ile çalıĢmanın etkisi ölçülmüĢ, ardından kabul görmüĢ performans ölçme modelleri uygulanmıĢ ve son olarakta performansın sürekliliği tartıĢılmıĢtır. Bulgularımıza göre Türk fon yöneticilerinin belirli bir hisse seçme kabiliyeti olduğu söylenebilir. Ancak hatalı zamanlama kararlarının etkisi daha yüksek olmaktadır. Her ne kadar genel olarak bir performans kalıcılığından bahsetmek mümkün olmasada, dağılımın uçlarındaki fonlarda belli bir performans sürekliliği söz konusudur ve bu süreklilik kötü
iv
Acknowledgment
It is an honor for me to have the privilege of studying under the guidance of Prof. Dr. Burak Saltoğlu. In my struggles within this thesis, his valueable and to the point comments helped me find my way. I feel indebted for his sharing of ideas and sources.
I would also like to thank Elif Çakmakoğlu who supported and studied with me throughout this thesis in all stages. Her support made this thesis
possible.
I am grateful to my beloved wife Selin Yücel During my studies. She gave birth to our son Kerem but still managed to make it possible for me to concentrate and focus on my studies. Without her everlasting patience and support, I would never be able to finish this thesis. Finally, I would like to thank to my Son Kerem, for all the happiness and joy he bring to my life.
v Table of Contents Abstract ... iii Acknowledgment ... iv Table of Contents ... v List Of Tables ... vi
List of Graphs ... vii
Abbrevations (In the order of appearance) ... viii
1. Introduction ... 1
2. Developments in mutual fund industry ... 2
2.1 Turkish Mutual and Pension fund industry ... 2
2.2 Global Mutual fund industry ... 7
3. Review of Literature ... 9
3.1 History of Fund Performance Measurement ... 9
3.2 Evidence From Different Countries ... 19
4. Data ... 22
4.1 Definition of Data ... 22
4.2 Errors corrected ... 24
5. Survivorship Bias ... 26
6. Performance Measurement Models and Results ... 31
6.1 Single Index Model ... 32
6.2 Henriksson – Merton Model ... 36
6.3 Treynor – Mazuy Model ... 40
6.4 Fama – French Three Factor Model ... 43
6.5 Carhart Four Factor Model ... 50
6.6 Ferson – Schadt Conditional Models ... 54
6.7 Christopherson, Ferson, Glassman Conditional Models ... 58
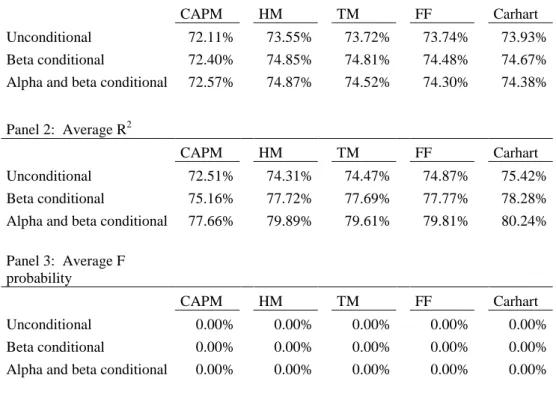
6.8 Comparison of models discussed ... 61
7. Persistence of Performance in Turkish Fund Market ... 65
8. Conclusion ... 74
9. Appendix ... 77
9.1 Appendix A: The effect of Survivorship bias in Turkish fund industry for 2004 – 2009 period... 77
9.2 Appendix B: List of 65 Funds used in estimations ... 80
9.3 Appendix C: Matlab codes developed for regression estimations 83 9.4 Appendix D: Regression Results for 5 factor model ... 94
9.5 Difference of Gross and net returns. ... 97
vi
List Of Tables
Table 1 - Allocation of Mutual fund assets into investment instruments –
31.12.2009 ... 7
Table 2 - Survivorship bias results with non surviving funds as independent variable ... 28
Table 3 - Test of equality for surviving and non surviving funds for means and standard deviations ... 29
Table 4 - Single Index Model Results – Equation (2) ... 34
Table 5 - Henriksson - Merton Model Results – Equation (24) ... 38
Table 6 - Treynor - Mazuy Model Results – Equation (7) ... 41
Table 7 - Fama - French Model Results – Equation (10) ... 48
Table 8 - Carhart 4 Factor Model Results – Equation (12) ... 52
Table 9 - Beta Conditional Results Step 1 – # of significant variables – 90% significance ... 57
Table 10 - Alpha and Beta Conditional Results Step 1 – # of significant variables – 90% significance ... 60
Table 11 - Summary statistics of models estimated ... 62
Table 12 - Alpha and timing coefficients of the models estimated ... 64
Table 13 - Malkiel Persistency Results ... 66
Table 14 - Brown and Goetzmann Persistency Results of Unconditional Carhart Model ... 69
Table 15 - Persistency in fund Level ... 71
Table 16 - Persistency in fund Level ... 73
Table 17 - Regression results for all funds and non surviving funds excess returns over excess market return ... 78
Table 18 - Survivorship bias results with non surviving funds as independent variable ... 79
Table 19 - 5 Factor Model Results – Equation (40) ... 95
vii
List of Graphs
Graph 1 - Development of A type mutual fund investments from 1994 to
2009 – 000,- TRL ... 6
Graph 2 - Market share of Countries – Percent ... 8
Graph 3 - Assets Under Management by Fund type – Billion EUR ... 9
viii
Abbrevations (In the order of appearance)
ISE Istanbul Stock Exchange NAV Net Asset Value
CMB Capital Markets Board
MITTX MFS Massachusetts Investors Trust A Fund USA United States of America
AUM Assets Under Management
EFAMA European Fund and Asset Management Association
EUR Euro
CAPM Capital Assets Pricing Model R/V Reward-to-variablity ratio SMB Small Minus Big Sized Firms
HML High Minus Low Book to Market Equity Ratio Firms PR1YR Difference of One Month Lagged 11 Month Return of Best
and Worst %30 Firms‟ Average Return CS Charactristic Selectivity Measure CT Characteristic Timing Measure AS Average Style Measure
UK United Kingdom
SCI Small Cap Index
PPW Positive Period Weighting Measure NYSE New York Stock Exchange
KYD30 Bond index with an average maturity of 30 days issued by Turkish Institutional Investment Managers
GPRI Global Political Risk Index
FS Ferson and Schadt
BT Blake and Timmermann
CAPM_FS Beta Conditional Single Index Model
HM_FS Beta Conditional Henriksson and Merton Model TM_FS Beta Conditional Treynor and Mazuy Model
ix
C_FS Beta Conditional Carhart Four Factor model CAPM_CFG Alpha and Beta Conditional Single Index Model
HM_CFG Alpha and Beta Conditional Henriksson and Merton Model TM_CFG Alpha and Beta Conditional Treynor and Mazuy Model FF_CFG Alpha and Beta Conditional Fama and French Three
FactorModel
C_CFG Alpha and Beta Conditional Carhart Four Factor model HM Henriksson and Merton Model
TM Treynor and Mazuy Model
FF Fama French Model
1
1. Introduction
This study examines stock picking ability and the persistence, if any, for Turkish mutual and pension fund market returns for the period of February 2004 to December 2009. The dataset used includes a total of 66 portfolios consist of 65 funds plus the equally weighted average portfolio of 65 funds included.
Our database is not the entire fund database in Turkey. We have excluded some funds that disappeared during our period. Furthermore, we have excluded funds that were not issued yet at February 2004. So, first we will test whether the funds that we have excluded generates any bias on our results or not.
We will estimate five generally accepted regression models used in order to measure the stock picking ability. The models used are the single index, Treynor – Mazuy, Henriksson – Merton, Fama – French and Carhart models. In the literature, it is discussed that fund performance should be conditioned on certain publicly available information due to the fact that fund managers adjust their positions accordingly. We will estimate first only beta conditional and then both alpha and beta conditional forms of the five models discussed.
Another discussion going over the fund industry is whether the performance persists or not. We will test any good or bad performance persistence in means of alpha for various models discussedand try to identify any good or bad persistence.
Section 2 summarizes the Turkish and global fund industry in means of history and current situation. Section 3 reviews the literature on fund performance measurement models. Section 4 describes the data we used in detail and section 5 discusses whether the data we used generates any bias
2
due to survivorship or exclusion. Section 6 discusses performance
measurement models and their conditional forms and compares the results in means of variables used and explanatory power. Section 7 calculates the persistence of performance for stock picking ability and section 8 concludes.
2. Developments in mutual fund industry
2.1 Turkish Mutual and Pension fund industry
Turkish Capital Markets Law article 37 defines mutual fund as an asset established to manage a portfolio of capital market instruments, real estate, gold and other precious metals by the money collected from investors backed by participation certificates with the diversification of risk and fiduciary ownership principals. Mutual funds are not legal entities but still, assets held within a mutual fund are separated from the founder of the Fund. Since the assets within the fund belong to the investors and not to the
founder, the separation ensures that mutual fund assets are not affected from any implication of the founder like bankruptcy. To further strengthen the rights of the investor, according to article 38 clause b, assets of a fund cannot be pledged, used as a collateral, or seized by a third party.
Mutual funds in Turkey can be founded by banks, insurance and pension companies, intermediary institutions and eligible retirement and provident funds.
Mutual funds in Turkey are classified into two types: A type and B type funds. A type funds invest at least 25% of their total assets under
management at all times into securities issued by Turkish companies. Other mutual funds are classified as B type.
According to article 42 of Fundamentals related to Mutual funds communiquéi
, mutual funds are subject to certain portfolio limitations to ensure proper diversification against various risks. Some significant limitations listed in the above mentioned regulation is as follows: Mutual
3
funds can not invest more than 10% of their assets under management into the securities of a single issuer. A mutual fund cannot invest into more than 9% of any issuers‟ total shares. Mutual funds can not invest more than 10% of their total assets under management into shares or debt instruments that are not quoted to a stock exchange. Mutual funds can not invest above a certain percentage into securities that are issued by the founder or the fund portfolio manager. Mutual funds cannot short-sell.
According to their investment objectives, mutual funds are classified into groups:
Note and bond fund: funds investing at least 51% of their assets into public or private note and bonds.
Shares fund: funds investing at least 51% of their assets into securities issued by Turkish companies.
Sector fund: funds investing at least 51% of their assets into the securities issued by companies operating in the same sector.
Subsidiary fund: funds investing at least 51% of their assets into securities issued by subsidiaries of the founder.
Group fund: funds investing at least 51% of their assets into securities issued by a certain group.
Foreign securities fund: funds investing at least 51% of their assets into securities issued by foreign private or government companies.
Precious metals fund: funds investing at least 51% of their assets into gold and other precious metals traded in local and international stock markets or capital market instruments backed by gold and other precious metals.
4
Gold fund: funds investing at least 51% of their assets into gold traded in local and international stock markets or capital market instruments backed by gold.
Composite fund: funds investing 100% of their assets into shares, debt securities, gold and other precious metals or assets backed by those. Mixed funds invest into at least two of the instruments counted above and the share of each instrument cannot be less than 20% of the total fund.
Liquid fund: funds investing 100% of their assets into capital market instruments with days to maturity less than 180 days and with average portfolio maturity of maximum 45 days.
Variable fund: funds that cannot be classified into one of the classes mentioned above in means of portfolio limitations.
Index fund: funds investing at least 80% of their assets into an index of shares used within the index with correlation coefficient of at least 90% between the price of the fund and the index.
Funds of funds: funds investing at least 80% of their assets into other funds.
Protection funds: umbrella funds, aiming a return over the total or part of the startup investment within a certain horizon, with an eligible best effort investment strategy.
In 1980‟s, Turkey shifted to the liberalization in the economy, which can also be accepted as the first step in the development of Turkish capital markets. Early years of 1980‟s were more focused on constructing the necessary framework of regulations and bodies for healthy capital and money markets. In July 1981, Capital Markets Law was accepted. One year
5
later, in January 1982, Capital Markets Board, the body responsible from the management and regulation of capital markets, established. In December 1985, Istanbul Stock Exchange (ISE) was founded and began trading on January 1986. Parallel to developments in capital markets and stock exchange, a communiqué regulating issuing and public offering of mutual fundsii was published in official gazette, and soon after this in July 1987 first mutual fund of Turkey (T. ĠĢ Bank, B type, Liquid fund) was offered to public and is still alive. 1997 was a year with important improvements for fund management community. First portfolio management company, Oyak portfolio management corp. (known as ING portfolio management corp. since June 2008), was founded in July 1997. Also first private mutual fund, foreign mutual fund and sector funds were issued in July, August and December 1997, respectively. In January 1999, daily fund price and portfolio allocation data has become public via internet and same year in July, first index fund issued. In 2002, the communiqué regulating issuing and managing pension fundsiii was published in official gazette. Soon after the publication of communiqué, first pension funds were established in September 2003, and issued in October 2003.
Despite their rapid growth, A type funds are very sensitive to economic conditions. 2 major crisis Turkey faced during the 21. Century – first is local and the other is global - effected the development of the A type mutual funds. The effect is very clear in years 2002 and 2008 in the development of net asset value (NAV) for A type mutual funds shown in graph 1.
6 Source: CMB monthly statistical bulletin
Graph 1 - Development of A type mutual fund investments from 1994 to 2009 – 000,- TRL
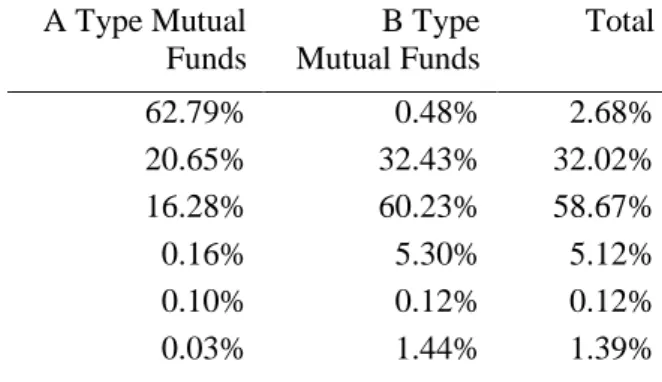
As of December 2009, mutual fund industry has reached a net asset value of over 29.5 billion TL. Almost 96.75% - which amounts more than 28.5 billion TL- is invested into B type funds. B type funds invest almost 92% of their assets into public debt instruments and reverse repos and 5% into money market instruments. Percent of shares is even less than 1%. On the other hand, A type funds invest 63% of their assets into shares, 21% into public debt instruments and 16% into reverse repo. As a total, reverse repo investments amount for almost 59% of all mutual fund investments. 32.02% and 5.12% of the total net asset value of mutual funds are invested into public debt instruments and money market instruments, respectively. Share investments are only 2.68% of total mutual fund investments.
-200,000 400,000 600,000 800,000 1,000,000 1,200,000
7
Table 1 - Allocation of Mutual fund assets into investment instruments – 31.12.2009 A Type Mutual Funds B Type Mutual Funds Total Shares 62.79% 0.48% 2.68%
Public debt instruments 20.65% 32.43% 32.02%
Reverse repo 16.28% 60.23% 58.67%
Money market instruments 0.16% 5.30% 5.12%
Foreign securities 0.10% 0.12% 0.12%
Other 0.03% 1.44% 1.39%
Source: CMB monthly statistical bulletin
From the point of investors, recent crisis increased the demand for B type funds for investors. By the end of 2009, only almost 190.000 investors invest in A type funds out of roughly 3.000.000 fund investors in Turkey.
An important part of the mutual fund industry consists of pension funds. Although the pension fund industry has a history less than a decade, today, pension funds are major clients for fund management companies. By the end of 2009 total net asset value of fund industry amounts almost 39 billion TL where 9 billion consists of pension funds.
By the end of 2009, there are 457 active funds in Turkish market. 316 of those are classified as mutual funds where 114 is A type and 202 is B type. Number of pension funds is 130 where 62 is value oriented, 25 is growth oriented, 17 is money market, 1 is specialized and 25 is classified as other. Remained 11 consist of 3 funds of funds and 8 structured funds.
2.2 Global Mutual fund industry
Roots of funds in history go back to late 1700‟s. In 1774, A Dutch merchant, Adriaan van Ketwich, formed a trust in order to provide diversification benefits to investors. First open ended mutual fund was
8
started in 21.03.1924 by the Massachusetts Investment Trust. Fund went public in 1928. Fund, with the ticker of MITTX is still alive and managed by MFS investment corp.
The fund management industry is dominated by USA with a market share of 50% and AUM of 13.6 Trillion Eur. Europe, is the second largest player with a market share of 31% and AUM of 4.4 Trillion Eur. Besides USA and Europe; Australia, Brazil, Japan, Canada and China are the other important players. Within Europe, Luxemburg and France are the biggest players. Of the total assets invested in funds in Europe, almost %30 is invested in Luxemburg and 26% is invested in France. Turkey has a market share of %0.29 within Europe and a market share of %0.09 within the World.
Source: EFAMA Quarterly International Statistical Release
Graph 2 - Market share of Countries – Percent
Contrary to the situation in Turkey, fund management industry in the world is dominated by Equity funds. In the period of 2002 to 1Q2009, equity funds reached %48 of the fund management industry for years 2006 and 2007 with 7.983 and 8.473 billion EUR assets under management respectively. After the 2008 crisis, the percentage of equity funds has declined to %33 in
USA, 50.70% Europe, 31.20% Australia, 4.20% Brazil, 3.90% Japan, 3.30% Canada, 2.40% China, 1.50% Others, 2.80%
9
1Q2009. Although it declined back to %33, equity funds is still the largest fund type
Source: EFAMA Quarterly International Statistical Release
Graph 3 - Assets Under Management by Fund type – Billion EUR
3. Review of Literature
3.1 History of Fund Performance Measurement
Efforts to measure the stock picking ability is pioneered by Jensen. Jensen (1967) in his work offers a risk adjusted measure of portfolio performance. This widely accepted measure is known as Jensen‟s alpha, which is the prediction ability of the portfolio manager - the ability to earn more than expected through successful forecasts of the security prices. One important superiority is that, compared to other popular measures of the same decade, Jensen‟s measure provides an absolute measure rather than a ranking as in
2002 2003 2004 2005 2006 2007 2008 1Q09 Equity 4,009 4,657 5,266 7,064 7,983 8,473 4,688 4,444 Bond 2,412 2,383 2,413 2,922 2,939 2,901 2,443 2,542 Moneyma rket 3,041 2,538 2,438 2,852 2,934 3,367 4,161 4,360 Mixed 880 951 1,051 1,329 1,575 1,809 1,276 1,254 Other 458 521 632 893 1,099 1,250 1,062 1,040 0 2,000 4,000 6,000 8,000 10,000
10
Treynor (1965) and Sharpe (1966) measures. Jensen uses CAPM as a starting point and arrives to the following equation of ex post returns (continuous form):
(1)
where is the return of the portfolio j, is the return of the market portfolio, is the risk free rate, is the error term with expectation zero and is the time interval considered. This equation indicates that risk premium earned on any asset is a linear function of the risk premium on the market portfolio. If the portfolio manager has superior forecasting ability of stock prices then he can earn more compared to the relation indicated by equation (1), which will result regular positive error terms. So by simply adding a constant term to equation (1) we can have a measure of prediction ability of the portfolio manager, which is in equation (2).
(2)
First condition of having an unbiased alpha estimator depends on having an unbiased beta estimator. Jensen in his work proves that is downward biased with an amount proportional to portfolio manager‟s ability to forecast the market movements. So, as is biased, because of the fact that the
regression line passes through the sample means, will be biased in the opposite direction. Thus, in Jensen‟s alpha, the stock picking ability of the portfolio manager is overestimated with the upward bias resulting from the ability to forecast market movements.
Jensen practically investigated any evidence of stock picking ability
throughout the alphas of 115 mutual funds for the period of 1945-1964. He concludes that there is little, even no evidence that the expenses made for picking the right stocks worth the effort. The reader should keep in mind that the overall portfolio management activities shouldn‟t be limited to stock picking ability.
11
Later, Grant (1977) showed in his work that is not downward but upward biased thus, the Jensen‟s alpha is actually downward biased.
Another popular measure of performance is developed by Treynor (1965). Treynor defines the problem that some part of the portfolio performance is solely depends on the market performance which the portfolio manager doesn‟t have any control over. The performance measure formed should eliminate the risk purely arising from market fluctuations and take into account the risk appetite of the investor. The measure Treynor uses for this purpose is an excess return over risk ratio. For defining the denominator of Treynor‟s measure (risk), he uses a so called “characteristic line” – a fitted line which has a market rate of return and portfolio rate of return in its axes. The risk is the slope of the characteristic line, which is the sensitivity of the portfolio return to the market. He defines another line, portfolio possibility line, which is the combination of expected return and risk. The intercept of the possibility line is the point where the risk is zero which is the risk free rate. Measure Treynor proposes is the slope of portfolio possibility line:
(3)
where, is the return of the portfolio, is the return where the portfolio invests totally in riskless assets and is the slope of the characteristic line.
Sharpe (1966) in his work tried to broaden the work of Treynor and investigated any empirical prediction ability findings. Sharpe defines the expected return as a function of risk free rate and volatility escalated with a certain risk premium which is positive for risk-averse investors:
(4)
With allowance of borrowing and lending with the risk free rate, the
investor can scale his position on a straight line defined by risk free rate and the risk premium.
12
The slope of equation (5), after substituting ex ante measures with ex post ones gives us the desired performance measure “reward-to-variability ratio ( ” as defined by Sharpe (1966):
(6)
where, is the average annual rate of return and is the standard deviation of annual rate of return for fund j.
The main difference of Sharpe and Treynor measures is the way they define risk (which is the denominator of the rankings). For Sharpe, risk is the total volatility and for Treynor, risk is the beta which is the volatility explained by the movement of the market. When ex post measures are used Sharpe expects Treynor measure to be inferior since it doesn‟t include the
unsystematic (lack of diversification) part of the risk. On the other hand, for the future predictions under the assumption of portfolios will manage to diversify away the unsystematic risks they have, Treynor can provide a better estimate by focusing on the permanent systematic risk component.
Fama (1972) made an effort to provide a finer component breakdown of investment performance. Fama split the return into two parts which are the selectivity (ability of selecting best performing securities for a certain level of risk) and timing (prediction of the general market behavior). Fama further divides selectivity into net selectivity (the selectivity component which is gained beyond diversification) and diversification (return gained due to concentration) and the timing into manager‟s (risk taken beyond the investor‟s risk with the initiative of the portfolio manager) and investor‟s risk (the level of risk defined by the investor, target risk).
According to Treynor and Mazuy (1966), assuming that the markets move together, outguessing the market is simply adjusting the volatility of the portfolio according to general behavior of the markets- high volatility for bull and low volatility for bear markets. Then, it is not possible to define a
13
single characteristic line (as defined earlier by Treynor (1965)) and for a successful portfolio manager, the characteristic line will be relatively flat (steep) for bear (bull) markets. In other words, as the markets rise, the portfolio manager will increase the volatility of his portfolio (and vice versa) which will make the characteristic line concave upwards. Treynor and Mazuy added a quadratic term to the fitting formulation of the characteristic line:
(7)
Any statistical evidence of a positive is also a proof of convexity which is the ability of the portfolio manager to outguess the market. They also
investigated this convexity in 57 funds over 1953-1962 period data and found that there is only 1 fund with statistically significant curvature which of course can be an error assuming the %5 significance level.
Another effort to explain the slope difference of the characteristic line is the Henriksson and Merton (1981) model. Instead of the squared term of Treynor and Mazuy (1966) model which ensures the convexity of the characteristic line, they have solved the problem linearly.
(8)
and which
means represents the bear market beta (which represents the more flat part of the characteristic line) and is the bull market beta (which represents the steep part of the characteristic line).
Grinblatt and Titman (1989) in their work showed that measures like Jensen or Treynor and Mazuy are sensitive to the benchmark chosen. They have shown that, traditional industry indices can be beaten by passive investment strategies depending on firm characteristics like investing in small firms, high dividend yield firms or low beta firms. This reality of passive
investment strategies beating industry indices can either be diminished by using appropriate benchmarks or adding factors representing the effect of
14
those firm characteristics. Solution of Grinblatt and Titman (1989) was to use more appropriate benchmarks.
Fant and Peterson (1995), investigated the effect of size, book to equity ratio, past returns and market beta on stock market returns and also searched for any seasonality in the relations. Fant and Peterson, depending on their findings of positive skewness in book to equity ratios and prior studies showing relation between return and logarithm of size, suggests the following cross-sectional regression model:
(9)
where stands for the size of the firm, for book to market ratio, for return over the three prior years and for the beta of the security in relevant period forecasted over 100 days. Fant and Peterson concluded that despite strong seasonality, prior returns, size and book to market ratios are significant variables.
Fama and French (1993 and 1996), in their search for a model that can be used to predict future returns, suggests a 3-factor model:
(10)
where, SMB stands for small minus big sized firms and HML stands for high minus low book to market ratio firms‟ simple average return. SMB is the variable used to identify strategies depending on market capitalization and HML is the variable used to identify strategies depending on valuation. Fama and French in their work proves that with the addition of variables SMB and HML, 3-factor model can also capture anomalies related to certain firm characteristics that cannot be captured by CAPM. As a result, 3-factor model gives us a more refined for predicting the stock picking ability since most of the return arising from passive investment strategies related to fund characteristics can now be captured by SMB and HML.
15
Gruber (1996) tried to measure the performance of mutual funds with a 4-index model.
(11)
stands for the difference between a small cap and a large cap portfolio, which is comparable to Fama and French 3-factor model variable SMB. stands for the difference between a growth portfolio and a value portfolio, which is comparable to Fama and French 3-factor model variable HML. stands for the difference between corporate and government bond index. Working over the period of 1985 to 1994, Gruber concluded that there is some value added by portfolio management
activities, but it is not enough to cover the expenses. Contrary to the expected, Gruber indicated that a single factor model understates the
portfolio performance compared to a 4-index model. Gruber also found that there is persistence in performance and investors use this persistency information in their investment decisions.
One important lack of the models discussed above is that they cannot explain the continuity of short term performance. Hendricks, Patel and Zeckhauser (1990) found strong evidence of short term persistence and defined it as “hot (icy) hands” in good (bad) performance – short term superior (inferior) stock picking ability. Hendricks et al also stated that the persistence is stronger in bad performance. Grinblatt and Titman (1992) argued that the persistence in mutual funds is not due to passive investment strategies related to certain firm characteristics. They also stated that although part of the persistence can be explained by expenses of the fund, past performance is an important indicator of future performance. Later, Jegadeesh and Titman (1993) concluded that it is possible to generate excess return by buying good performing funds and selling bad performing funds.
16
Daniel, Grinblatt, Titman and Wermers (1997) also suggested that there is persistence. Daniel et al affirms that the persistence is due to the momentum effect in stocks, not due to the superior stock picking ability. In other words, the persistence is explained by the momentum strategies used by portfolio managers instead of the hot hands phenomenon. Ibbotson and Patel (2002), investigated whether the persistence of good performing funds still exists after the fund performance is adjusted according to the style of the fund. They have analyzed domestic equity funds in the period of 1975 to 2002 and found that, good performance persists and the level of persistence increases as the definition of good performance becomes tighter.
The continuity of short term performance anomaly is captured by Carhart‟s (1997) 4-factor model. Carhart adds a momentum factor to the 3-factor model of Fama and French:
(12)
where, PR1YR stands for a momentum variable to explain the continuity of short term performance which is calculated as the difference of one month lagged 11 month return of best and worst %30 firms‟ average. PR1YR, a significant variable for momentum effect, further refines the stock picking ability- - from another common passive investment strategy of buying last year‟s good and selling last year‟s bad performing funds. Carhart analyzed a data of 1892 funds from 1962 to 1993 – including funds which disappeared during that period. Although momentum is a statistically significant variable in explaining the variations in returns, he concluded that, funds applying momentum strategies of buying last year‟s good performing stocks, does not gain from this strategy since transaction costs are higher than the benefits.
Daniel, Grinblatt, Titman and Wermers (1997) suggested easy-to-calculate performance measures relative to the benchmarks chosen due to the
characteristics of securities held within the fund. Benchmarks are chosen among 125 alternatives, combinations of market capitalization, book to
17
market ratio and prior year return each consist of 5 classes. The idea of choosing among different benchmark alternatives is using the appropriate benchmark that will represent the investment style of the portfolio manager. Daniel et al suggested three components for portfolio performance
measurement: Characteristic selectivity ( ) measures the stock picking ability of the portfolio manager,
(13)
where is portfolio weight of stock at time , is the return of stock at time , is the month return of the benchmark matched to stock in time . Characteristic timing ( ) measures the timing ability of the portfolio manager,
(14)
where is portfolio weight of stock at time , is the month return of the benchmark matched to stock in time , is portfolio weight of stock at time , is the month return of the benchmark matched to stock in time . Average style ( )
measures the performance due to the tendency of holding stocks with certain characteristics.
(15)
component captures long term strategies which can also be called the style of the fund. Then, the total performance is measured as
(16)
Daniel et al investigated any stock picking ability (represented by ) for 2500 funds in 1975 to 1994. They concluded that with appropriate
benchmarks and measurement tools, there is stock picking ability. But this ability is not enough to generate extra profit and can only cover the
18
Ferson and Schadt (1996) argued that the unconditional measures developed recently are not adequate to capture the dynamic and changing investment decisions and thus suggested a conditional performance measure that incorporates the information publicly known. Ferson and Schadt is a form more than a model and can be implemented into different performance models. Ferson and Schadt studied the conditional form of Jensen, Treynor and Mazuy, Henriksson and Merton models. Basic form of the model is as follows:
(17)
can be interpreted as average beta, is the vector deviations from average information available, which the beta is conditioned, , are the excess return of portfolio and market over the risk free rate, respectively. Ferson and Schadt empirically demonstrated that using a conditional model is more effective on alphas compared to the four factor CAPM relative to one factor model. Another important empirical result of Ferson and Schadt is the fact that conditioning the model increases the average alpha from negative to zero.
Christopherson, Ferson and Glassman (1998) investigated corporate
investor specific differences compared to mutual fund management industry and further developed the model of Ferson and Schadt (1996) with
conditioning the alpha:
(18)
They found that alphas for certain portfolio managers are time varying mostly responding to information about treasury bill yield and dividend yield. Furthermore the concept of time varying alphas is used for measuring persistency and Christopherson, Ferson and Glassman concluded that there is a time decaying persistency in the alphas, mainly concentrated in bad performing managers.
19
3.2 Evidence From Different Countries
Blake and Timmerman (1998) investigated the effects of survivorship bias, evidence of over-performance and searched for performance patterns in UK with a survivorship bias free data including 2300 mutual funds over the period of 1972 to 1995. Differing in certain aspects, they have used a model for performance measurement based on the four index model of Gruber (1996) both in unconditional and conditional form. The unconditional model is as follows:
(19)
where stands for small cap stocks proxied by Hoare-Govett Small-Cap index and stands for return of five year UK government bond. They have found that, performance persists for good and bad performing funds over a 24 month of horizon, on average UK portfolio managers
underperform -1.8% annually. However, only the underperformance of general equity funds was statistically significant. Blake and Timmerman also investigated the effect of survivorship bias on mutual fund performance and concluded that the survivorship bias, bias from excluding non surviving funds, is 0.8% annually.
Dahlquist, Engström, Söderlind (2000) analyzed Swedish funds in search for a relation between attributes and the performance of funds. They have also investigated the effect of survivorship bias and if any, persistency in performance. They have classified Swedish equity funds into 2 sub classes: equity I for regular equity funds and equity II for special fund group
offering tax benefits. They have analyzed the performance of 80 equity I funds and 46 equity II funds over the period of 1992 to 1997. They have used both a unconditional and conditional model for evaluating performance of funds with two independent variables of market index and a small cap index. The conditional model is as follows:
20
(20)
Where stands for the small cap index. Conditional information used in the model is lagged market return and the level of the yield curve. They have found that equity I funds have an average alpha of 0.5% -fairly well performance since it is computed over net returns including an average annual management fee of 1.4% against costless benchmarks. Dahlquist et al. also indicated that the equity II funds underperform almost equal to the fees charged. They have found a survivorship bias of 0.7% in alpha, very similar to UK experience.
Abdel-Kader and Qing (2007) have investigated the ability of portfolio managers in Hong Kong, second largest market of Asia. They have applied one factor model (equation (2)), Fama and French three factor model (equation (10)) and Treynor-Mazuy quadratic model (equation (7)) to 30 funds in the period of 1995 to 2005. They found that single factor model underestimates the portfolio managers‟ performance compared to three factor model. They also compared the Treynor-Mazuy model with single factor model and concluded that there is no bias in alpha estimates due to ignored market timing ability. Abdel-Kader and Qing (2007) concluded that for all of the models tested, Hong Kong mutual fund managers
underperformed the market.
Christensen (2005) investigated any stock picking ability, market timing ability and performance persistence over 47 Danish funds in the time period of January 1996 to June 2003. Christensen first searched for stock picking ability in a single factor and a multi factor model, where he concluded that although Danish funds‟ charges are one of the lowest in the world, stock picking ability of Danish portfolio managers on average over net returns is neutral and so it‟s only enough to cover their fees. Christensen then
investigated market timing ability. He measured market timing ability by using Treynor and Mazuy model and Henriksson and Merton model,
21
equation (7) and (8), respectively. Although, arguing that the investment restrictions force portfolio managers to be good timers, he found neutral performance on average. Christensen also looked for persistence in Danish mutual funds. Contrary to the U.S. findings, he found no evidence of persistence.
Cai, Chan and Yamada (1997) analyzed the performance of Japanese mutual funds in the period of 1981 to 1992. They have found significant and
considerably low underperformance ranging from -6% to -11% per annum on different categories they have examined with Jensen‟s alpha. Cai et al also searched for the effect of passive strategies on alpha by using the Fama and French model and also conditioned it to separate any investment
strategy depending on the information available to market. They also calculated the positive period weighting measure (PPW). Japanese portfolio managers significantly underperform with all these performance measures. Cai et al also investigated market timing ability using Treynor and Mazuy model and found significantly negative timing ability. They have also searched for any persistence and opposed to most of the research done on US mutual funds, they found little or no persistence for Japanese funds. Cai et al relates some of the underperformance to the taxation of Japanese mutual funds causing a dilution effect.
Gökgöz (2008) analyzed whether the Fama and French 3 factor model has additional explanatory power compared to standard CAPM model over certain Istanbul Stock Exchange (ISE) indices. The study is interesting since it applies the 3 factor model in a developing market which is not mature yet. Gökgöz found that additional factors of SMB and HML have also
explanatory power over ISE stocks.
Doğanay (2004) applied CAPM both in unconditional and conditional (on both alpha and beta) sense over 14 stock funds in the period of July 2000 to August 2002. Publicly available information used in conditioning is US
22
dollar monthly return rate, industrial production index monthly variation and 30 days Government bond performance index. Doğanay found that the hypothesis that unconditional alpha and long term expected value of
conditional alpha ( in eq. 18)) are equal and cannot be rejected. Doğanay also found that alpha is a meaningful variable of future performance
prediction and conditional alpha has more prediction power compared to unconditional alpha.
4. Data
4.1 Definition of Data
Our data consists of monthly returns of funds in the February 2004 to December 2009 period. 46 mutual and19 pension funds are included in the study. List of funds used is provided in appendix B. The risk free rate is the 30 days bond index issued by Turkish Institutional Investment Managers Association. Market index is the ISE100 issued by Istanbul Stock Exchange.
Returns for funds used in analysis are obtained by dividing the change in the price of the fund by previous month-end price. All the funds taken into account are unit linked, with daily prices announced:
(21)
Where, is the return for month , is the price at the end of month , is the price at the end of month .
Prices are published after the deduction of fees and other expenses. A fund manager can be performing better, but his rank may change due to the level of fees and other expenses. So, some argue that, to measure the performance of a fund manager, gross returns before fee and expenses are more
appropriate. On the other hand, some argue that net return is more appropriate since net return is what the investor receives. It might be interesting to measure the performance over both the net and gross returns
23
and look for any significant difference, but our study measures the performance over net returns due to data limitations.
46 mutual funds included in the study are A type funds. A type funds invest at least 25% of their total assets under management at all times into
securities issued by Turkish companies. A type funds with an investment objective of an ISE index or foreign securities are excluded. Those funds are excluded since they have different investment objectives. Compared to the mutual funds included in the study, the “market” that they will be compared should be different.
Out of 19 pension funds included, according to Capital Markets Board (CMB) reports, 10 are classified as growth oriented, 1 is classified as income oriented and 8 are classified as other. Other category consists of pension funds which hold at least 15% of its assets as stocks on average from January 2004 to December 2009. Consistent with the mutual funds excluded, funds that heavily invest in foreign securities are excluded.
There are 139 funds which are not included in the study though they meet our criteria. Those funds are the funds that do not have an observation for the whole January 2004 to December 2009 period. In other words, our data does not contain neither the funds issued after January 2004 nor the funds closed or merged before 2009. Especially the exclusion of non surviving funds can create a survivorship bias: One can argue that, funds that could not survive, usually don‟t survive due to bad performance and hence, the exclusion of those funds and working with only surviving, successful funds can result in overestimated alphas. This issue will be analyzed separately.
Data is obtained from CMB‟s monthly bulletins. CMB began issuing monthly fund prices with fund codes in January 2004. The reason to use the CMB monthly bulletins to create our own price series instead of any time series of fund prices available is, the CMB monthly bulletins includes all the
24
funds available during that month while time series available in other
sources include only the funds which are available today. So, CMB bulletins provide us a very important information that will be used in the calculation of survivorship bias: the price information of funds that could not manage to survive until December 2009.
4.2 Errors corrected
The data used are obtained from monthly CMB bulletins. The bulletins are prepared and distributed in MS excel. Since the data used in the study is gathered from considerable amount of monthly reports held in excel, it can be exposed to 3 different potential errors
1. Errors made by us during the consolidation of monthly reports 2. Errors made by CMB specialists during the preparation of the
monthly bulletins
3. Changes in the codes in time that can go unnoticed
Main corrections made in the data are as follows:
1. Mutual fund prices in the February 2009 bulletin were incorrect so the February 2009 data was obtained from historical fund prices statistics page of CMB
2. Fund “EV1” price data was missing in the monthly bulletin for February and march 2005 and was obtained from historical fund prices
3. Fund “FYD” price data was missing in the monthly bulletin for June and July 2005 and was obtained from historical fund prices
4. Fund “IGH” price data was missing in the monthly bulletin for June 2008 was obtained from www.fonbul.com
25
5. Fund “TAD” price data was missing in the monthly bulletin for December 2006 and October 2007 was obtained from
www.fonbul.com
6. Funds “TZD” and “YAD” price data were missing in the monthly bulletin for December 2008 and were obtained from
www.fonbul.com
7. Fund “SMA” price data was missing in the monthly bulletin for January 2006 and was obtained from www.fonbul.com
8. Fund “MAD” price data was missing in the monthly bulletin for July 2007 and was obtained from www.fonbul.com
9. Fund “GPR” was coded as “BYD” in the monthly bulletin for months march, April and may 2004
10. Fund “YKA” was coded as “YHO” in the monthly bulletin for January, February, march, April and may 2004
11. Oyak Pension fund codes were mapped to appropriate ING pension fund codes until December 2008
12. Doğan Pension fund codes were mapped to appropriate Fortis Pension fund codes until October 2005
13. Commercial Union fund codes were mapped to appropriate Aviva fund codes until august 2004
14. Koç Allianz fund codes were mapped to appropriate Allianz fund codes until December 2008
15. DıĢbank fund codes were mapped to appropriate Fortis Bank fund codes until November 2005
16. Oyakbank fund codes were mapped to appropriate ING Bank fund codes until may 2008
17. Bankeuropa fund codes were mapped to appropriate Millennium Bank fund codes until October 2007
18. C Bank fund codes were mapped to appropriate Bankpozitif fund codes until January 2006
26
5. Survivorship Bias
It is argued that, funds with bad performance disappear in time since the demand for those funds will decrease. It is expected that, funds that manage to survive a certain period tend to perform better than funds which could not manage to survive and disappeared. So, any analysis that only includes the surviving funds will overestimate the average performance.
Our data contains 80 funds that disappeared during the time period of January 2004 to December 2009. Some of those funds disappeared simply because the portfolio management company disappeared, some merged with others, some changed the investment objective and the code and some suspended due to performance or other reasons. Since we are working with only surviving funds, we should be aware of any possible bias that can rise due to exclusion of those non-surviving funds.
Blake and Timmermann (1998) has analyzed the survivorship bias for UK equity funds and found that there is 0.8% per annum survivorship bias on average. Gruber (1996) examines the US data for 1985 to 1994 and argues that non surviving funds underperform the market almost 5% per annum while all funds underperform only 2% per annum. Malkiel (1995) analyzed 1982 to 1991 period and calculated that the average yearly return for all equity funds existed (including non surviving funds) during the period was 15.69% while funds survived until 1994 was 17.09% indicating a
survivorship bias of almost 1.5% return per annum. However, Grinblatt and Titman found very minor survivorship bias ranging from 0.1% to 0.4% per annum in alphas of US funds in the period of 1975 to 1984.
Blake and Timmermann (1998) had developed a measure for survivorship bias. They have simply calculated the difference between the average surviving funds return and the average return of all funds returns weighted
27
with the number of surviving and non surviving funds, and divide it into number of observations to come up with a average survivorship bias:
(22)
where stands for return, stands for number of funds, stands for number of time periods, and the subscripts stands for non surviving and stands for surviving funds. In this manner, means the average return for non surviving funds in time period
We have calculated the Blake and Timmermann bias for our data. Funds taken into account (we will call the funds taken into analysis surviving funds from now on) performs on average 0.86% per annum better than the non surviving funds, consistent with the evidence of UK funds in means of both sign and level. Taking into account the high volatility in Turkish markets, the bias is very minor but still, indicates that the surviving funds performed slightly better than the non surviving funds.
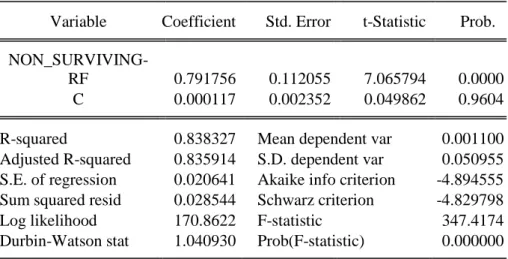
We can also measure the survivorship bias by regression analysis and the alpha. Comparable to Jensen alpha, if there is a bias which indicates that the surviving funds perform better than non surviving ones consistently, we should receive statistically significant and positive alphas from the following equation:
(23)
where stands for the average return of surviving funds and stands for the average return of the non surviving funds and is the risk free rate. The advantage is, while the Blake and Timmermann methodology provides us an survivorship bias, the regression provides an estimate of both the bias and its probability of significance. We have estimated the regression over 69 observations since for the last two periods (November and December 2009, there is no non-surviving fund data).
28
Table 2 - Survivorship bias results with non surviving funds as independent variable
Dependent Variable: SURVIVING-RF Method: Least Squares
Date: 03/21/10 Time: 14:29
Sample (adjusted): 2004M02 2009M10 Included observations: 69 after adjustments
Newey-West HAC Standard Errors & Covariance (lag truncation=3)
Variable Coefficient Std. Error t-Statistic Prob.
NON_SURVIVING-RF 0.791756 0.112055 7.065794 0.0000
C 0.000117 0.002352 0.049862 0.9604
R-squared 0.838327 Mean dependent var 0.001100
Adjusted R-squared 0.835914 S.D. dependent var 0.050955
S.E. of regression 0.020641 Akaike info criterion -4.894555
Sum squared resid 0.028544 Schwarz criterion -4.829798
Log likelihood 170.8622 F-statistic 347.4174
Durbin-Watson stat 1.040930 Prob(F-statistic) 0.000000
The regression results in table 2 presents us two important information: First of all, the significant beta might indicate that, non surviving funds are less volatile than the surviving funds due to a beta of less than 1. This issue can be further analyzed thoroughly, however, since the volatility differences of surviving and non surviving funds is not our focus point, we do not. Second, and the more valuable information for us in means of survivorship bias is that, the p-value of the intercept (alpha) is 96%, which means that with 5% confidence, we cannot reject the hypothesis that the alpha is not different from zero. We can say that, according to the regression results, we can confidently decide that there is not any statistically significant survivorship bias.
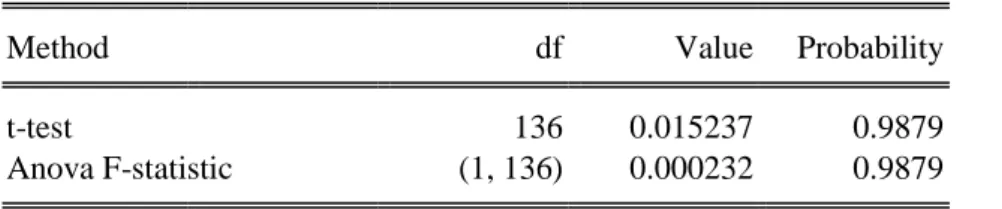
We can also, test the equality of averages and the variances of surviving and the non surviving funds. If the test results indicate that both time series are equal on means of average and variances, we can assert that there is no significant bias resulting from excluding the non surviving funds. Panel 1 of
29
table3 shows the result of equality test for means. Panel1 indicates that we cannot reject the null hypothesis that the two time series are equal with 98% probability. Panel 2 shows the results for equality of variances with various tests. All of the tests provide a p-value more than %10 which means that none of them provides us any evidence of differences of variances for surviving and non surviving funds.
Table 3 - Test of equality for surviving and non surviving funds for means and standard deviations
Panel1: Test for equality of means between series Sample (adjusted): 2004M02 2009M10
Included observations: 69 after adjustments
Method df Value Probability
t-test 136 0.015237 0.9879
Anova F-statistic (1, 136) 0.000232 0.9879
Panel2: Test of equality of variances between series Sample (adjusted): 2004M02 2009M10
Included observations: 69 after adjustments
Method df Value Probability
F-test (68, 68) 1.329617 0.2427
Siegel-Tukey 0.813331 0.4160
Bartlett 1 1.365091 0.2427
Levene (1, 136) 0.936117 0.3350
Brown-Forsythe (1, 136) 0.844639 0.3597
Turkish banking and insurance sector has gone through a serious
consolidation process within our time frame. Due to changing managements and mergers, some funds could not manage to survive. We have tried to calculate the impact of survivorship bias on our data. Our first step was to calculate the Blake and Timmermann bias which provided us with an average %0.8 per annum return difference between surviving and non surviving funds, a minor difference compared to Turkish volatile stock
30
markets. We have further tried to develop our own parametric test for survivor ship bias and the result was with %96 probability, surviving funds do not over perform non surviving counterparts. We further checked the equality of surviving and non surviving fund time series. Overall, with all the tests and measures taken into account, the results indicate that, Although it is minor, there is some survivorship bias yet, we do not have enough of evidence to prove it statistically.
Furthermore, Blake and Timmermann (1998) argue that funds slightly over perform after their issuance. Since we also do not include the funds that are issued after January 2004, besides the survivor ship bias due to exclusion of non surviving funds, we might be creating another bias due to exclusion of funds issued during the period. This bias can be called the exclusion bias – bias arising from exclusion of funds from our study and can be calculated with same tests used in survivorship bias calculations. So we have also repeated the tests argued above with all the funds excluded instead of only non surviving funds.
When the analysis is repeated with all excluded funds instead of non surviving funds, the average bias calculated with Blake and Timmermann tests decreases to %0.32 per annum and the equality tests still does not provide enough of evidence to affirm that means or variances of two series are different. the p-value of equation( 23) is almost 30% and the value of the intercept is 0.0005. As a result we can still say that the data excluded does not create any economically or statistically significant bias on the results. Furthermore, the fact that there is no significant bias between included and excluded data is also important in the sense that any data excluded
mistakenly during our consolidation efforts does not bias the results.
We have focused our calculations in this section on whether the data that we have included contains any bias compared to excluded or non surviving funds and concluded that even if there is any bias, it is small and ignorable.
31
We have also estimated regressions as described by Gruber (96) and compared the performance of included or excluded funds to test
survivorship bias. Since the results are parallel with the results presented above, for simplicity, we did not present them. Untill this point we have discussed whether our data has any bias or not. But we also have enough of data to discuss whether there is any survivorship bias in Turkish fund management industry: All surviving funds versus the non surviving funds. Since this is not related to our current work, we will discuss the issue in appendix A.
6. Performance Measurement Models and Results
We will try to identify any stock picking ability for portfolio managers with various models. First model we will apply is the single index model. Then we will shift to market timing models of Henriksson - Merton and Treynor - Mazuy. Those models add a market timing component into the equation with the assumption that portfolio managers adjust their beta according to market expectations. Then, we will discuss multi factor models of Fama - French and Carhart. Those models argue that there are certain stock
characteristics portfolio managers take into account during stock selection. Hence, any additional return over the market index due to passive strategies constructed on those characteristics should be eliminated from alpha by adding them as additional factors into the single index model. Models discussed until this point are unconditional models. Then we will apply the Ferson - Schadt framework to the models discussed above. Ferson – Schadt argues that beta is not constant and the fund managers adjust their betas according to publicly available information. Finally, we will also condition the alphas discussed above as described by Christopherson, Ferson and Glassman (1998)
Models that will be estimated for 65 funds and 1 equally weighted portfolio are discussed below:
32
6.1 Single Index Model
Single index model is developed by Jensen and is the most basic form. Jensen argues that, if a portfolio manager has any stock picking ability he will be constantly performing better than the market. That is, a regression between the excess returns of the fund and market will generate positive error terms. Jensen added a constant term to the regression, which we call the Jensen alpha, and created the equation (2).
The intercept of the equation (2) is the Jensen‟s alpha. The strength and the popularity of Jensen‟s alpha is because it provides an easy to calculate and absolute measure. A positive alpha of % estimated over monthly data means, on average the fund manager beats the market by % per month.
The exact definition of variables used in equation (2) is as follows:
Where is the level of 30 days bond index issued by Turkish Institutional Investment Manager‟s Association at the end of month
Where is the level of ISE100 index issued by Istanbul Stock Index at the end of month
Where the price of the fund j as is published in the monthly bulletin of CMB at the end of month . As discussed before, the prices used are after fees and expenses and thus the returns are net of fee and expenses.
There is a wide variety of Jensen‟s alpha applications throughout the world in different time periods. Jensen (1967) calculated the alpha for 115 equity funds in the period of 1945 to 1964. He found that on average funds
33
underperform the market by 1.1% per annum. Jensen also stated that the histogram of alphas is skewed to the left where 76 of the funds have negative alphas. Later, Ippolito (1989) estimated the alphas for the fallowing 20 years – from 1965 to 1984 for 143 funds and found that, on average funds over performed the market by 0.81% per annum. Contrary to Jensen, Ippolito also found that 12 of the funds have significant positive alphas, while 4 have significant negative alphas. Malkiel (1995) estimated the single index model for surviving U.S. general equity funds in the period of 1972 to 1991 and found that on average the alpha is slightly negative but indifferent from zero with 5% confidence. He also analyzed the funds individually and found that almost same amount of funds are significantly positive and negative, 23 and 26 respectively. Cai, Chan and Yamada (1997) applied the single index model to 64 Japanese mutual funds in the period of 1981 to 1992. According to their results, out of 64 funds, 61 have negative alphas where 30 of them are significant with 5% significance. Christensen (2005) applied the single index model, to 47 Danish funds in the time period of January 1996 to June 2003. He concluded that mainly, alphas are negative but insignificant. There are only 6 funds with alphas different form zero with 5% significance, where all of them are negative. Later, Abdel-Kader and Qing (2007) applied the single index to 30 funds in the period of 1995 to 2005. They have grouped 30 funds into 5 types. They have found that, all fund types generated negative alphas where 4 of them are significant with %5 confidence.
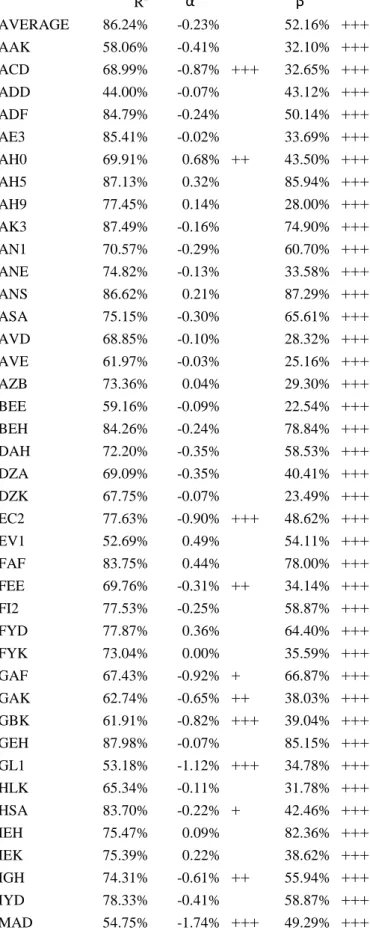
According to our single index results, the monthly average alpha is -0.22%. which can be interpreted as that on average, the fund managers
underperform the market by almost %2.64 per annum. Out of 66, there are 48 funds with negative alphas. The alphas change from 1.38% to -1.74%. Out of 66 alphas estimated only 22 of them are significantly different from zero with %90 probability. Out of those 22 only 2 are positive. Positively significant funds are AH0 and ST1. On average, single index model explains %72 of the fluctuations in equity funds.
34
Table 4 - Single Index Model Results – Equation (2) Adjusted R2 α β AVERAGE 86.24% -0.23% 52.16% +++ AAK 58.06% -0.41% 32.10% +++ ACD 68.99% -0.87% +++ 32.65% +++ ADD 44.00% -0.07% 43.12% +++ ADF 84.79% -0.24% 50.14% +++ AE3 85.41% -0.02% 33.69% +++ AH0 69.91% 0.68% ++ 43.50% +++ AH5 87.13% 0.32% 85.94% +++ AH9 77.45% 0.14% 28.00% +++ AK3 87.49% -0.16% 74.90% +++ AN1 70.57% -0.29% 60.70% +++ ANE 74.82% -0.13% 33.58% +++ ANS 86.62% 0.21% 87.29% +++ ASA 75.15% -0.30% 65.61% +++ AVD 68.85% -0.10% 28.32% +++ AVE 61.97% -0.03% 25.16% +++ AZB 73.36% 0.04% 29.30% +++ BEE 59.16% -0.09% 22.54% +++ BEH 84.26% -0.24% 78.84% +++ DAH 72.20% -0.35% 58.53% +++ DZA 69.09% -0.35% 40.41% +++ DZK 67.75% -0.07% 23.49% +++ EC2 77.63% -0.90% +++ 48.62% +++ EV1 52.69% 0.49% 54.11% +++ FAF 83.75% 0.44% 78.00% +++ FEE 69.76% -0.31% ++ 34.14% +++ FI2 77.53% -0.25% 58.87% +++ FYD 77.87% 0.36% 64.40% +++ FYK 73.04% 0.00% 35.59% +++ GAF 67.43% -0.92% + 66.87% +++ GAK 62.74% -0.65% ++ 38.03% +++ GBK 61.91% -0.82% +++ 39.04% +++ GEH 87.98% -0.07% 85.15% +++ GL1 53.18% -1.12% +++ 34.78% +++ HLK 65.34% -0.11% 31.78% +++ HSA 83.70% -0.22% + 42.46% +++ IEH 75.47% 0.09% 82.36% +++ IEK 75.39% 0.22% 38.62% +++ IGH 74.31% -0.61% ++ 55.94% +++ IYD 78.33% -0.41% 58.87% +++ MAD 54.75% -1.74% +++ 49.29% +++
35 Table 4 (cont.) SAD 76.07% -0.82% +++ 43.25% +++ SMA01 52.18% -0.59% + 44.42% +++ ST1 66.76% 1.38% ++ 83.08% +++ TAD 61.35% -0.74% +++ 23.39% +++ TAH 71.53% 0.33% 64.77% +++ TCD 79.73% -0.84% +++ 49.72% +++ TE3 80.93% -0.38% ++ 48.01% +++ TI2 84.97% -0.20% 70.23% +++ TI3 69.94% 0.01% 73.30% +++ TI7 72.39% -0.36% 47.24% +++ TKF 67.45% -0.07% 39.22% +++ TKK 79.85% -0.02% 37.44% +++ TUD 37.64% -0.41% 76.67% +++ TYH 84.15% -0.25% 78.60% +++ TZD 75.75% -0.46% +++ 37.96% +++ TZK 79.85% -0.28% 40.78% +++ VAF 79.21% -0.35% ++ 46.30% +++ VEE 60.73% 0.01% 17.71% +++ VEH 82.72% 0.23% 79.86% +++ YAD 64.53% -0.68% ++ 45.23% +++ YAF 79.59% -0.28% + 41.25% +++ YAK 80.73% -0.19% 42.32% +++ YEE 48.13% 0.13% 18.56% +++ BZA 71.16% -0.85% + 74.23% +++ YEH 86.00% 0.11% 85.99% +++ Average 72.11% -0.22% 50.55% Max 87.98% 1.38% 87.29% Min 37.64% -1.74% 17.71% + significant at %90 confidence ++ significant at %95 confidence +++ significant at %99 confidence
36
As discussed before, is upward biased thus, the Jensen‟s alpha is actually downward biased. The regression results show significant and positive betas so we might be underestimating the alpha of Turkish fund managers. The details of the results are presented below.
6.2 Henriksson – Merton Model
Henriksson – Merton model was developed in order to identify any market timing ability. The beta of the single index model provides us with a measure for market sensitivity. If the beta is high, the fund will be affected from the market fluctuations more and vice versa. If the fund manager has timing ability, then he will increase his beta in good times and decrease it in bad times. Henriksson and Merton assume that, fund managers can predict the direction of the market, but not the magnitude. In other words, fund managers receive a signal for the state of the market in a binary form: either good or bad. The form of the equation (8) estimated is as follows:
(24)
Where,
Henriksson and Merton argues that, while alpha provides us a stock picking ability, a positive and significant means that the fund manager can change his market exposure so that he can time the market.
Henriksson (1984) analyzed 116 open end mutual funds within the period of 1968 to 1980. Henriksson states that the alpha is slightly lower when the market timing component is ignored and single index model is used. Henriksson also found out that only 3 funds have significantly positive which means U.S. fund managers does not have any timing ability – a result in line with our findings. Christensen (2005) applied the Henriksson – Merton model to 47 Danish funds in the time period of January 1996 to June 2003. He found that; although the alphas do not change much, the average
37
alpha slightly decreases from -0.58 to -1.02. He also concluded that the Danish market does not have any timing ability.
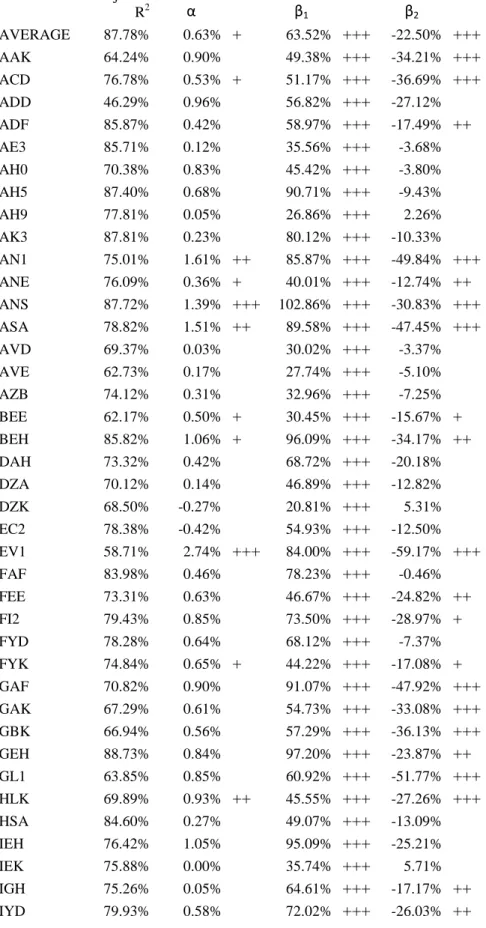
With the addition of a market timing component to the single index model, the average alpha has increased to 0.65% which means a yearly over performance of almost 7.8%. contrary to the single index model results, 36 of the funds generated significant alphas where half of them are
significantly positive. And the alphas ranged from -0.70% to 3.55%. Market timing results show that on average, the market timing is negative. There are 38 funds with significant timing variable where all of them are negative. The results indicate that, Turkish mutual funds have stock picking ability. But they lack timing. Due to a missing timing component the alpha seems negative in CAPM, but with the addition of timing component in
Henriksson – Merton model, alpha shifts to positive while the timing ability is negative. In other words, we can say that with the addition of a market timing component, the number of significantly negative alphas has declined dramatically. This can be due to market timing inefficiencies decomposed from alpha with the addition of a market timing component. The results for Henriksson – Merton model are presented in table (5)