ISSN 1303-6009
This work is a part of the project, Visual Driver Assisting System Algorithm Development, supported by grants from the Office of Scientific Research Projects of Ankara University (Project Number: 15Ö0443005).
© 2016 Ankara University Communications Faculty of Sciences University of Ankara Series A2-A3: Physical Sciences and Engineering
REAL TIME TRAFFIC SIGN DETECTION AND RECOGNITION
BETÜL ARSLAN1, TURGUT BÜYÜKKAYA2 AND HAKKI ALPARSLAN ILGIN3 1,2,3Ankara University, Faculty of Engineering, Electrical and Electronics Eng. Dept., 06830, Gölbaşı,
Ankara, TURKEY,
E-mail: 1[email protected] 2[email protected], 3[email protected]
(Received: October 31, 2016; Accepted: December 22, 2016 )
ABSTRACT
Image processing applications can provide a safer and less exhausting driving experience for drivers. In this paper, a real time traffic sign identification based on color thresholding, regional color density and recognition via principle component analysis algorithm is implemented. Also problems which may cause traffic signs not to be recognized are studied and necessary improvements are made.
KEYWORDS: Traffic Sign Detection, Traffic Sign Recognition, Color Space, Eigenfaces
1.
INTRODUCTIONTraffic accidents may cause serious injuries, financial damage and death. Although preventive laws and public service ads are in use in recent years they're not enough to prevent accidents by their own. Visual, cognitive, physical and auditory distractions may reduce driver's awareness and affect driving performance [1].
There are three prevalent approaches in traffic sign recognition: color based, shape based and learning based [2]. Benallal and Meunier used a simple threshold formula to detect red color in RGB (Red Green Blue) images [3]. Kuo and Lin used thresholding in HSI (Hue Saturation Intensity) color space to detect red pixels [4]. Paclik et al. and Fang et al. used thresholding in HSV (Hue Saturation Value) and similarity measurement in HSI to detect any color respectively [5,6]. Despite being the simplest method, solely color based approach can result in unreliable outcomes because colors tend to be different
2.
METHODThe main purpose of this study is real time detection and recognition of traffic signs to inform the driver using a video camera attached to vehicle. Essential steps are as follows:
Obtaining video frame
Changing the color space from RBG to HSV
Color thresholding
Analyzing regional color density
Masking regions which have high color density
Cropping the masked regions
Converting masked regions into gray level images
Improvement of gray level images
Matching via recognition algorithm
Informing the driver according to output of recognition algorithm These processes are jointly discussed in the following subsections and Experimental Results section.2.1. OBTAINING FRAME
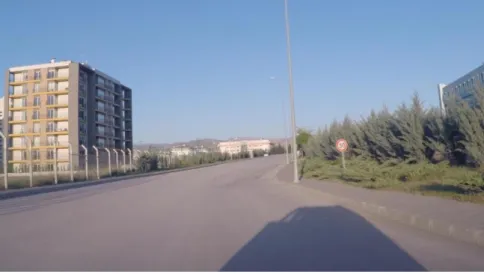
Frames that are intended to be processed are taken from a pre-recorded or a live video, which has 1920x1080 pixels spatial resolution (full HD). Temporal resolution of the video is 25 frames per second. A sample frame from the recorded video stream is shown in Figure 2.1. To reduce the work load of
processor and process time only one frame from every five to every twenty five frames can be selected according to the speed of the vehicle. Also it is not required to process every frame to recognize traffic signs since once a sign is recognized, driver is informed about what it is. A heuristic frame selection method is shown in Experimental Results section.
Figure 2.1 A sample frame from video sequence
2.2 CHANGING THE COLOR SPACE
Frames which are taken for processing from the video are in RGB color space (Figure 2.2(a)). RGB color space consists of three main colors, red, green and blue, and their combinations. Every pixel in frame is represented by a mathematical value, which differs between 0 and 255. The main drawback of this color space is that it is affected by lighting conditions [11, 12]. Depending on weather conditions, shadows or ambient lighting, color of a traffic sign varies in RGB color space. This variance may not be visible to human eye, but computer vision systems can detect these changes.
To solve the varying color problem frames are processed in HSV color space instead of RGB color space. HSV stands for hue, saturation and value as shown in Figure 2.2(b). HSV is a common representation of RGB color space in cylindrical coordinates. To eliminate the effects of lighting conditions, hue and saturation levels are selected in a heuristic way and value is adjusted in a broad range.
2.3 COLOR THRESHOLD AND REGIONAL COLOR DENSITY
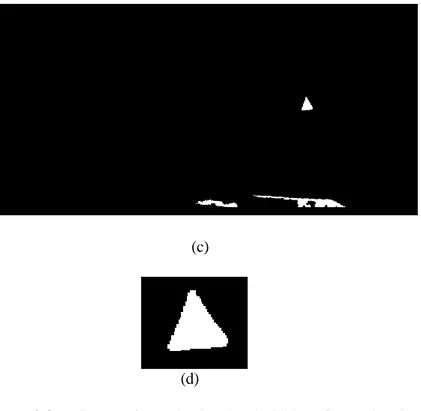
After color space is changed from RGB to HSV, regions, which consist of specified blue and red colors, are determined via color thresholding. Pixel values which are greater than the threshold are set to one and the rest of the image is set to zero (Figure 2.3 (a)). Although this action ensures eliminating other objects in the image, there still may be some regions that have the same color characteristics but aren't traffic signs [11, 13, 14]. To get rid of these regions two elimination procedures are implemented as shown in Figure 2.3.
Regional Color Density: Black and white image obtained in the previous thresholding process is further analyzed to check if number of connected white pixels is less than a predetermined value of p. In an image each pixel is connected with another 8 pixels in the two dimensional neighborhood [15]. The value of p is to be heuristically selected, the regions that consist of less than p white pixels, which are connected, are blackened. (Figure 2.3 (b)) Thus small red/blue sign pieces or red traffic lights are deleted from the scene. Edges of the other regions are determined, outlined and filled
with white pixels (Figure 2.3 (c)). For edge detection we used Sobel’s algorithm [15, 16]
1..Aspect Ratio: After the outlined regions are obtained, these areas are clipped from the original image (Figure 2.3 (d)). Based on current traffic signs an aspect ratio range is determined and only the ones that fit this ratio is taken for further processing. This pre-elimination process prevents regions with no traffic signs to be processed, resulting in a faster processing time and fewer false recognition rate
(a)
(c)
(d)
Figure 2.3 (a) Image after red color threshold (b) After regional color
density operation (c) Areas that may contain traffic signs (d) Cropped area (traffic sign candidate)
An example of applied operations after thresholding are briefly shown in Figure 2.4. From left to right, in the first matrix, there are pixels with value of 1 that are not in the neighborhood of each other, such as the one at the second column of the fifth row. In the second matrix, a pixel with value of 1 that is in the vertical, horizontal or diagonal neighborhood of less than p pixels with the same value is set to zero. In the third matrix, pixels with value of 0 surrounded or connected by the pixels with value of 1 are set to 1. Last matrix is obtained
by clipping the previous matrix with values of 1 at the borders. This final matrix is used to mask the region of possible traffic sign.
2.4. RECOGNITION ALGORITHM
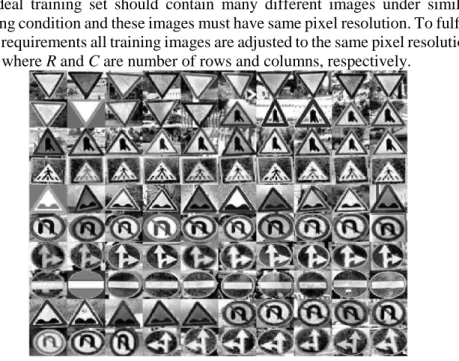
After implementing threshold and elimination processes, recognition algorithm is used to determine if outlined region contains a traffic sign. Before applying recognition algorithm, image is converted to gray scale. In order to increase recognition success, histogram equalization is performed on gray scale images. To get a highly accurate recognition in an unsteady environment like traffic we use Eigenfaces [10] approach. Developed by Sirovich and Kirby in 1987 this approach uses information obtained from training images via PCA (Principal Component Analysis). Using PCA with M training images we can obtain a basis set that consists of N images where N<M. Some of the samples from our training set is shown in Figure 2.5. These N images in the basis set are called Eigenimages, and they can be used to reconstruct a particular original image in the training set when linearly combined.
An ideal training set should contain many different images under similar lighting condition and these images must have same pixel resolution. To fulfill these requirements all training images are adjusted to the same pixel resolution RxC, where R and C are number of rows and columns, respectively.
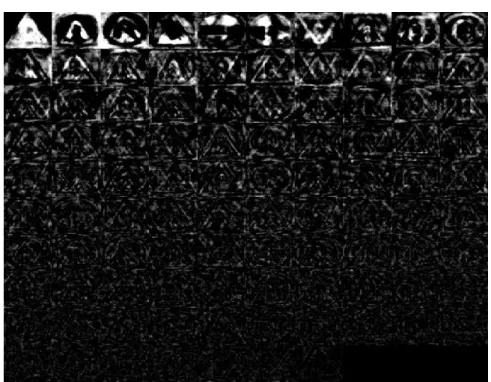
smaller. Consequently, using all Eigenvalues will not increase the recognition success prominently.
Figure 2.6 Eigen images
Finally, Euclidean distance between cropped area from video frame and Eigenimages from the training set is calculated, and traffic sign is classified according to minimum Euclidean distance [17, 18].
3.
EXPERIMENTAL RESULTSExperiments are implemented in two stages. At the first stage, detection rate is determined. Recognition success is then studied. Results are evaluated together. A laptop PC running Windows 10 and Matlab R1014b with 3.0GHz Intel i7-4720HQ processor and 32 GB DDR3 800 MHz RAM and a camera are used in the experiments.
3.1. DETECTION
The objective of this study is real time recognition of traffic signs. Therefore, reducing processing time has a significant issue besides true recognition rate. To recognize traffic signs thoroughly frames should be processed in an appropriate frame cycle. Long cycles will cause loss of frames with traffic sign and short cycles will end up with increased processing time and work load. Thus appropriate cycle is calculated considering the speed of vehicle and processing time of a frame. For instance, a vehicle with 80 kph speed travels approximately 22.2 meters in a second. An examination of a predetermined route shows there are roughly one traffic sign in every 50 meters in city centers. Consequently, processing a frame in every 2 seconds should be enough. Therefore, one in every 56.25 frames is appropriate to catch traffic signs at the speed of 80 kph. However, this theory does not work as predicted because some of traffic signs are too small to be detected due to distance, and also faster highways where vehicles travel at higher speeds should be considered. According to General Directorate of Highways of Turkey, traffic signs should not be placed closer than 100 meters to each other in highways and main roads [19]. A vehicle with 132 kph speed (maximum speed allowed in highways) travels 37 meters per second. The proposed algorithm processes a frame approximately in 0.4 seconds. Therefore, it is able to processes traffic signs without skipping one while the vehicle travels at maximum speed allowed by regulations. Even at much higher speed rates, processing a frame with/without traffic sign(s) is completed before the next traffic sign appears.
1/10 97.5
Table 3.1 shows processing one frame in every 25 frames ensures 95% detection rate which is tolerably satisfying considering there are corrupted traffic signs in the video. Beyond that detection percentage does not go up remarkably. Some traffic signs that cannot be detected are shown in Figure 3.1.
Figure 3.1 Damaged traffic signs which cannot be detected and
recognized in this study
3.2. RECOGNITION
To test the prosperity of recognition performance, a training set that contains 100 images of 8 different traffic signs and 16 test images are studied. Successful recognition rate of 88% is achieved. It is possible to get higher
success rates by using more training images. After using histogram equalization to reduce lighting differences on both training set images and test images the recognition rate goes up to 94% as shown in Figure 3.2.
Figure 3.2 Matching outcomes of recognition experiment (left: test images,
right: matched training images according to recognition algorithm)
3.3. OVERALL RESULTS
The proposed detection and recognition algorithm in this study is tested on 25 fps videos with 1920x1080 resolution. Among 53 traffic signs 13 are unable to be detected due to damaged physical status. True and false traffic sign recognition rates are calculated in regard to detected traffic sign number. Results are shown in Table 3.2.
Table 3.2 Overall detection and recognition results
# %
Total traffic signs 53 100
Detected traffic signs 40 75.47
Undetected traffic signs 13 24.52
optimal frame cycle and also outline regions in a frame that have possible traffic signs using predetermined control parameters such as threshold levels and traffic sign aspect ratio as well. Frame cycle approach also decreases memory requirement. Our approach is suitable for all speeds of a vehicle since distance of traffic signs varies for different roads. For instance, distance between two signs in a highway are more than the one in a narrow street with speed limits. Proposed algorithm also considers not one but all regions with possible traffic signs according to their color threshold and density. Using Eigenfaces approach to recognize traffic signs have many advantages such as training sets are easy to form and created only once and can be used many times as it can be updated according to needs, and statistical complexity is greatly reduced for real time application. In order to increase success rate, we use histogram equalization for outlined images before Eigenfaces approach. It is also possible to improve quality and contrast of the images using appropriate techniques to obtain successful recognition rates under different weather and visibility conditions.
REFERENCES
[1] Mobile phone use: A growing problem of driver distraction. Geneva, Switzerland, World Health Organization, 2011.
[2] Brkic, Karla. "An overview of traffic sign detection methods." Department of Electronics, Microelectronics, Computer and Intelligent Systems Faculty of Electrical Engineering and Computing Unska 3 (2010): 10000.
[3] Bénallal, Mohamed, and Jean Meunier. "Real-time color segmentation of road signs." Electrical and Computer Engineering, 2003. IEEE CCECE 2003. Canadian Conference on. Vol. 3. IEEE, 2003.
[4] Kuo, Wen-Jia, and Chien-Chung Lin. “Two-stage road sign detection and recognition” Multimedia and Expo, 2007 IEEE International Conference on, pp. 1427–1430, July 2007.
[5] Paclı́k, Pavel, et al. “Road sign classification using laplace kernel classifier” Pattern Recogn. Lett., vol. 21, no. 13-14, pp. 1165–1173, 2000 [6] Fang, Chiung-Yao, Sei-Wang Chen, and Chiou-Shann Fuh. "Road-sign detection and tracking." IEEE transactions on vehicular technology vol. 52, no. 5, pp. 1329–1341, Sep. 2003.
[7] Paulo, Carlos Filipe, and Paulo Lobato Correia. “Automatic detection and classification of traffic signs” in Image Analysis for Multimedia Interactive Services WIAMIS ’07. Eighth International Workshop on, June 2007.
[8] Loy, Gareth, and Nick Barnes. “Fast shape-based road sign detection for a driver assistance system” in In IEEE/RSJ International Conference on Intelligent Robots and Systems (IROS) 2004, pp. 70–75.
[9] Mikolajczyk, Krystian, Andrew Zisserman, and Cordelia Schmid. "Shape recognition with edge-based features." British Machine Vision Conference (BMVC'03). Vol. 2. The British Machine Vision Association, 2003.
[10] Sirovich, Lawrence, and Michael Kirby. "Low-dimensional procedure for the characterization of human faces." Josa a 4.3 (1987): 519-524. 4
(3): 519–524
[11] Fleyeh, Hasan, and Mark Dougherty. "Road and traffic sign detection and recognition." Proceedings of the 16th Mini-EURO Conference and 10th Meeting
Guidance, I. Masaki, Ed. Berlin, Germany: Springer-Verlag, 1992, pp. 162-172.
[15] P. Sharma; M. Diwakar; N. Lal (2013). “Edge Detection using
Moore Neighborhood”.
International Journal of Computer Applications Volume 61– No.3, January 2013
[16] Shrivakshan, G. T., and C. Chandrasekar. "A comparison of various edge detection techniques used in image processing." IJCSI International Journal of Computer Science Issues 9.5 (2012): 272- 276.
[17] M. Turk; A. Pentland (1991). “Eigenfaces for recognition”, Journal of
Cognitive Neuroscience 3 (1):71-86.
[18] Kalita, Jeemoni, and Karen Das. "Recognition of facial expression using eigenvector based distributed features and euclidean distance based decision making technique." arXiv preprint arXiv:1303.0635 (2013). [19] Trafik İşaretleri El Kitabı, Trafik Güvenliği Dairesi Başkanlığı, Trafik