See discussions, stats, and author profiles for this publication at: https://www.researchgate.net/publication/286092040
Utilization of Power Analysis in Horticulture
Article · January 2006 CITATIONS 2 READS 20 1 author:
Some of the authors of this publication are also working on these related projects:
Procedure of Mars Algorithm for Describing the Relationship between Body Weight and Morphological Traits of Some Migratory Birds in Igdir Province of Turkey View project
Statistical analysis of Beef cattle enterprise data through MARS and Bayesian Adaptive Regression Splines via R software View project Ecevit Eyduran
Igdir Üniversitesi
170 PUBLICATIONS 690 CITATIONS SEE PROFILE
© 2006, INSInet Publication
Corresponding Author: Ecevit Eyduran,Biometry Genetics Unit, Department of Animal Science, Agricultural Faculty, University of Yüzüncü Yıl, 65080, Van-Turkey
Utilization of Power Analysis in Horticulture
1
Ecevit Eyduran,
2S. Peral Eyduran,
1Taner Özdem¥r and Y. Sabit Agaoglu
1Biometry Genetics Unit, Department of Animal Science, Agricultural Faculty,
University of Yüzüncü Yıl, 65080, Van-Turkey
2
Department of Horticulture, Agricultural Faculty, University of Ankara, 06110, Ankara-Turkey
Abstract: The aim of this study was to determine associations and the values of power analysis as their
reliability degrees between Year or Cultivars and traits such as fruit weight (FW), total acid (TA) and, the soluble substance that can be dissolved in water (SSDW) from various ten raspberry cultivars in an adaptation study regarding horticulture field by using Chi-Square and Likelihood Ratio Chi-Square statistics after FW, TA and SSDW were categorized as binary (low and high). Association between FW and CULTIVAR, association between SSDW and YEAR, association between SSDW and CULTIVAR, association between TA and CULTIVAR were much more significant (P<0.001). Besides, corresponding power values for Chi-Square and Likelihood Ratio Chi-Square statistics were very close on each other and had a reliability of approximately 100% and enough sample size. Contrary to these four contingency tables, associations between both FW-YEAR and TA-YEAR were non-significant and non-reliable because corresponding power values for Chi-Square and Likelihood Ratio Chi-Square statistic were 50-51% (a power of moderate-level) and 22-23% (power of low level), respectively and sufficient sample sizes for both FW-YEAR and TA-YEAR should be 240 and 560, respectively in order to provide a power of 80%. As a result, in order to be obtained reliable results and determined enough sample size in Chi-Square and Likelihood Ratio Chi-Square Statistics, power analysis should be performed.
Key words: Chi-Square, Likelihood Ratio Chi-Square Statistics, Power Analysis, Raspberry, Horticulture,
Fruit weight, Total acid, SSDW.
INTRODUCTION
Chi-Square and Likelihood Ratio Chi-Square statistics have been commonly used as criteria of independence and goodness of fit in contingency
table[4,9,3,5]. However, it is well-known that Likelihood
Ratio Chi-Square statistics were generally preferred to other when observed frequencies of the cells of a contingency table were less than five and sample sizes
were very small[1,5]. Besides, in the event that total
sample size was enough, both statistics might give similar
results[1,5]. To select the better of these two statistics,
researchers should perform power analysis as regards them, which give an idea to one about whether sample sizes will be enough. The most important question for a researcher is “How many observations should we survey to ensure statistics having a power of %80-90”? Moreover, it should be forgotten that non-significant results for both statistics does not guarantee independence. On the other hands, if power values for both are too-low (for example, a power of %20-40), the experiment that one carried out is not sensitive enough to determine dependent.
As a result, one of important things for a researcher is to get a reliable result as statistical analysis. For this reason, ones might utilize of Power Analysis for every trial regarding all scientific areas. After traits such as fruit weight (FW), total acid (TA) and, the soluble substance that can be dissolved in water (SSDW) from various ten raspberry cultivars in an adaptation study (regarding
horticulture field which was carried out by Atila et al.[2])
were categorized as binary (low and high), categorized traits with both year and cultivars were one by one formed contingency tables. Hereafter, by using special SAS macro regarding Chi-Square and Likelihood Ratio
Chi-Square statistics[8], the present paper aimed:
First, what was examined was an association between any trait and year or cultivars? Second, power analysis of statistics such as Chi-Square and Likelihood ratio Chi-square (which is called as G test) on all contingency tables were performed using a Special SAS macro (http://ftp.sas.com/techsup/download/stat/powerrxc.html). Third, in point of determination of power values and ideal sample size, this paper gave to place to whether the values of power analysis in contingency table as regards samples from various ten raspberry cultivars in horticulture area were suitable and reliable.
J. Appl. Sci. Res., 2(11): 931-935, 2006
MATERIALS AND METHODS
Materials: The materials that were used for this research
were Rubin, Summit, Holland Short, Heritage I, Heritage II, Tulameen, Aksu Red, Nuburg, Canby and Willamette. The pomological characteristics (Fruit weight, Total acid and SSDW) of raspberry species were investigated and compared with each other. What’s more, it was searched whether the single or double product of Heritage is more economical. This research was conducted between the
years of 2002 and 2005[2].
Rubin: A variety which is thorny and has pink flowers. Summit: A variety which has bigger thorns than Rubin
and has white flowers. It is fruitful in both spring and autumn.
Holland Short: A variety which has thorny and has
pink-white flowers. It is fruitful in both spring and autumn.
Heritage: A variety which has thorny and has pink-white
flowers. It is divided into two varieties Heritage I and Heritage II. While Heritage I is fruitful in spring, Heritage II is in both spring and autumn.
Tulameen: A variety which has thorny and has white
flowers.
Aksu Red: A variety has got big fruit and has small
thorny.
Nuburg: A variety has got big fruit and has small-yellow
thorny.
Canby: A variety which has thorny and strong of winter. Willamette: A variety has got big fruit and small thorny.
It is strong of winter and fruitful.
A total of 120 sample sizes were used for each trait.
Methods: Traits such as fruit weight (FW), total acid
(TA) and, the soluble substance that can be dissolved in water (SSDW) obtained from various ten raspberry Table 1: The cut-off values for each trait
Low amount (1) High amount (2) Trait (equal and less than) (equal and more than)
FW 19.17 19.18
TA 20.31 20.32
SSDW 27.71 27.72
FW: Fruit weight; TA: Total acid; SSDW: the soluble substance that can be dissolved in water
Table 2: Types of errors regarding hypothesis testing
Researcher’s Decision
General ---Case Reject H0 Do not Reject H0
H0 true Type I error probability Correct decision probability
(α) (Significance level) (1-%) (Confidence level) H0 false Correct decision probability Type I error probability (β)
(1-β) (POWER)
cultivars divided into two categorizes, namely, low (1) and high (2) weight as binary. Mean of each trait was calculated then each value was assigned as 1 (low) when values were less than mean value; otherwise as 2 (high). The cut-off values of assigned values for each trait are presented in Table 1. For example: if one value for FW in data set is 20.88, new value for it can be assigned as 2.
The notation of Chi-Square (1) and Likelihood Ratio Chi-Square statistics (2) are given below[3,1,6]:
(1) 2 2 i i
(f f )
x
f
−
=
∑
(2) if
G 2
f.ln
f
⎛ ⎞
=
⎜ ⎟
⎝ ⎠
∑
Where, f, observed frequency and fi,expected frequency.
According to Table 2, the statistical significance of
a test is the probability that the null hypothesis (H0) will
be rejected when it is true. Besides, Power of a test is the probability (1-f) that researchers will reject it when null
hypothesis (H0) in reality is false. Power value desired
should be at least 80 % as to statistics criteria[1].
Power Theory for Chi-Square and G Statistics:
Assume that H0 is the same to model M for a contingency
table. Let πi indicate the true probability in ith cell and
Let πi(M) represent the value to which the Maximum
likelihood (ML) estimate πi for model M converges,
where Σπi = Σπi (M). For multinomial sample of size n,
the non-centrality parameter for Chi-Square (3) can be expressed as follows: (3)
[
]
2 i i i i(M)
n
(M)
π − π
λ =
π
∑
Expression 3 is the similar form as Chi-Square statistics, with for the sample proportion pi and πi in place
of πi. The non-centrality parameter for Likelihood Ratio
Chi-Square Statistics (4) can be written in this manner: (4) i i i i
2n
log
(M)
π
λ =
π
π
∑
RESULTS AND DISCUSSIONS
The values, probability and power values of Likelihood Ratio Chi-Square and Chi-Square Statistics in all contingency tables which were calculated for alpha=0.05. Examining Table 3, the values, probability and power values of Likelihood Ratio Chi-Square and Chi-Square Statistics regarding other contingency tables except for contingency tables of FW-YEAR and TA-YEAR were much more significant(P<0.001).
Table 3:The values, probability and power values of Likelihood Ratio Chi-Square and Chi-Square Statistics in each contingency tables for
alpha=0.05.
L.R.Chi Square L.R.Chi Statistic Chi-Square Chi-Square Power of L.R.Chi Power of Pairs of traits Statistic Value Probability Statistic Value Statistic Probability Statistic Chi-Square
FW- YEAR 5.8511 0.1191 5.8312 0.1201 0.50688 0.50537 ---FW-CULT 116.8780 <.0001 86.2404 <.0001 1.00000 1.00000 ---SSDW-YEAR 32.0050 <.0001 29.9077 <.0001 0.99907 0.99829 ---SSDW-CULT 46.2319 <.0001 36.4196 <.0001 0.99971 0.99680 ---TA-YEAR 2.4163 0.4906 2.4000 0.4936 0.22610 0.22476 ---TA-CULT 102.5316 <.0001 74.6667 <.0001 1.00000 1.00000
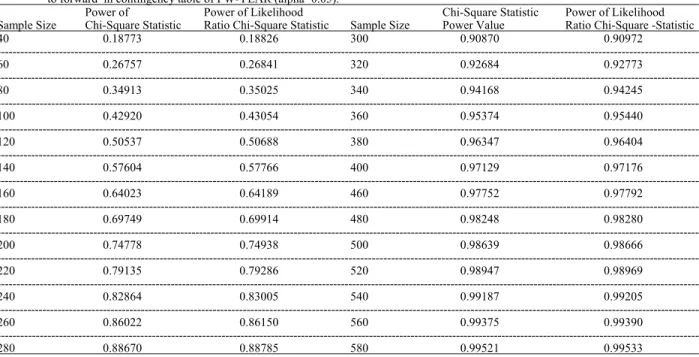
Table 4: The power values of Chi-Square and Likelihood Ratio Chi-Square Statistics obtained by artifically increasing sample size from backward
to forward in contingency table of FW-YEAR (alpha=0.05).
Power of Power of Likelihood Chi-Square Statistic Power of Likelihood
Sample Size Chi-Square Statistic Ratio Chi-Square Statistic Sample Size Power Value Ratio Chi-Square -Statistic
40 0.18773 0.18826 300 0.90870 0.90972 ---60 0.26757 0.26841 320 0.92684 0.92773 ---80 0.34913 0.35025 340 0.94168 0.94245 ---100 0.42920 0.43054 360 0.95374 0.95440 ---120 0.50537 0.50688 380 0.96347 0.96404 ---140 0.57604 0.57766 400 0.97129 0.97176 ---160 0.64023 0.64189 460 0.97752 0.97792 ---180 0.69749 0.69914 480 0.98248 0.98280 ---200 0.74778 0.74938 500 0.98639 0.98666 ---220 0.79135 0.79286 520 0.98947 0.98969 ---240 0.82864 0.83005 540 0.99187 0.99205 ---260 0.86022 0.86150 560 0.99375 0.99390 ---280 0.88670 0.88785 580 0.99521 0.99533
It could be concluded that
C There was close association or dependent between
FW and CULTIVAR (P<0.001).
C There was close association or dependent between
SSDW and YEAR (P<0.001).
C There was close association or dependent between
SSDW and CULTIVAR (P<0.001).
C There was close association or dependent between
TA and CULTIVAR(P<0.001).
According to results of four contingency mentioned above, power values of Likelihood Ratio Chi-Square and Chi-Square Statistics calculated for these four contingency tables were much higher and desired (almost 100%). In other words, both statistics for them had a reliability of more than 99 % and total sample sizes were quite sufficient (120).
However, the values, probability and power values calculated for contingency tables on FW-YEAR and
TA-YEAR were non-significant. It should be forgotten that non-significant results for both statistics does not guarantee independence. Consequently, examining in Table 3, the experiments (contingency tables on FW-YEAR and TA-YEAR) that one carried out is not sensitive enough to determine dependent. Because power values calculated for contingency tables on FW-YEAR and TA-YEAR were 50.537% for Chi-Square and 50.688% for other, as well as 22.476 for Chi-Square and 22.610 % for other, respectively. This case means non-reliable.
When we artificially and arbitrary increased 40 to 580 by 20 by using special SAS macro mentioned above in order to estimate sufficient sample size or to obtain at least a power of 80% for contingency table of FW-YEAR, sufficient sample size for the contingency table should be 240 (Table 4).
However, if sample size were 580, the power values of Chi-square and G statistics would be achieved to nearly 100% for both statistics.
J. Appl. Sci. Res., 2(11): 931-935, 2006
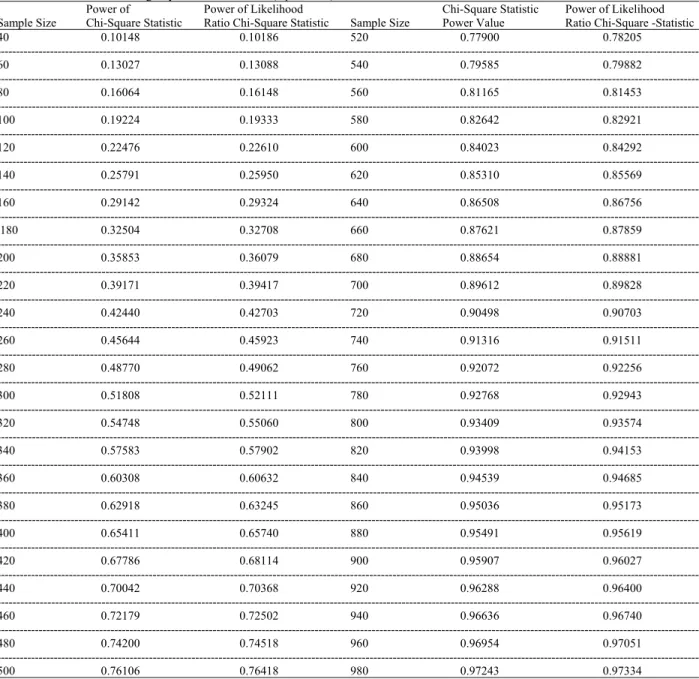
Table 5: The power values of Chi-Square and Likelihood Ratio Chi-Square Statistics obtained by artifically increasing sample size from backward
to forward in contingency table of TA-YEAR (alpha=0.05).
Power of Power of Likelihood Chi-Square Statistic Power of Likelihood
Sample Size Chi-Square Statistic Ratio Chi-Square Statistic Sample Size Power Value Ratio Chi-Square -Statistic
40 0.10148 0.10186 520 0.77900 0.78205 ---60 0.13027 0.13088 540 0.79585 0.79882 ---80 0.16064 0.16148 560 0.81165 0.81453 ---100 0.19224 0.19333 580 0.82642 0.82921 ---120 0.22476 0.22610 600 0.84023 0.84292 ---140 0.25791 0.25950 620 0.85310 0.85569 ---160 0.29142 0.29324 640 0.86508 0.86756 180 0.32504 0.32708 660 0.87621 0.87859 ---200 0.35853 0.36079 680 0.88654 0.88881 ---220 0.39171 0.39417 700 0.89612 0.89828 ---240 0.42440 0.42703 720 0.90498 0.90703 ---260 0.45644 0.45923 740 0.91316 0.91511 ---280 0.48770 0.49062 760 0.92072 0.92256 ---300 0.51808 0.52111 780 0.92768 0.92943 ---320 0.54748 0.55060 800 0.93409 0.93574 ---340 0.57583 0.57902 820 0.93998 0.94153 ---360 0.60308 0.60632 840 0.94539 0.94685 ---380 0.62918 0.63245 860 0.95036 0.95173 ---400 0.65411 0.65740 880 0.95491 0.95619 ---420 0.67786 0.68114 900 0.95907 0.96027 ---440 0.70042 0.70368 920 0.96288 0.96400 ---460 0.72179 0.72502 940 0.96636 0.96740 ---480 0.74200 0.74518 960 0.96954 0.97051 ---500 0.76106 0.76418 980 0.97243 0.97334
When we artificially and arbitrary increased 40 to 980 by 20 by means of special SAS macro mentioned above in order to obtain at least a power of 80% for contingency table of TA-YEAR, sufficient sample size for the contingency table should be 560.
However, if sample size were 980, the power values of Chi-square and G statistics would be achieved to approximately 98 % for both statistics.
CONCLUSION
In order to be obtained reliable results and determined enough sample size in Chi-Square
and Likelihood Ratio Chi-Square Statistics, power analysis should be performed. It could be concluded that:
C Performances of power analysis for both statistics
were close on each other in all contingency tables
C Except contingency tables regarding FW-YEAR and
TA-YEAR, both power values and total sample size of others were much more reliable.
Researchers should not forget that power analysis in Chi-Square and Litelihood ratio Chi-Square statistics technique means reliability.
935
REFERENCES
1. Agresti, A., 2002. Categorical Data Analysis. 2nd
Edn, Wiley, New York.
2. Atila, S.P., Y.S. Ağaoğlu and M. Çelik, 2006. A Research on the Adaptation of Some Raspberry Cultivars in Ayaş (Ankara) Conditions. Pakistan J. of Biological Sciences, 9: 1504-1508.
3. Everitt, B.S., 1992. The Analysis of Contingency
Tables. 2nd Edn, Chapman&Hall.London
4. Düzgüneş, O., T. Kesici and F. Gürbüz, 1983. Statistics Methods I. University of Ankara, Publishings of Agriculture Faculty. Ankara. 5. Eyduran, E., T. Özdemir, M.K. Kara, S. Keskin and
B. Çak, 2006. A Study on Power of Chi-square and G Statistics in Biology Sciences. Pakistan J. of Biological Sciences, 9: 1324-1327.
6. Eyduran, E. and T. Özdemir, 2005. Examining Chi-Square, Likelihood Ratio Chi-Square and Independent Ratios in 2x2 Tables: Power of Test. International Congress on Information Technology in Agriculture, Food and Environment-itafe’05. Proceedings. Adana-Turkey
7. Eyduran, E., T. Özdemir and M. Küçük, 2005. Chi-Square and G Test in Animal Science. The Journal of Faculty of Vet.Med. University of Yüzüncü Yıl, pp:1-3.Van-Turkey.
8. SAS, 1998. SAS Institute,Inc. Cary, NC, USA. 9. Sokal, R.R. and F.J. Rohlf, 1981. Biometry. The
Principles and Practice of Statistics in Biological Research. W.H. Freeman and Company. New York.