ÏÐÀÊÒÈ×ÅÑÊÈÉ ÀÍÀËÈÇ
Efficiency of the Banking Sector in the Russian Federation
with International Comparison
1)Caner S., Kontorovich V.
Banks, in most countries, play a crucial role in providing financial intermediation between savers and those who demand credit. Providing low cost funds is essential for investment and growth while providing savers with a good return on their investments. In order for bank in-termediation to be effective in economic growth, such inin-termediation should be done in an efficient manner. So, an efficient functioning banking system is essential for sustained growth. The efficiency of bank intermediation in the Russian Federation has not been addressed before. In this paper, we assess the level of efficiency of the Russian banking industry using bank specific data. We estimate the level of bank effi-ciency using a standard stochastic frontier model. We find the effieffi-ciency level of the Russian banks low compared to international evidence on other countries. Then, we estimate the contributions of different factors that influence the level of efficiency in the Russian banking system. The factors included in the estimations are bank specific factors summarized as CAMEL variables and macroeconomic risk factors such as interest rate and exchange rate risk. We find that equity to asset ratio, ratio of non-performing loans to total loans, interest rate volatility, inflation rate volatility and real effective exchange rate volatility significantly affect intermediation efficiency of banks in the Russian Federation.
1. Introduction
Banking sector inefficiency is often cited as one of the key determining fac-tors of financial crisis in emerging markets2). Financial crises in the South East
Asian countries, Czech Republic, the Russian Federation, Turkey and recently,
1) We would like to thank for comments provided by the participants in the banking se
c-tion at the HSE Conference, April 6-8, 2004, Moscow. All views expressed are the authors and do not necessarily represent the views of the Central Bank of Russia.
2) For example, see [2].
Caner S. – Bilkent University, Ankara, Turkey. Advisor to the Deposit Insurance Agency of
the Russian Federation. E-mail:[email protected]
Kontorovich V. – Central Bank of Russia, Advisor to the Chairman.
gentina are marked with the failure of the banking sector as the key financial in-termediation institution. Efficient functioning of financial inin-termediation by the banking sector is essential in economies where equity markets are not well develo-ped. The banking sector in this case has a very important role in providing funds for investment and trade to keep the cost of capital low. Efficient allocation of available funds by the banking sector to be used by the real economy at low cost thus has a stimulating effect on sustained economic growth.
So a comprehensive estimate of the banking sectors’ efficiency would provide an indication about the extent of problems faced in financial intermediation in the banking industry. Such analysis would further provide support for policy to im-prove the efficiency of the banking industry. Furthermore, estimation of the effi-ciency of the banks has implications for the development of a deposit insurance sys-tem for the Russian banking sector. This study would provide guidance on the types of banks to be included in a deposit insurance system.
To better understand the efficiency of the banks in the Russian Federation we provide an international comparison. Various estimates from different countries are compared to the estimates for the Russian banking industry. When compared to other countries, Russian banks score very low compared to other countries in Eastern Europe and South East Asia3). The average efficiency of the Russian banks in pro-viding credit to the economy is estimated to be around 40%. This puts the Russian banks in par with the Slovakian banks.
In this study, we estimate the efficiency in the Russian Banking sector using a stochastic production frontier approach. Then, we estimate the factors that de-termine the changes in banking efficiency. In addition we also, estimate the market power of banks by analyzing interest rate spreads and it dynamics over time. Fi-nally, we draw some policy conclusions for a more efficient banking system.
Using bank financial statement data our efficiency estimations show that Rus-sian banks are inefficient compared to international estimates. The efficiency of ob-taining deposits is around 30% while lending efficiency is about 40%. When com-pared with estimates for other countries where the efficiency score range from 45% (Slovakia) to 90% (U.S. and U.K.), there is significant room for improvement in the Russian banking industry.
Banks were and still remain the main financial intermediaries providing funds to the private sector as well as the government. So efficient functioning of the banking system can provide significant contributions to lowering the cost of capital. Even though inflation rates have come down significantly since 1999, real cost of capital still remains high (see for example, lending rates by the banks to corporate clients) due to high risk premiums. So we first evaluate the efficiency of the banks in the Russian Federation. Then, we estimate the effects of the determinants of ef-ficiency in the banking sector. We classify the determinants of bank efef-ficiency in three groups. The first group consists of internal factors that are fundamental to the functioning of a bank. These are summarily, referred to as the CAMEL variables4).
3) Kwan finds significant differences across South Asian countries before the 1997 crisis [13]. 4) CAMEL variables refer to capital adequacy, asset quality, management efficiency, ear-nings performance and liquidity as recommended by the Bank of International Settl ements (BIS).
The second group of factors consists of risks attributable to the financial system. These are interest risk, exchange rate risk and inflation risk. The third group of factors influencing the efficiency of the banks includes variables attributable to the monetary policy of the central bank. In this manner we can quantify the effects of important factors that contribute to the cost of financial intermediation in the Rus-sian banking sector. Furthermore, such an approach in determining the factors af-fecting the efficiency of financial intermediation by banks would allow for the in-troduction of policy measures to improve the functioning of the banking system.
2. Financial Intermediation
Banks play a crucial role as financial intermediaries. Effective financial
inter-mediation allocates savings best among competing firms for funds. Competitive
fi-nancial intermediation not only benefits savers but also allows the capital to flow to uses that provide the maximum value. Savings and investments are connected through security market intermediation, finance corporations, institutional investors such as insurance companies, pension funds and mutual funds, as well as bank
in-termediation.
Securities market intermediation, at its best form, is more efficient than bank intermediation since there is no permanent middleman between the owners and the users of funds. However, banks dominate financial intermediation in all emerging financial markets including the Russian Federation.
Conditions for cost efficient financial intermediation are not easily developed. Development of an environment of efficient financial intermediation is significantly related to the establishment of institutions that produce externalities in the process of financial intermediation. Institutional foundations, most significantly the laws that facilitate financial intermediation are essential for a well functioning financial sys-tem. In securities intermediation, execution of contractual claims, that is, trade de-pends on the uniformly and fairly implementation of laws on the protection of property rights and the interest of the investors. Otherwise, securities markets pro-vide big opportunities for fraud. In addition, financial information about clients is essential. Disclosure rules are needed that induce firms to establish market credibi-lity. The extent of these requirements often limits the development of equity mar-kets as an alternative to the banking system for financial intermediation.
3. Financial Development and Economic Growth
Government’s demands on the financial sector in terms of higher reserve ra-tios, interest rate ceilings resulting in negative real interest rates, limiting private borrowing results in financial repression. There is significant correlation between economic growth and financial market development measured in terms of an index of several factors such as the reserve ratio, real interest rates, liquidity (M2/GDP), private borrowing (claims on private sector/total domestic credit), bank lending (deposit bank assets/deposit bank assets plus central bank assets) and market value (aggregate stock market capitalization/GDP) [2].
The linkage between economic growth and financial development is not obvious since there is a range of other exogenous factors that contribute to economic
growth. Second, appropriate measures of financial development are not well defined and not easily available. McKinnon [16] argued the necessity of the financial system for economic growth where interest rates and low reserve ratios play a crucial role in stimulating economic development. King and Levine [12] empirically tested the effect of financial development as an exogenous factor separately from endogenous determinants on economic growth. Levine [15] further estimated the effects of fi-nancial institutions in addition to the expected fifi-nancial development using exoge-nous legal and institutional characteristics. Cross-country differences in institutional development are significant determinants of differences in economic growth5).
4. Efficiency of Financial Markets
Efficiency in general is defined as the best allocation of resources to obtain a given level of output. There are two main approaches to efficiency in the financial markets. First one is technical (operational) efficiency that measures the cost effi-ciency of financial intermediation. Second, allocational effieffi-ciency measures the extent in which the input choices fail to equate marginal products with input price ratios.
Efficiency of financial markets in terms of both concepts can be viewed as: a. Technical efficiency – under which those supplying and demanding funds are able to transact to produce the best output given input choices.
b. Allocational efficiency – the extent to which marginal products of inputs are equated to input prices ratios.
While it would be helpful to analyze both the operational and the allocational efficiency of the banking sector in the Russian Federation, we primarily focus on technical efficiency due to insufficient number of publicly traded banks. Further-more, we evaluate the evolution of efficiency over time in the Russian banking in-dustry. Such an analysis would provide a review of the effectiveness of policy measures taken by the Central Bank of the Russian Federation.
The two measures of efficiency are related. Those banks with the most effi-cient production structures would also have presumably allocational efficiency.
In the case of technical efficiency, one major input cost is the cost of financial intermediation. Cost of intermediation can be represented as interest rate margins calculated as the differences in cost of raising funds (primarily interest expenses of the bank) and the price of credit (interest income from loans). Net interest rate margin can be expressed as the ratio of interest income minus interest expenses to the income producing assets. Alternatively, one can use the interest rate spreads, i.e., the difference of average interest rate on deposits and the interest rate on loans by each bank by term of the loan and deposits and, unit of account. In this ap-proach one has to consider the interest rates on loans and deposits under domestic currency as well as foreign currencies. Both approaches may have different implic a-tions [6]. Since low cost of intermediation implies efficiency, one can conclude that the lower the differential between the cost of lending and cost of borrowing, the more efficient is the banking system.
5) One can find further evidence of the relationship between economic growth and
institu-tional development by comparing the Ming dynasty period (late 1360 –1644) in China with the development of Europe.
It is also possible to measure the effectiveness of bank regulation over time by estimating the effect of policy changes on the intermediation cost differentials. While this would provide an aggregate estimate on the efficiency of the banking system, it cannot provide insight into the efficiency of individual banks. While the interest rate differential may be lower, costs incurred by individual banks may vary significantly. Banks forced by the market conditions, may offer lower interest rates but the cost of funding their lending activities may still remain high due to other cost components such as debt payments, property and labor costs. So, in a competi-tive financial system, while the overall banking system may offer low intermedia-tion costs, individual banks in the system may face different budget constraints. In this case some banks’ ability to make profits can be limited by because of other components of their cost structure. Therefore, other approaches to evaluating ag-gregate efficiency of the banking industry would complement the agag-gregate cost efficiency estimated using interest cost differentials.
There are two commonly used methods for estimating efficiencies. One is the non-parametric method of Data Envelope Analysis (DEA) where a frontier is estab-lished based on best firms in the sample. No output maximization behavior is as-sumed. One can estimate operational efficiency by comparing the banks’ costs of operations to an optimally constructed hybrid bank that is formed as a combination of best components of each bank. Thus, the efficiency of banks under this alterna-tive can be measured using the DEA. However, DEA measures efficiency relaalterna-tive to the best bank among the sampled banks. So, accordingly, a high efficiency estimate for a bank may not necessarily mean the bank is efficient if the reference bank is nor efficient6).
Alternatively, efficiency can be measures using the parametric method call the stochastic frontier method. We use the «stochastic production frontier» method in estimating the efficiency of the banking system in the Russian Federation7).
Among other factors for preference over the DEA method, stochastic frontier method allows for statistical noise in which case using DEA would result in higher inefficiencies. Furthermore, the DEA results are not robust and vary depending on the sample size.
Stochastic frontier methodology allows us to estimate a production frontier that offers the optimal mix of inputs that maximizes output. Then, we can measure the efficiency of each and every one of the banks relative to the efficient produc-tion frontier. The estimated level of efficiency would be between zero and 100%. Any bank on the frontier would get an efficiency score of 100%. Banks lying below the production frontier would get an efficiency score of less than 100%.
To demonstrate for two inputs and one output, the production frontier takes the form represented in Fig. 1.
In the above graph, point A would be the most efficient since it lies on the frontier. Point B would be less efficient because it is below the frontier. Any point above the curve is impossible.
6) See [3, 4, 5] for efficiency estimation of banks using the DEA method. Mester [17] uses a
similar approach accounting for risk differentials. Resti [18] estimates efficiency of Italian banks using a mix of DEA and stochastic models.
A B 1 x /y x 2/y Fig. 1.
5. Efficiency of the Russian Banking System vs. International Performance
There exist a number of studies assessing the efficiency of the banking sector using one of the methodologies described above. For example, Laevan [14] uses DEA to estimate the efficiency of banks in selected South East Asian countries8). He con-cludes that ownership structure and excessive risk taking were major factors in de-termining inefficiencies in these countries. He reports bank efficiencies ranging from 61% for Indonesia to 89% for Korea. Weill [21] using the stochastic frontier approach estimates efficiency scores to compare efficiency gaps between Western European banks and Eastern European banks. Efficiency estimates for Eastern European banks range from 45% for Slovakia to 73% for the Czech Republic. In Western European countries, bank efficiency score range from 61.5% for Portugal to 75.6% for England9) However, he does not find any significant macroeconomic or bank specific factors that explain the difference in efficiency levels in Western and Eastern European countries. Corporate governance has a marginal effect on improving the efficiency levels of banks.
Casu and Molyneux [8], using DEA, estimates and compares efficiency levels for the European Union (EU) banks. In that study, efficiency levels range from 57% to 65%. They conclude that harmonized legislation resulted with very little conver-gence in bank efficiency in the EU countries. Country factors remain as the main
8) The countries included in the study are Indonesia, Kor ea, Malaysia, Thailand,
Philip-pines.
9) The reported median efficiency score for Eastern European countries is 54% while it is
determinants of efficiency of the banking systems. Caner and Ungan [7] estimate efficiency levels for the Turkish banking sector and find that after the financial cri-ses of 1994 and 2000, bank efficiency improved significantly as a result of pruden-tial measures as well as the deposit insurance fund assuming control of the poorly performing banks10).
As it can be observed in Table 1, some South East Asian and Eastern Euro-pean countries score very poorly in terms of efficiency. In South East Asia coun-tries, ownership structure and excessive risk taking in banking are often cited as main causes of inefficiency. On the other hand, poor corporate governance is the main reason for low efficiency in Eastern European countries.
Table 1. Comparison of Efficiency Estimates-Selected Countries
Country Efficiency Estimate, %
U.S. 85–90 E.U. 75 England 90 Spain 70 Portugal 65 Greece 65 Eastern Europe 45–73 Hungary 70 Czech Republic 73 Slovakia 45 Turkey 60 Russian Federation 41
South East Asia 70
Korea 89
Indonesia 61
6. Structure of the Russian Banking Industry
We used a sample of the Russian Banking Industry to estimate the efficiency levels and sources of all banks. Table 2 includes the distributions of the banks over time.
For estimating the efficiency of deposit collecting banks in the Russian Fed-eration, we excluded non-active banks, banks without a license to collect deposits, banks without adequate data in their financial statements and Vneshekonom Bank.
10) The level of efficiency was estimated to be 60% after the ownership of 24 b anks is
as-sumed by the deposit insurance fund. The operation resulted with the removal of about $20 billion dollars worth bad loans from the portfolios of poorly performing banks.
Table 2. Structure of Credit Institutions
1999 2000 2001 2002 2003
Credit Institutions registered
with the Bank of Russia 2387 2124 2001 1874 1762
Banks 2342 2084 1953 1823 1709
Non-bank credit institutions 34 40 48 51 53
Credit Institutions with Banking
License 1349 1311 1319 1332 1332
Banks 1315 1274 1276 1284 1281
Non-bank credit institutions 34 37 43 48 51
Banks included in the sample 1160 1175 1192 1194 1199
Source: Bulletin of Banking Statistics, Central Bank of Russian Federation.
Table 3. Balance sheet Items of Banks
1999 2000 2001 2002 2003 All Banks Assets 1,473,278 2,260,936 3,047,256 3,915,564 4,868,226 Deposits 461,630 695,811 971,571 1,362,326 1,576,532 Loans 596,812 956,293 1,467,489 2,028.913 2,355,228 Sample Banks Deposits 293,288 396,489 937,912 1,322,197 1,434,501 Loans (excluding credits on demand) 1,318,456 2,266,804 3,304,575 3,710,166 3,588,676
Source: Bulletin of Banking Statistics and authors’ calculations Central Bank of Russian Federation.
Table 3 includes selected aggregate balance sheet items of all the banks and the banks included in the study sample.
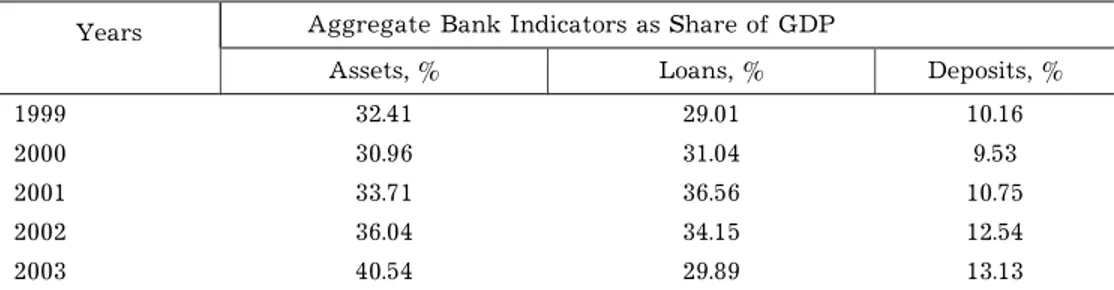
Table 4. Size of the Russian Banking Industry
Years Aggregate Bank Indicators as Share of GDP
Assets, % Loans, % Deposits, %
1999 32.41 29.01 10.16
2000 30.96 31.04 9.53
2001 33.71 36.56 10.75
2002 36.04 34.15 12.54
2003 40.54 29.89 13.13
7. Determinants of Cost of Financial Intermediation
In addition to measuring the operational efficiency of the banking sector, cost of intermediation can be used as a proxy for measuring efficiency. Cost of Financial Intermediation (CFI) expressed as interest rate margins and spreads are determined by the bank characteristics, aggregate risk premium, industry structure and the monetary policy.
So, the lower the cost of intermediation, the more efficient is the banking sys-tem. According to this approach, the banks operations can be seen as a monopolistic production. Intermediation margins increase when banks have higher market power. Using the interest rate margins it would be possible to estimate the time varying efficiency of cost of intermediation.
8. Cost of Financial Intermediation11)
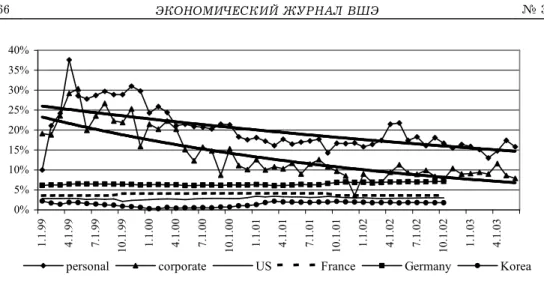
The cost of financial intermediation described as the difference between the interest rate paid by the borrowers and the interest rate paid by the banks on the deposits is often considered as a measure of aggregate market efficiency. The smaller is the spread, the more efficient is the banking system since, the benefit of lower cost of financial intermediation is reflected in lower cost of capital in the economy12) Fig. 2 and 3 demonstrate the trends in ruble and dollar denominated spreads in the banking sector in the Russian Federation for the January 1999 – June 2003 period.
As it can be seen in Fig. 2, spread between ruble loans and deposits has de-clined both for individuals as well as the corporations over the 1999–2003 period. So, there is a significant improvement in financial intermediation as evidenced by the decline in the average spread. This implies an improvement in the aggregate efficiency of the banking sector. However, the spread still remains high particularly for individuals implying a discriminatory practice favoring of corporate clients.
In Fig. 2, we included spreads from selected countries to compare the spreads that exist in the Russian banking sector with international practice. The interest rate spreads in the Russian banking sector are well above the spreads experienced in many other countries. Until the end of 2001, the interest rate spreads were sig-nificantly higher than all the countries compared in Fig. 2. The gap between the sample countries and the Russian Federation has narrowed after 2001 where interest rate spreads in the Russian banking sector approached to the spreads observed in Germany. However, the difference in interest rate spreads is still high compared to other countries13).
11) Estimations with aggregated data were made by S. Caner, estimations with bank
spe-cific data were made by V. Kontorovich.
12) Spread is calculated as the difference in interest rates on loans and deposits with
ave-rage maturity as: Spread = Interest rate on loans (aveave-rage maturity) – Interest rate on deposits (average maturity).
13) Demirguc and Huizinga [11] provide estimates of international spreads and their d
0% 5% 10% 15% 20% 25% 30% 35% 40% 1. 1. 99 4. 1. 99 7. 1. 99 10 .1 .9 9 1. 1. 00 4. 1. 00 7. 1. 00 10 .1 .0 0 1. 1. 01 4. 1. 01 7. 1. 01 10 .1 .0 1 1. 1. 02 4. 1. 02 7. 1. 02 10 .1 .0 2 1. 1. 03 4. 1. 03
personal corporate US France Germany Korea
Fig. 2. Spread on Ruble Deposits and Loans
Source: Bulletin of Banking Statistics, Bank of Russia and IMF, International Financial Statistics.
0% 2% 4% 6% 8% 10% 12% 14% 16% 18% 1. 1. 99 4. 1. 99 7. 1. 99 10 .1 .9 9 1. 1. 00 4. 1. 00 7. 1. 00 10 .1 .0 0 1. 1. 01 4. 1. 01 7. 1. 01 10 .1 .0 1 1. 1. 02 4. 1. 02 7. 1. 02 10 .1 .0 2 1. 1. 03 4. 1. 03 personal $ corporate $
Fig. 3. Spread on Dollar Deposits and Loans
Source: Bulletin of Banking Statistics, Central Bank of Russian Federation.
It is difficult to explain such a large difference in interest rate spreads in terms of a risk premium. If the risk premium were high on any loan, this would also be reflected as an additional risk premium in the required rate of return of the depositors. So, the high interest rate spreads in the Russian banking sector can be attributed to either the structure of the sector or the operational inefficiencies of the banks.
An analysis of the structure of the banking sector is beyond the scope of this study therefore, we focus on the estimation of the inefficiencies that may exist in
the banking sector. Furthermore, the banking sector in the Russian Federation is characterized by a large savings bank, Sberbank, with about two-thirds of the de-posits and many large and small private banks. However, since Sberbank is largely owned by the state, extracting monopoly profits from the financial markets cannot be the motivation of a state-owned bank. Consequently, operational inefficiencies that exist in the banking system (including Sberbank) are the mostly like sources of large interest rate spreads that are observed in the Russian banking system.
9. Efficiency Estimates of the Russian Banking Industry
We use two approaches to evaluate the operations of banks. In the first, case banks are viewed as entities providing a service for the savings of economic agents. So, with a given level of capital and labor banks produce deposits. In the second ap-proach, banks are viewed as financial intermediaries where the deposits are also considered as inputs in addition to labor and capital to produce loans. Using the sto-chastic frontier method we first estimated the efficiency of raising funds in terms of deposits for the banking industry. Second, we estimated the efficiency of banks in providing credit to the market. This method of estimating efficiency considers banks as providers of financial intermediation services.
In the sample, we excluded non-bank credit institutions as well as those banks that did not report any capital, labor expense, total deposits or total loans. Then we estimated the efficiency of each bank relative to a production frontier for the years 1999–200314).
As it can be seen in Table 5 the efficiency scores of collecting deposits is sig-nificantly lower than the lending efficiency of banks. This implies that banks ex-cluding Sberbank have difficulty in obtaining deposits. It is quite possible that banks cannot collect deposits faced with competition from Sberbank.
High inefficiency in collecting deposits forces the banks to commit higher lev-els of capital than needed to provide funds to the creditors. When compared with other countries, the results are just the opposite. For example, in Turkey the deposit efficiency is significantly higher than efficiency in lending.
Table 5. Estimated Efficiency Scores by Years
Years Deposit Efficiency Score, % Lending Efficiency Score, %
1999 33.91 38.37 2000 28.06 31.47 2001 29.49 40.25 2002 30.67 39.38 2003 30.68 41.06
14) Any bank that is located on the frontier would score 100% efficiency. An efficiency
score of less then 100% indicates the level of efficiency of the bank relative to the most effi-cient way of obtaining deposits represented by the frontier.
9.1. Efficiency of Banks in Obtaining Funds
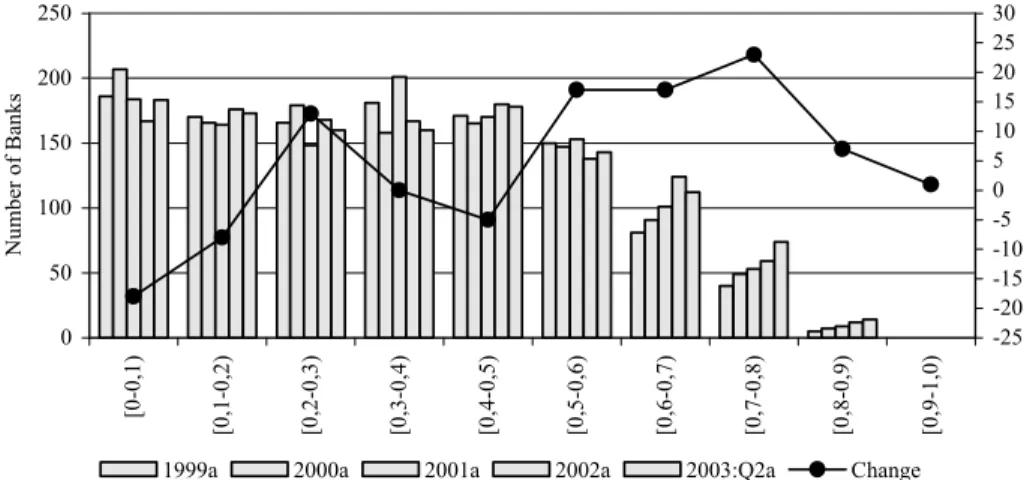
We first estimate the efficiency of the Russian banks in collecting deposits. As financial intermediaries banks are expected to collect deposits at minimum cost in order to provide low cost credits to the rest of the economy. The estimated efficien-cies for all banks for the period 1999–2003 Q2 are summarized in Fig. 4. To obtain bank efficiency estimates we used average deposits and capital levels for each of the years. While end of the-year deposits are more appropriate as the output of the bank to be maximized, due to high fluctuations in banks’ deposits within the year we chose the yearly average deposits as the output to be maximized for measuring efficiencies15). 0 50 100 150 200 250 [0 -0 ,1 ) [0 ,1 -0 ,2 ) [0 ,2 -0 ,3 ) [0 ,3 -0 ,4 ) [0 ,4 -0 ,5 ) [0 ,5 -0 ,6 ) [0 ,6 -0 ,7 ) [0 ,7 -0 ,8 ) [0 ,8 -0 ,9 ) [0 ,9 -1 ,0 ) N um be r of B an ks -25 -20 -15 -10 -5 0 5 10 15 20 25 30
1999a 2000a 2001a 2002a 2003:Q2a Change
Fig. 4. Distribution of Banks According to Deposit Efficiency Class
The estimates indicate that the level of overall efficiency (unweighted avera-ge) in the Russian banking sector remains very low at 31% in 2003. The number of banks below 50% efficiency rate was 76% of all banks. Their share declined to 71.35% by 2003 Q2. This implies a reduction in the share of banks in the lower effi-ciency classes at an annual rate of 1.26%. This points to the difficulty banks face in obtaining deposits possibly faced with competition from the informal credit markets where lending and borrowing takes place without formal intermediaries attracting individuals and small businesses that do not qualify for bank credits16).
15) When we used end-of-the-year deposits, the average efficiency of the banking sector
was slightly less than the estimates obtained by using average deposits. This is probably due to the operations of some banks that were not working as proper financial intermed iaries. Some banks included in the sample reported some deposits at the beginning of the year but had very little or no deposits at the end of the year. So, using end -of-the-year deposits would have biased the efficiency estimates.
16) Recent household expenditure surveys indicate an increase in lending by hous ehold in
real terms. The likely customers of such unsecured loans individuals and small bus inesses. See RLMS Survey, 2002.
However, the estimates also reveal a significant change in the efficiency of the banking sector since 1999. The average level of efficiency increased from 30.56% in 1999 to 34.01% in 2003. This implies a 13% increase in bank efficiency in the last four years. There has been a significant decline in the number of banks in the lowest two efficiency classes. The number of banks declined by 26 in these two classes that constitute the largest group of banks. Furthermore, the number of banks in the top three efficiency classes increased by 31.
The improvement in the distribution of bank efficiency can also be observed in the change in the level of skewness from 41.08% in 1999 to 24.81% in 2003 Q2. Thus, there has been a shift from the lowest efficiency classes to higher efficiency classes.
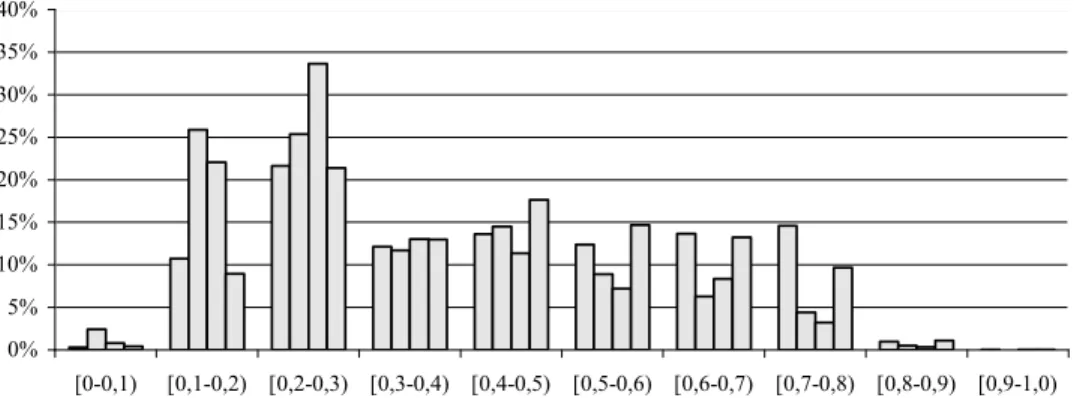
Fig. 5 shows the distribution of deposits, capital, total costs and interest expen-ses according to the size of efficiency for 2003 Q2 excluding Sberbank17) According
to our estimates 58.4% of all deposits are in banks that are less than 50% efficient. These banks incurred 81% of all the costs of collecting deposits in the banking sector. Furthermore, banks with efficiency score of less than 50% accounted for 80% of all the capital. This implies a very inefficient use of financial resources. The most efficient 90 banks (7.4% of all banks) account for about 5% of the total capital in the banking industry. Also, they only incurred 3% of the total costs of the banking in-dustry while collecting 15% of total deposits.
0% 5% 10% 15% 20% 25% 30% 35% 40% [0-0,1) [0,1-0,2) [0,2-0,3) [0,3-0,4) [0,4-0,5) [0,5-0,6) [0,6-0,7) [0,7-0,8) [0,8-0,9) [0,9-1,0) Deposits Capital Total Costs of obtaining funds Total Interest Expense
Fig. 5. Distribution of Deposits, Capital, Total Costs and Total Interest Expenses, 2003 Q2
(Excluding Sberbank)
Note: The distribution excludes Sberbank.
9.2. Efficiency of Banks as Providers of Loans
Banks as financial intermediaries are expected to provide credits to the econo-my in an efficient manner. To measure how efficient the banks are as financial
17) Since Sberbank is a state bank with a very large share of deposits, we wanted to d
e-termine the distribution of capital and deposits in the rest of the banking sector. I ncluding Sberbank would introduce a significant bias in one of the efficiency classes.
termediaries, we estimated the efficiency scores of all the banks in the sample where the output is the amount of loans provided to the economy. Furthermore, we included deposits as input to the lending process of the banks in the estimations. This approach represents the financial intermediation process of the baking industry where deposits collected by the banks are distributed as loans. The distribution of estimated efficiencies of providing credit to the economy according to efficiency class are included in Fig. 6. In year 2000, 77.8% of all the banks were less than 50% efficient. In year 2003 Q2 the number of banks below the 50% efficient rate de-clined to 70%. This implies a decline in the share of banks in the lower efficiency classes at an annualized rate of 2.7%. Accordingly, between 1999 and 2003 Q2 the number of banks below the 50% efficiency class declined by 30 while the number of banks above the same class increased by 95. Banks benefit from faster economic growth in terms of selling loans without incurring significant costs.
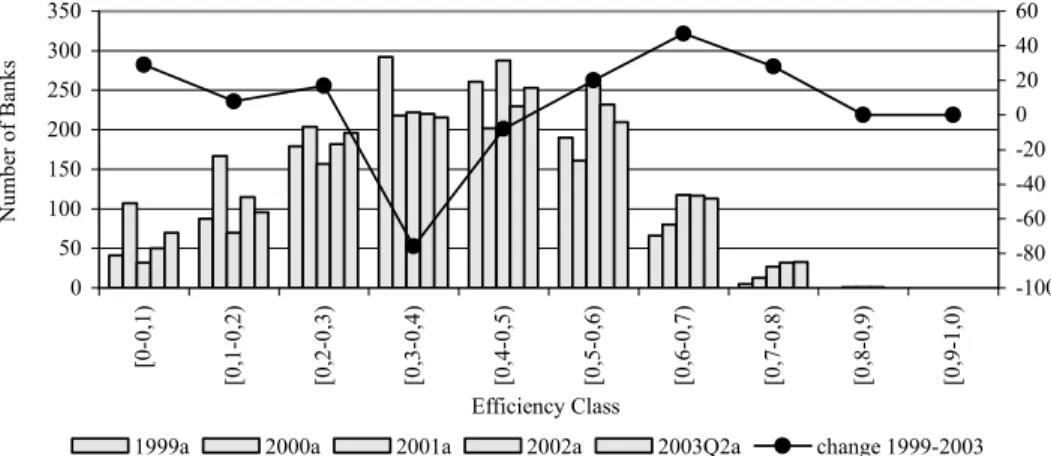
The efficiency level of the banking sector has increased by 2.7 percentage points or 7 percent between 1999 and 2003 Q2. This is a slower improvement com-pared with the efficiency improvements of the banking sector in terms of collecting deposits. However, banks were more efficient in terms of selling credit than collect-ing deposits durcollect-ing 1999–2003 Q2. Particularly, in year 2001, with increased de-mand for credit, banks were able to sell more credits to the rest of the economy without significantly increasing their costs18). Consequently, the average efficiency
rate increased to 42% from a low level of 34% in 2000. The efficiency of banks in selling loans remained at 41% in 2003 Q2 after a slight decline from 42% in 2001.
0 50 100 150 200 250 300 350 [0 -0 ,1 ) [0 ,1 -0 ,2 ) [0 ,2 -0 ,3 ) [0 ,3 -0 ,4 ) [0 ,4 -0 ,5 ) [0 ,5 -0 ,6 ) [0 ,6 -0 ,7 ) [0 ,7 -0 ,8 ) [0 ,8 -0 ,9 ) [0 ,9 -1 ,0 ) Efficiency Class N um be r of B an ks -100 -80 -60 -40 -20 0 20 40 60
1999a 2000a 2001a 2002a 2003Q2a change 1999-2003
Fig. 6. Distribution of Banks According to Credit Efficiency Class
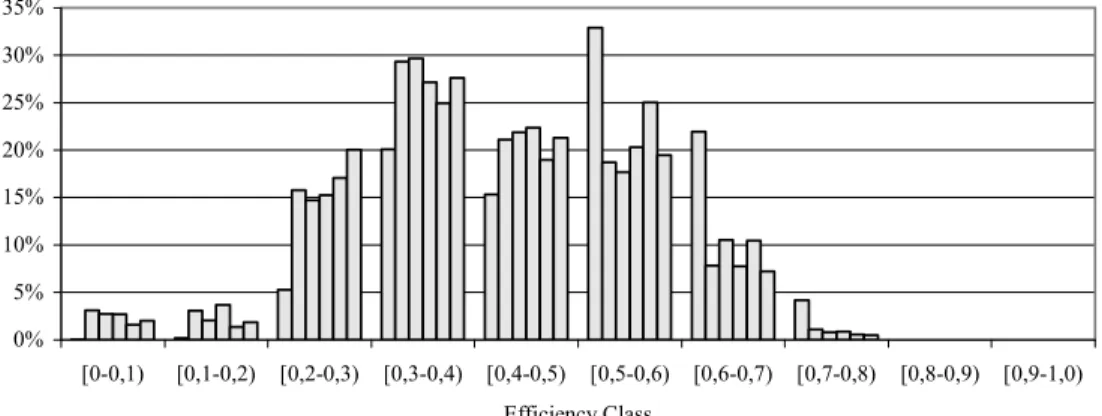
We observe the efficiency of banks in financial intermediation by comparing the share of credits and deposits by efficiency class in 2003 Q2 as displayed in Fig. 7. Banks with an efficiency score of less than 50% have 64% of all the deposits. Howe-ver, they account for only 41% of all credits. Furthermore, while selling just 41% of
18) In 2001, the Russian Federation experienced its highest real GDP growth rate. GDP
all credits, these banks incurred 73% of total interest expenses. So this implies a high expense rate per unit of credit sold by the banks that are below the 50% effi-ciency rate. So, this implies a very high interest expense incurred per unit of credit sold by banks that are below the 50% efficiency rate. The choice of 50% efficiency is for demonstration purposes and it should not be considered as a threshold for effi-ciency. In most European Union countries as well as the U.S., the average efficiency rates would be well over 75%. Low efficiency estimates indicate how expensive it is in the Russian Federation to intermediate a loan, particularly for banks in the lower efficiency classes where the majority of banks are clustered.
0% 5% 10% 15% 20% 25% 30% 35% [0-0,1) [0,1-0,2) [0,2-0,3) [0,3-0,4) [0,4-0,5) [0,5-0,6) [0,6-0,7) [0,7-0,8) [0,8-0,9) [0,9-1,0) Efficiency Class
Credits Capital Labor Property Costs Deposits Interest Expense
Fig. 7. Distribution of Credits, Capital, Labor Expense, Property Costs, Deposits
and Interest Expenses 2003 Q2 (Excluding Sberbank)
10. Estimates of the Determinants of Efficiency
Using the results of the previous section we estimate the contributions of fac-tors that determine the efficiency in the banking sector. Due to availability of data we were able to use only three out of the five CAMEL variables. We used the capi-tal adequacy ratio, asset quality and the earning performance as the internal factors that determine bank efficiency. In addition to selected CAMEL variables, we include interest rate risk (INTSTD), exchange rate risk (FXSTD), inflation risk (CPISTD) and the real exchange rate (RER) as determinant factors of efficiency. Risk factors are defined as standard deviation of the variables.
We first pool the data then use OLS to estimate the contribution of factor to the bank efficiency. Table 6 tabulates the regression results. In the estimations, effi-ciency score calculated for each bank using the stochastic frontier is regressed on capital adequacy ratio, EQASSR, implicit return on assets, GMAR, ratio of non-performing loans, NPLLOAN as the fundamental variables. In addition, interest rate risk, exchange rate risk, inflation rate risk and the real exchange rate are included as explanatory variables in the regression. Real exchange rate is included in the model to measures the effect of exchange rate policy on the performance of banks.
As it can be seen from regression results in Table 6, the model is robust and the estimated coefficients are significant with the exception of implicit return on assets and the exchange rate risk. Capital adequacy ratio, though significant, has a negative sign although it was expected to be positive. However, the negative sign is consistent with the structure of the Russian banking industry. Russian banks fi-nance loans with equity capital that is more expensive than deposits and borrowings from other banks. Such high cost of financing is reflected in the inefficiency of the banks. This result implies that Russian banks do not use equity capital efficiently. While the Basel regulations require an 8% capital adequacy ratio, the average capi-tal adequacy ratio is about 25% for the Russian banks.
Implicit return on assets has the right sign but it is not significant. This im-plies that profitability is not significantly related to efficiency. A better measure would have been return on equity. Non-performing loans have the expected sign and significant. As the estimated coefficient shows, non-performing loans signifi-cantly and negatively affect efficiency of banks.
External risk factors, interest rate risk, inflation risk and the real exchange rate are significant and have the expected sign. The estimated exchange rate risk coefficient is not significant implying proper exchange rate risk hedging by the Russian banks.
However, the bank efficiency is very sensitive to real exchange rates. An in-crease in the real exchange rate, that is, an appreciation of the ruble reduces the efficiency of the banks. During the estimation period we observe continued appre-ciation of the ruble against major currencies as reflected in the real exchange rates. During this period the banks reduced their foreign exposures limiting their profit-ability. In addition, the decline in spreads made banks to be less willing to lend money. As a result we see a negative relationship between bank efficiency and real exchange rates.
Table 6. Regression Results: Factors of Determination of Bank Efficiency
Explanatory Variables Estimated Coefficients
Constant (2.793) 2.498
Equity to Asset Ratio (-18.33) -0.229
Implicit Rate of Return on Assets (1.194) 0.014
Ratio of NPLs to Loans (-20.61) -0.337
Inflation Volatility (3.118) 0.179
Exchange Rate Volatility (0.838) 0.036
Continued Explanatory Variables Estimated Coefficients
Real Effective Exchange Rate (2.397) -3.119
R–Squared 0.133
DW Statistic 1.786
F-Statistic 133.695
The table reports regression results of estimating coefficients of factors determining the bank efficiency. The coefficients of explanatory variables are included in the tables with their t-statistics in parenthesis. R square, DW statistic and F-statistic are also provided in the table. High F-statistic value indicates ro-bustness of the model.
The above results should be considered preliminary because inclusion of addi-tional CAMEL variables such as liquidity and profitability as well as other funda-mental variables from the financial statements of the banks would improve our un-derstanding of the determinants of bank efficiency. The model can be further ex-panded to include additional variables including monetary policy variables and the behavior the depositors and creditors.
11. Conclusion
Estimates for the years 1999–2003 show that Russian banks have very low ef-ficiency scores compared to the banks in selected developed and developing markets. The efficiency level remains low even though there is gradual improvement since 1999. Average efficiency in lending remains at about 40% while efficiency of obtaining deposits is in the low thirties. These results call for a major restructuring/consoli-dation in the banking industry.
The Russian banking industry is characterized by low efficiency in providing credit and obtaining funds for credits. Due to low levels of deposits compared to international averages, banks commit a high amount of capital to fund credit de-mand. This inevitably increases the cost of raising funds in the banking industry.
Russian banking industry does not seem to take advantage of scale economies to reduce costs. The results imply a significant consolidation in the Russian banking industry. Furthermore, the results provide guidance on the framework of the depo-sit insurance. The newly established depodepo-sit insurance system should develop capa-bility to evaluate banks for inclusion in the insurance system based on their effi-ciency scores. This would avoid the free-rider problem that may arise in the future.
*
*
*
R E F E R E N C E S
1. Battese G.E., Coelli T.J. Frontier Production Functions, Technical Efficiency and Panel Data: With Application to Paddy Farmers in India // Journal Productivity Analysis. 1992. ¹ 3. P. 153–169.
2. Beim D., Calomiris C. Emerging Financial Markets. N. Y.: McGraw Hill, Irwin, 2001.
3. Berger A.N., Humphrey D.B. The Efficiency of Financial Institutions: I nternational Survey and Directions for Future Research // European Journal of Operations Reseach. 1997a. ¹ 98. P. 175–212.
4. Berger A.N., Mester L.J. Inside the Black Box: What Explains Differences in the Effi-ciencies of Financial Institutions // Journal of Banking and Finance. 1997a. ¹ 21. P. 895–947.
5. Berger A.N., Hunter W.C., Timme S.G. The Efficiency of Financial Institutions: A Re-view of Research Past, Present and Future // Journal of Banking and Finance. 1993. ¹ 17. P. 221–249.
6. Brock P., Franken H. Bank Interest Margins Meet Interest Rate Spreads: How Good is Balance Sheet Data or Analyzing the Cost of Financial Intermediation? University of Washington, May 2002.
7. Caner S., Ungan E. Efficiency of Banks in an Emerging Market: The Case of the Turkish Banking System // Working Paper. 2002. ¹ 7. Bilkent University.
8. Casu B., Molyneux P. A Comparative Study of Efficiency in European Banking. Wharton School of Business, University of Pennsylvania, 2000.
9. Coelli T.J. A Computer Program for Frontier Production Function Estim ation: FRONTIER. Version 2.0 // Economics Letters. 1992. ¹ 39. P. 29–32.
10. Coelli T.J. Estimators and Hypothesis Tests for a Stochastic: A Monte Carlo Anal y-sis // Journal of Productivity Analyy-sis. 1995. ¹ 6. P. 247–268.
11. Demirguc-Kunt A., Huizinga H. Determinants of Commercial Bank Interest Ma r-gins and Profitability: Some International Evidence // Working Paper Series. 1998. ¹ 1900. World Bank. November.
12. King R.G., Levine R. Finance and Economic Growth: Schumpeter Might be Right // Quarterly Journal of Econo mics. 1993. Vol. 108. P. 717–737.
13. Kwan S.H. Operating Performance of Banks Among Asian Economies: An Intern a-tional and Time Series Comparison. Federal Reserve Bank of San Fra ncisco, January 2002.
14. Laevan L. Risk and Efficiency in East Asian Banks // Working Paper. 2000. ¹ 2255. World Bank.
15. Levine R. Financial Development and Economic Growth: Views and Agenda // Journal of Economic Literature. 1997. Vol. 35. ¹ 2. P. 688 –726.
16. McKinnon R.I. Money and Capital in Economic Development. Washington, D.C.: Brookings Instituiton, 1973.
17. Mester L. A Study of Bank Efficiency Taking Into Account Risk-Preferences // Journal of Banking and Finance. 1996. ¹ 20. P. 1025–1045.
18. Resti A. Evaluating the Cost Efficiency of the Italian Banking System: What can be Learned from Joint Application of Parametric and Non-parametric Techniques // Journal of Banking and Finance. 1997. ¹ 2. P. 221–250.
19. Schmidt P. Frontier Production Functions // Econometric Reviews. 1986. ¹ 4. P. 289–328.
20. Schmidt P., Lovell C.A.K. Estimating Technical and Allocative Inefficiency Relative to Stochastic Production and Cost Frontiers // Journal of Econometrics. 1979. ¹ 9. P. 343–366.
21. Weill L. Is There a Lasting Gap in Bank Efficiency Between Eastern and Western European Countries? Strasbourg, France: LARGE, Universite Robert Schuman, Institut d’Etudes Politiques, 2003.
Appendix
Stochastic FrontiersWe use the stochastic frontier production function proposed in Battese and Coelli [1] where firm effects are assumed to be distributed truncated normal ran-dom variables, which are also permitted to vary systematically with time19). The model is estimated by maximizing a likelihood function. The model may be ex-pressed as:
Yit = xitb + (Vit – Uit), i=1,...,N, t=1,...,T,
where Yit is (the logarithm of) the production of the i-th firm in the t-th time period;
xit is a k×1 vector of (transformations of the) input quantities of the i-th firm in the t-th time period;
b is regression coefficient;
the Vit are random variables which are assumed to be identically independently distributed (iid) N(0,sV2), and independent of the
Uit = (Uiexp(–h(t–T))),
where the Ui are non-negative random variables which are assumed to account for technical inefficiency in production and are assumed to be iid as truncations at zero of the N(m,sU2) distribution;
h is a parameter to be estimated.
In the estimation procedure, variances of observed and unobserved errors are utilized where sV2 and s
U2 with s2=sV2+sU2 and g=sU2/(sV2+sU2).
19) More on the estimation of the frontier can be found in [9, 10]. See also, Schmidt and