i
ELECTROCHEMICAL INVESTIGATIONS OF ION
TRANSPORT IN UNCONVENTIONAL
ENVIRONMENTS
A THESIS SUBMITTED TO
THE GRADUATE SCHOOL OF ENGINEERING AND SCIENCE OF BILKENT UNIVERSITY
IN PARTIAL FULFILLMENT OF THE REQUIREMENTS FOR THE DEGREE OF
MASTER OF SCIENCE IN
CHEMISTRY
By
Can Berk Uzundal July 2018
ii ELECTROCHEMICAL INVESTIGATIONS OF ION TRANSPORT IN
UNCONVENTIONAL ENVIRONMENTS By Can Berk Uzundal
July 2018
We certify that we have read this thesis and that in our opinion it is fully adequate, in scope and in quality, as a theiss for the degree of Master of Science.
________________________________________ Burak Ülgüt (Advisor) ________________________________________ Şefik Süzer ________________________________________ Ömer Dağ ________________________________________ Dinçer Gökçen ________________________________________ Ali Çırpan
Approved for the Graduate School of Engineering and Science:
________________________________________ Ezhan Karaşan
iii
ABSTRACT
ELECTROCHEMICAL INVESTIGATIONS OF ION
TRANSPORT IN UNCONVENTIONAL
ENVIRONMENTS
Can Berk Uzundal
M. Sc. in Chemistry
Advisor: Burak Ülgüt
July 2018
Ion transport is a critical process that occurs routinely in all electrochemical devices. Especially the new generation batteries extensively utilized in portable devices, Li-Ion batteries, operate simply through Li+ transport. Although, a multitude of similar energy storage and conversion devices are prevalent in both the industry and the electrochemical literature, these devices are not the only technologies that ion transport is critical. Other technologies such as electrochromic devices, organic electronics and next generation display panels also involve electrochemical processes that are inherently dependent on or limited by ion transport. Conventional electrochemical methods enable interrogation of the
iv various interfaces these devices possess however limited information on the behavior of the concentrated-like media investigated in this thesis compared to the well documented behavior of the dilute media, limits their applicability.
In this thesis we not only offer investigations on possible esoteric materials that have unique ion transport properties that show emergent behavior in the systems they are employed at through fundamental electrochemical studies but also we outline the development of new electroanalytical tools to better interrogate ion transport in variety of electrochemical systems. The attempts at understanding and explaining the ion transport in various media and to leverage its benefits towards better devices is outlined. Electrochemical noise measurements for Li-Ion batteries is shown as a potential tool for ion transport interrogation, while the ion transport behavior of Liquid Crystals and Ionic Liquids are investigated. A new electroanalytical tool to separate counter ion diffusion from electron transfer is also shown. Finally, an electrochemical method to visualize corrosion that utilizes ion transport is outlined in this thesis.
Keywords: Electrochemistry, Electroanalytical tools, Ionic liquids, Liquid
v
ÖZET
GELENEKSEL OLMAYAN ORTAMLARDA
ELEKTROKİMYASAL İYON TAŞINMASININ
SORGULANMASI
Can Berk Uzundal
Kimya, Yüksek Lisans
Tez Danışmanı: Burak Ülgüt
Temmuz 2018
İyon taşınması bütün elektrokimyasal cihazlarda gerçekleşen kritik bir süreçtir. Özellikle taşınabilir cihazlarda kullanılan yeni nesil piller, Li-Iyon pilleri, Li+ taşınımı prensibi ile çalışmaktadır. Bir çok benzer enerji depolama ve dönüştürme aygıtı hem literatürde hem de endüstride yaygın olsa da, bu cihazlar iyon taşınımın kritik olduğu tek teknoloji değildir. Elektrokromik cihazlar, organik elektronikler ve görüntü panelleri gibi diğer cihazlar da iyon taşınımını direk olarak kullanan veya iyon taşınımı tarafından limitlenen başka elektrokimyasal süreçler kullanmaktadır. Geleneksel elektrokimyasal methodlar bu cihazların çeşitli arayüzlerinin incelenmesini sağlasa da, bu tezde incelenen yüksek
konsantrasyon-vi benzeri ortamlarda, iyi incelenmiş seyreltik çözeltiler ile kıyaslandığında, sınırlı miktarda bilgi sağlamaktadır ve bu onların uygulanabilirliğini sınırlamaktadır.
Bu tezde hem iyon taşınımı açısından özgün özelliklere sahip materyallerin elektrokimyasal olarak incelenmesinin yanı sıra iyon taşınımının daha iyi incelenmesini sağlayabilecek elektroanalitik araçların geliştirilmesini de özetliyoruz. Bu tez, elektrokimyasal gürültü ölçümlerini Li-Iyon pilleri için iyon hareketini ölçebilecek potansiyel bir araç olarak gösterirken, sıvı kristaller ve iyonik sıvılarda iyon hareketi incelenmiştir. Aynı zamanda, karşıt iyon difüzyonunu elektron transferinden ayırabilecek yeni bir elektroanalitik yöntem geliştirilmiştir.
Anahtar Sözcükler: Elektrokimya, Elektroanalitik Araçlar, Iyonik Sıvılar, Sıvı
vii
Acknowledgements
On paper this degree is the result of a two-year study. In reality the process started when I set foot on the campus 6 years ago. As such I have a lot of people to acknowledge for help, support and awesomeness.
I sincerely thank all of my Prof’s at the chemistry department, they have been extremely patient with me and shown great interest in not only my development as a scientist but also as a person. I am glad that I had the opportunity to be part of this awesome department.
Unknowingly, the day I met and decided on working with my advisor, Prof. Burak Ülgüt, with extensive guidance from Prof. Ömer Dağ, shaped me in so many ways that I cannot begin to list. I got to learn an awesome field, electrochemistry, from the best. Hocam, not only I learned electrochemistry but also how to be a scientist. I cannot thank you enough. You have given me a solid start for a career. Thank you for your time, thank you for your patience, thank you for your understanding and overall just thank you for everything.
During my time here, I had the chance to pick the brains of almost all of my Profs (aside from my advisor), some more than others. Prof. Şefik Süzer and Prof. Ömer Dağ, you have given me perspectives that I did not even know I could wrap my head around. I truly appreciate your guidance, encouragements and inspirations.
I also need to acknowledge my informal co-advisor Ethem Anber. I have probably spent more time in your office in my first year than in the lab. You have been a
viii wonderful teacher of all things electronic. Not only that but you have given me someone that I can trust whenever something goes wrong. I truly admire your resolve to learn more and be productive and strive to be more like you every day. Thank you.
As important as my firstly academic acknowledgements, I really have to acknowledge the mixed support from my partner in crime (as cliché as that might be). Her support has been mixed because not only did she provide me with emotional support during the many lows that I’ve been through but also she has been in the lab with me throughout all of it. I am looking forward to what is next for us. I hope to write an even better acknowledgement for the next thesis that I will be writing. Thank you Gozde Karaoglu, you have been my only hope.
The obligatory acknowledgement to the family goes as the following;
Annemlerim, thank you for your unquestioning support, without you I would have been strayed away from this path long ago. Annem, whenever I may have needed assistance I knew I could count on you. Beste, you have been there for anything I have asked for, you have been extremely understanding with me being busy all the time, Ece, you know I got the smarts from you. Thank you all.
ix
Table of Contents
Chapter 1 ... 1
1. Introduction ... 1
1.1 General Scope and Overview ... 1
1.2 Basics of Electrochemistry ... 7
Chapter 2 ... 28
2. A New Method for Voltage Noise Measurement and Its Application to Abused Primary Batteries ... 28
2.1 Introduction ... 29
2.2 Materials and Methods ... 32
2.3 Results and Discussion ... 34
2.4 Conclusions ... 48
Chapter 3 ... 50
3. Method for Visualizing Under-Coating Corrosion Utilizing pH Indicators before Visible Damage ... 50
3.1. Introduction ... 51
3.2 Experimental ... 53
3.3 Results and Discussion ... 57
3.4 Conclusions ... 67
x
4. Electrochemical Investigations of Liquid Crystal Mesophases ... 68
4.1 Introduction ... 69
4.2 Experimental Section ... 74
4.3 Results and Discussion ... 76
4.4 Conclusions ... 90
Chapter 5 ... 92
5. Ultrafast Spectro-Electrochemistry of Conjugated Polymer Films ... 92
5.1 Introduction ... 92
5.2 Potentiostat Circuitry ... 106
5.3 Discussions and Future Work ... 116
5.4 Conclusion ... 118
Chapter 6 ... 120
6. Ionic Liquid Modelling ... 120
6.1 Introduction ... 120
6.2 Modelling Considerations ... 123
6.3 Results and Discussions ... 126
6.4 Conclusions ... 135
Chapter 7 ... 136
7. Conclusion and Future Work ... 136
7.1 Conclusion and Future Work ... 136
xi
List of Figures
Figure 1. 1 The Walden plot of various ionic liquids at different temperatures. "Reproduced with permission from [11]." ... 3 Figure 1. 2 Schematic representation of the charge rearrangements in the
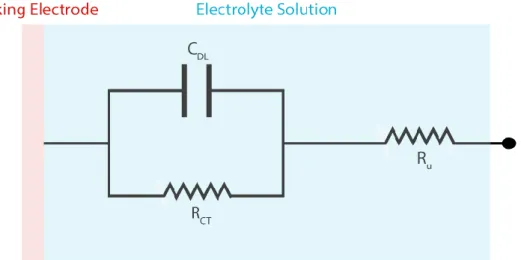
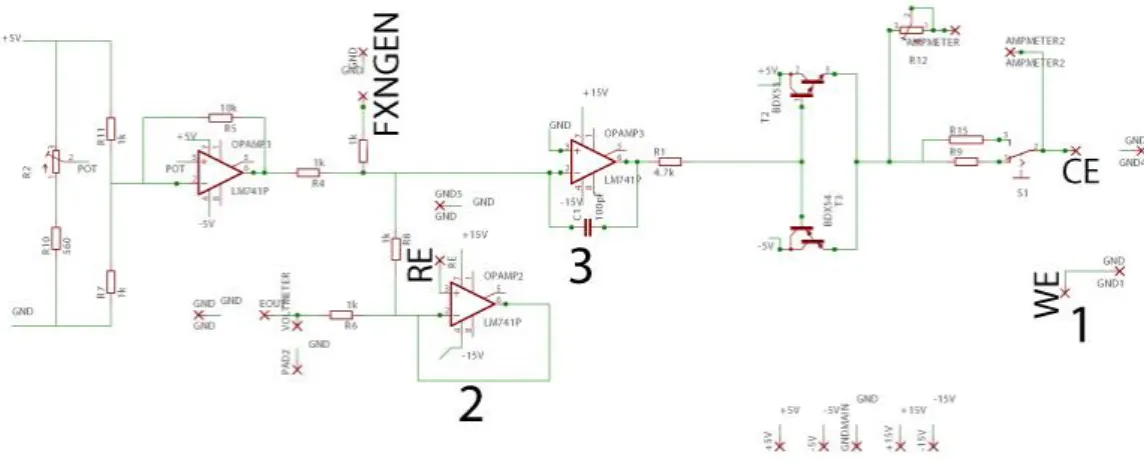
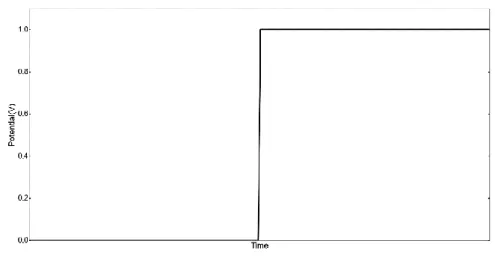
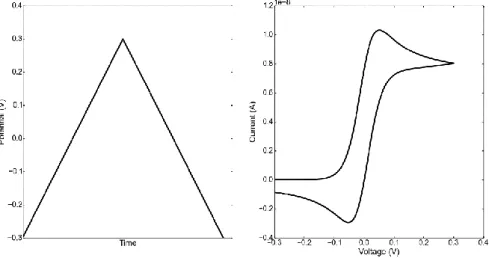
electrolyte solution ... 11 Figure 1. 3 Simplified Randles’ equivalent circuit of a common electrochemical cell ... 14 Figure 1. 4 Circuit schematic of a potentiostat. ... 15 Figure 1. 5 The voltage profile applied in a standard chronoamperometry
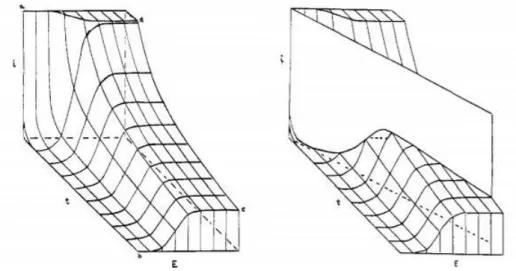
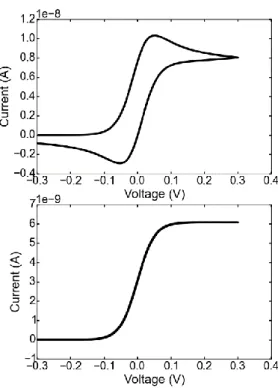
experiment. ... 17 Figure 1. 6 The voltage profile applied in cyclic voltammetry and the resulting cyclic voltammogram. ... 20 Figure 1. 7 Geometrical representation of a linear sweep in the current-time-potential surface. “Adapted with permission from [23]. Copyright 1960, American Chemical Society.” ... 21 Figure 1. 8 Transient(top) and steady state voltammograms(bottom) of a fast redox couple simulated assuming equal diffusion coefficients of the oxidized and the reduced species (1e-5) at a hemispherical UME of radius 10 μm at 1 V/s and 0.001 V/s sweep rates. ... 23 Figure 1. 9 The surface concentrations of the electroactive species under transient conditions (top) and under steady state conditions (bottom) at the peak potential. ... 23
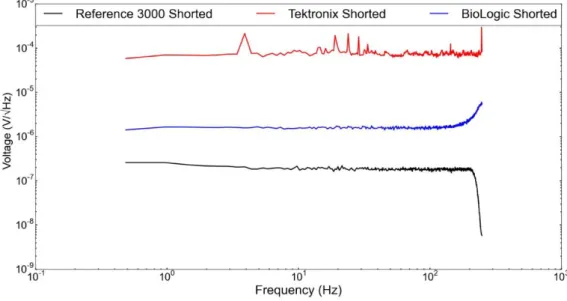
xii Figure 2. 1 Illustration of the increased resolution by offset reduction ... 31 Figure 2. 2 Apparent noise of a 5F Supercapacitor at different states-of-charge. . 36 Figure 2. 3 a) Sliding switch that changes connections from parallel (red) to anti-serial (blue). b) When the connections 1-2 and 5-4 are selected, the batteries are in parallel as shown. c) When the connections 3-2 and 6-5 are selected, the batteries are in anti-serial as shown. ... 38 Figure 2. 4 Shorted lead noise of Tektronix DPO 2002B, Bio-Logic SP-150 and Gamry Reference 3000 in the f-domain. ... 39 Figure 2. 5 Shorted lead noise of various Gamry instruments potentiostats. ... 40 Figure 2. 6 Apparent noise at 4.1V in the anti-serial connection measured over various resistances and compared to the shorted lead of Gamry Interface 1000. . 41 Figure 2. 7 Voltage noise of a Li-Ion battery at 4.1V in parallel and anti-serial configurations compared to the shorted lead measured using Interface 5000, Reference 3000. ... 42 Figure 2. 8. Apparent noise at 4.1V, de-trended time trace shown in black and the pristine trace is shown in red. ... 44 Figure 2. 9 Noise of the same two CR2032 batteries compared in anti-serial and parallel connections after short circuiting the batteries. ... 44 Figure 2. 10 a) Noise of two CR2032 coin-cells attached in anti-serial connection. b) Noise of the same two CR2032 coin-cells attached in parallel connection. (Figure 2.5 serves as a scale for these two graphs for ease of view.) ... 47 Figure 2. 11 Noise of two CR2032 coin-cells attached in anti-serial connection a) in the time domain. b) in the frequency domain. ... 48
xiii Figure 3. 1 Schematic representation of the setup (left). The actual setup (right). 54 Figure 3. 2 The initial experiments with phenolphthalein indicator. Loss of bulk color can be seen on the right. ... 59 Figure 3. 3 Bare metal with 0.1 M Na2SO4 containing 100 mg/L quinine, the initial picture without any fluorescence and the emergence of fluorescence with applied potential. ... 60 Figure 3. 4 Background subtracted images (bottom), unsubtracted images (top). Green color indicates regions of low pH while red indicates an increase in pH. .. 61 Figure 3. 5 The original image (left), background subtracted image (middle), background subtracted image with number of colors reduced to 4 (right). ... 62 Figure 3. 6 Epoxy with a cut, a local pH change along the cut can be observed, especially for the image marked. ... 63 Figure 3. 7 The image of the monitored region, marked by the blue square (left). The normalized green intensity in the region as a function of time (right). ... 64 Figure 3. 8 White plate without background subtraction (top), with background subtraction (bottom). The corrosion can be detected earlier using background subtraction. ... 66 Figure 3. 9 Posterized images of the white plate with phenolphthalein indicator. The red square and the curve shows the visibly corroding region and its green intensity as a function of time while the black square and the curve shows a region without visible corrosion at the end of the experiment. ... 66
Figure 4. 1. The well-known Pourbaix Diagram for Pb species in sulfuric acid solution. Reprinted by permission from[90]. ... 73
xiv Figure 4. 2 POM image of 2.5LC (a) and small angle XRD patterns 9LC, 6LC, and 2.5LC, top to bottom (b). XRD patterns are offset for clarity. ... 77 Figure 4. 3. The Pt electrode experıments (a) and the corrosion rate experiments (b) to confirm the electrochemical activity and to establish an analogy to aqueous solutions of sulfuric acid. ... 79 Figure 4. 4 The Cyclic voltammetry profiles for Pb electrodes in an aqueous solution (black) compared to two LLC phases (2.5LC in blue and 9LC in red) ... 80 Figure 4. 5 SEM images of a lead strip after 10 hours of chronoamperometry at -0.91V (vs. Ag2SO4) (left) in 5M H2SO4 and in 9LC (right). ... 81 Figure 4. 6 The XRD patterns for as conditioned Pb electrodes (a) and after oxidation (b). The black curves (I) show the results in LC and the red curves (II) show the aqueous solution. XRD patterns are offset for clarity. ... 83 Figure 4. 7 PbO-PbSO4 film is developed on top of a lead strip in 9LC by 10 hours CA, then in aq. H2SO4, LSV is done (a). Another similar film is kept in aq. H2SO4 for 24 hours then LSV is done (b). The CV after submerging in aq.
H2SO4 for 24 hours (c). ... 84 Figure 4. 8 Low angle XRD measurements on Liquid Crystals containing
hydroquinone (hQ) and the pristine hQ (green). ... 86 Figure 4. 9 Cyclic voltammograms of Liquid crystals containing different sulfuric acid ratios (9,6 and 2.5). CV was taken at 50 mV/s, with Glassy Carbon working electrode. ... 88 Figure 4. 10 Pt in acid cyclic voltammograms of Liquid crystals containing different sulfuric acid ratios (9,6 and 2.5). CV was taken at 10 V/s, with Pt
working electrode. ... 88 Figure 4. 11 E1/2 for hydrogen adsorption on Pt, obtained for aqueous solutions of various concentrations (black) compared to different liquid crystals. ... 89
xv Figure 4. 12 E1/2 for hydroquinone redox, obtained for aqueous solutions of
various concentrations (black) compared to different liquid crystals. ... 90
Figure 5. 1 The depiction of the position of diffusion layer with respect to sweep rate. Red circles denote electroactive species while the rest are electrolyte ions . 93 Figure 5. 2 LTspice simulation demonstrating the basics of current interrupt technique a) the voltage response of the main node and the voltage over the resistor Ru b) The simulated simplified Randle's Cell. ... 98 Figure 5. 3 The effect of iR drop compensation on a voltammogram of clean Pt electrode in a MeCN solution containing 0.1M TBAP. Voltammogram with iR compensation(left), without iR compensation (right). ... 100 Figure 5. 4 Square scheme of electron transfer kinetics as depicted in the literature for a conjugated polymer. Reproduced with permission from [21]. ... 101 Figure 5. 5 The depiction of the diffusion layer at high and low sweep rates when a polymeric island is deposited on to an electrode. ... 102 Figure 5. 6 The Ultrafast Spectroelectrochemistry setup with a function generator to generate the triangular excitation and an oscilloscope to follow the response with a Gamry fiber optic UV-Vis Spectrometer (top). The three electrode setup inside the spectrometer chamber (bottom). ... 104 Figure 5. 7 a) Self assembled monolayer adsorbed on to a working electrode with pendant redox centers. b) The peak shape at a relatively low sweep rate. c) The peak shape at a high sweep rate. d) Peak separation vs. sweep rate. Reproduced with permission from [109]. ... 105 Figure 5. 8 The equivalent circuit model of a real OpAmp. ... 107 Figure 5. 9 Circuit schematic of a high stability potentiostat with current boosters and a step voltage generator. ... 109
xvi Figure 5. 10 The built instrument with two multimeters to follow the voltage and the current (top). The circuit design for a printed circuit board (PCB) (bottom).110 Figure 5. 11 The circuit schematic of an Ultrafast Potentiostat with positive feedback iR compensation. ... 112 Figure 5. 12 A two layered PCB of the Ultrafast Potentiostat. ... 113 Figure 5. 13 The three electrode setup in a quartz cuvette. ... 115 Figure 5. 14 Cyclic voltammograms at 100 mV/s (left) of drop cast PEDOT:PSS film onto Pt mesh electrode, UV-Vis Absorbance spectra collected simultaneously (right). ... 116 Figure 5. 16 Cyclic voltammograms of a drop cast PEDOT: PSS film onto Pt mesh electrode. ... 117 Figure 5. 17 Aggregate UV-Vis Spectra of a drop cast PEDOT: PSS film onto Pt mesh electrode during ultrafast cylic voltammetry experiments at the specified sweep rates (Wavelengths ranging from 300 to 1100nm). (Colors going from blue to red signify later times.) ... 118
Figure 6. 1 The depiction of the dissected ionic liquid drop in terms of rectangular grids. ... 123 Figure 6. 2 The depiction of the photoelectron ejection upon X-Ray irradiation under external bias supplied by the power supply with surface charge “Q”
introduced by the ejected electrons. ... 126 Figure 6. 3 The binding energy shift under square wave bias (alternating between 4V and -4V) a) visualized by a line scan for an ionic liquid drop between two planar Au electrodes. b) visualized by mapping the whole ionic liquid surface for two Pt point contacts (the colorbar and the height represents the voltage of the particular point). ... 128
xvii Figure 6. 4 Simulated voltage response of the ionic liquid, the obtained voltage profile is visualized a) as histograms b) as a surface plot of mean potential difference in the positive and negative cycles (the colorbar and the height
represents the voltage of the particular point). ... 128 Figure 6. 5 Simulated voltage profiles as a function of the association constant at the same simulated frequency. ... 130 Figure 6. 6 The response of the ionic liquid to an 8 Vp-p square wave at varying frequencies a) measured by XPS for a device with two planar Au contacts, b) simulated by the coarse grained electrostatic model. ... 132 Figure 6. 7 The response of the ionic liquid to an 8 Vp-p square wave at varying frequencies a) measured by XPS for a device with two Pt point contacts, b) simulated by the coarse grained electrostatic model ... 132 Figure 6. 8 Number of charged particles at various positions at the ionic liquid surface across different timescales. ... 133 Figure 6. 10 The simulated voltage response of the ionic liquid at different
frequencies of 8 Vp-p square wave (black), the corresponding change in total number of particles at the given grid (red). The left panels show the response of a grid near the source electrode while right panels show the response near the grounded electrode. ... 135
xviii
List of Tables
xix
List of Abbreviations
OFET: Organic Field Effect Transistor
SEI: Solid Electrolyte Interface
LCD: Liquid Crystal Display
SHE: Standard Hydrogen Electrode
EIS: Electrochemical Impedance Spectroscopy
OpAmp: Operational Amplifier
WE, RE, CE: Working Electrode, Reference Electrode, Counter Electrode
UME: UltraMicro Electrode
CV: Cyclic Voltammetry
A/D: Analog to Digital
xx
RGB: Red Green Blue
LLC: Lyotropic Liquid Crystal
SA: Sulfuric Acid
C12E10: 10-lauryl ether
LAB: Lead Acid Baterry
I/E: Current to Voltage
FTO: Fluorine doped Tin Oxide glass
1
Chapter 1
1. Introduction
1.1 General Scope and Overview
Ion transport manifests itself as an essential component of various electrochemical technologies and their problems encountered on a daily basis. State-of-the-art technologies such as Li-ion based batteries, third generation solar cells, capacitive deionization and smart windows involve processes that are directly limited and controlled by ion transport [1]. For performances beyond the current norm in these technologies/to achieve the theoretical limits in the current device architectures and to guide the development of next generation devices, a fundamental grasp at the molecular scale is required [2,3]. In all electrochemically relevant devices, a change in state (either loss of charge stored, a color change or even change in i-V
2 characteristics for an OFET transistor) is introduced by an applied external bias. Although a fundamental grasp on the electrified interfaces of these devices is in most cases possible and is probed by conventional electrochemical methods as introduced in the Basics of Electrochemistry section of this thesis, certain details of these systems under operation are not predictable with conventional electrochemical methods as will be discussed. For instance, the main charge storage mechanism in rechargeable Li-ion batteries, i.e. Li+ shuttling through an intercalation material, is well understood and can even be modeled to achieve the expected response for a given material [4]. Yet, since its discovery, significant research efforts are directed towards understanding the so-called Solid-Electrolyte-Interface (SEI) that forms during cycling which significantly influence battery performance[5,6]. Contrary to all the efforts, the transport properties of the SEI, is not well known although probable species involved in the formation of the interface have been outlined[7]. Due to the reactive medium complicating experimental approaches, theoretical approaches attract interest and these methods have been recently reviewed elsewhere[8]. The effects of the SEI on the battery operation is not well understood and can be at times contradictory to the common expectations. In principle, SEI needs to rapidly shuttle Li+ while not allowing the permeation of the electrolyte thus passivating the otherwise reactive electrodes towards parasitic side reactions [6]. Recently, transport of various other cations aside from Li+ has been experimentally observed which through disruption of SEI lowers the cycling capabilities of the batteries [9,10]. The unexpected and unaccounted transport of these ions even in the extensively studied Li-Ion systems shows that our
3 understanding on the ion transport processes is lacking compared to our understanding of the initial electron transfer initiated behavior which is well characterized and captured by the conventional electrochemical systems. A theme in this thesis will be introducing novel electrochemical methods to bridge this gap in understanding as will be discussed Chapter 2 and 5 of this thesis.
Figure 1. 1 The Walden plot of various ionic liquids at different temperatures. "Reproduced with permission from [11]."
Electroneutrality principle states that due to coulombic forces, transport of an ion needs to be accompanied shortly after by the transport of another ion of the opposite charge such that the overall charge in the medium is constant and zero[12] This principle, although holds strongly for well supported media, has been shown to fail at short timescales and at relatively close distances (compared to the Debye time
4 and length1 respectively) in weakly supported electrolytes and the relatively simple theory behind accounting for this short scale breakdown has been reviewed elsewhere[12]. A breakdown of electroneutrality, however at much longer length and timescales (compared to the Debye lengths and times relevant to electrolytic solutions) were experimentally observed for the intercalation of ionic liquids into a multi-layered graphene under external bias[13]. These studies in conjunction with other studies that will be introduced in the basics of Electrochemistry section, again demonstrate that the current comprehension on ion transport is lacking or needs overhauls to be able to capture the behavior under applied bias for other materials. Ionic liquids, in particular, seem to generate a lot of interest in the field owing to their low vapor pressure, wide electrochemical window and their high conductivity, yet the rather low number of available charged species[11] allows the investigations of the ion migration effects without the interferences from the ohmic losses that is observed for weakly supported electrolytes. The effect of the lower number of available charged species is clear when compared to an aqueous solution of similar viscosity as shown in Figure 1.1. At the same viscosity the conductivity of the ionic liquid is much smaller, showing that ions do not freely move in the solution but rather participate in a pairing equilibrium [11].As a result, the structure of the electrochemical double layer and its kinetics are still under study and requires multi-dimensional theoretical and experimental investigations to properly address both the microscale ordering[14,15] and the macroscale voltage screening
5 effects[16]. A coarse grained electrostatic model to account for this extended voltage screening effect will be introduced in Chapter 6 of this thesis.
Another open question regarding the ions in various media outlined in this thesis is their activity coefficients, where the activity coefficient itself has inherent information regarding the ion transport events happening inside a medium for the particular ion[17]. Even Nernst equation (as mentioned in the following “Basics” section) can at times be shown to be counterintuitive or not applicable in the same way it is used in conventional systems (as will be shown in Chapter 4 of this thesis). An area of research that has been recently revitalized and that suffers from the lack of understanding caused by the failure of the theories applicable to dilute electrolyte solutions is the so-called solvent-in-salt-electrolytes or soggy-sand electrolytes. Their applications in various fields have recently been reviewed elsewhere[18]. The recent surge in interest towards water-in-salt electrolytes for energy storage applications is owing to the ability of these electrolytes to address safety concerns of the conventional Li-Ion batteries stemming from the organic solvents used. Water-in-salt electrolytes compared to their conventional aqueous counterparts have significantly wider electrochemical windows and thus enhanced energy densities[19]. It is believed that the water in these systems form small channels where these channels act as small reaction chambers. The activity of water in these small channels, however, is not well understood and the current studies mostly focus on predicting the channel structure formed at various water loadings[18]. Further studies are needed to fully understand the activity of water in these concentrated solutions where dilute solution theories, as expected fail. Similar
6 arguments can be extended to Liquid Crystal systems where the water in the system is stuck inside a matrix of surfactant and electroactive species[20] These liquid crystals show excellent conductivities, yet their electrochemical behavior is shown to be completely distinct compared to their aqueous counterparts as will be discussed in Chapter 4.
Although ion transport at various semi-condensed phases described above are not well understood or have aspects that need clarifications both through theory and experimentation, manipulating ion transport for emergent properties have been a common theme in science for well over a decade[21]. Conducting polymers have been extensively utilized in variety of application following their almost metallic conductivities. Especially for light emitting applications and in organic electronics, this class of polymers attract attention. A prime example of leveraging ion transport for emergent behavior is again Li-Ion batteries. Manipulating and achieving control over ion transport can help solve contemporary problems and this is the main theme of this thesis. Utilizing the facile hydrogen transport through a metal, a method that can guide research towards the solution of another contemporary problem, corrosion, will be introduced in Chapter 3 of this thesis.
These examples show that control over ion transport in conjunction with heterogeneous electron transfer can generate emergent behavior in systems under investigation that is not necessarily solely results of either the ion transport or the electron transfer but rather a combination. This thesis outlines attempts at both understanding and controlling ion transport across various media to achieve new behavior in various condensed/semi-condensed phases such as metals, ionic liquids,
7 liquid crystals and conjugated polymers. These classes of materials have upcoming promising applications in numerous applications including energy storage and conversion. Ionic liquids attract attention as a substitute for the conventional solvent based electrolytes used in many industrial applications ranging from simple material synthesis to battery electrolytes owing to their low vapor pressures and high conductivities. Similarly, aside from applications in LCD displays, liquid crystals attract attention as electrocatalysts and even proposed electrolyte substitutes for various batteries alleviating multitude of problems in battery chemistries they are applied at. Conjugated polymers, aside from their excellent electron conductivities for solution processable materials, have applications as electrochromic materials. The reader is encouraged to peruse the specific chapter of interest for a more detailed introduction to the topics summarized briefly here.
1.2 Basics of Electrochemistry
Electrochemistry can be summarized as the study of materials under various applied electrical potentials and currents [22]. Chemical changes as a result of the passing current, be it under controlled potential or current, provides tools that are not readily available within the toolbox of the rest of chemistry. At the very fundamental, chemical changes can be directly quantified by counting the number of electrons consumed for a given process through Faraday’s Law. Although this macroscopic view of counting electrons do give quantitative information regarding electrochemical processes, details of such events are of utmost interest where control over these processes directly control the emergent properties.
8 In a typical electrochemical setup, a metal electrode (called the working electrode) is at the center of the measurement. The perturbation (either a controlled voltage or current) of choice is referred to the working electrode/electrolyte interface. The potential is controlled with respect to a reference electrode whose electrochemical potential is exactly known, such as a Ag/AgCl reference electrode or a Standard Hydrogen Electrode (SHE). The current that needs to pass through the system for a given perturbation does not flow over the reference electrode since that would cause the potential of the reference to eventually shift and introduce artifacts. Instead another metallic electrode is used as current path such that the counter reaction of the reaction occurring in the working electrode occurs at any given time without interfering with the voltage measurement. This is called the counter electrode. The solution in the electrochemical cell contains the analyte of interest (can practically be anything, salts, biomolecules, organic molecules...) while a solvent containing an ionic salt constitutes the electrolyte. The summarized electrochemical setup consists of three electrodes, the working, reference and counter electrodes, where the electrochemical potential of the system is then defined as the potential difference between the working and reference electrodes while the current flows between the working and the counter electrodes. However, an external reference electrode may not always be available for various reasons. For example, batteries only have two terminals (the positive and the negative terminals). Instead, in these cases, a two electrode setup is utilized where the working electrode is attached to one of the terminals while the counter and the reference electrodes are attached to the other. The drawback of this approach is not being able to absolutely measure
9 the potential drops across the two electrode/electrolyte interfaces. The potential in the two electrode setup is defined with respect to the reaction happening at the counter electrode where this counter reaction is usually not known. Even when the reaction is known, the exact concentrations of the species involved in the reaction is usually not available or they change during the course of an experiment causing issues with potential determination. Instead, either this reaction is assumed steady and constant and the potentials are reported without further calibration or the potentials are calibrated using an external or internal redox couple of known potential. Usually ferrocene/ferrocenium couple is utilized as an internal redox couple where the half-cell potential of the reaction under standard conditions is well known and the fast kinetics of the redox couple allows easy potential determination across most electrochemical experiments. Another internal reference that is typically used is the Li/Li+ couple readily available in the electrolyte of a Li-ion battery.
The study of electrochemistry by definition involves elucidating various relationships between the current and the potential of the system under question. Since these two (potential and current) are fundamentally linked (e.g. most simply by Ohm’s Law), controlling either causes a restraint on the other. Experiments under potential control are called potentiostatic experiments while experiments under current control are called galvanostatic experiments. Though similar potential and current waveforms are applied (i.e. sine waves, ramps, sweeps...) for both galvanostatic and potentiostatic experiments, vastly unique conclusions can be made using either constraint. The difference in these methods stems from the
10 fundamental difference between the limits imposed on the system by constraining either the current or the voltage. Considering a limited current experiment, the instrument forces the system to push a set amount of current through the electrolyte no matter the electrochemical reactions taking place to sustain that current through the electrochemical cell. In the extreme case, at high currents, the kinetics of an electrochemical reaction of interest may lag behind and cause another reaction, typically solvent electrolysis, take its place and dominate the voltage responses observed. Therefore, galvanostatic experiments can be thought as controlling the kinetics of the system. Similarly, considering a controlled potential experiment, the instrument holds the potential of the electrode at a certain value which causes only the reactants that are thermodynamically favorable to undergo redox reactions at the relevant kinetics to give a current response. The extent of this driving force can be calculated by comparing the potentials obtained from the Nernst equation (Eq. 1.1) for a given system with the applied potential at the electrode. Therefore, potentiostatic experiments can be thought as controlling the thermodynamics of the system. If given an option between potentiostatic and galvanostatic experiments, usually potentiostatic experiments are chosen since controlling thermodynamics is usually much more predictable compared to fine tuning the currents to obtain and probe the kinetics of interest, especially in aqueous electrolytes. For the purposes of this thesis, mostly potentiostatic methods will be summarized, however, extensions to galvanostatic systems are similar and can be found elsewhere [22].
𝐸 = 𝐸
0+
𝑅𝑇𝑛𝐹
𝑙𝑛
𝑎𝑜𝑥11
Figure 1. 2 Schematic representation of the charge rearrangements in the electrolyte solution
Consider an electrode with an applied positive bias, to screen the applied bias ions in the electrolyte solution needs to rearrange. For applied bias that is positive of the potential of zero charge, negative ions from the bulk solution needs to come in close to the surface of the electrode, this ion rearrangement is called the compact electrochemical double layer and is usually confined near the electrode surface (~ nm) for typical electrolyte concentrations. The cascading ion rearrangements to properly screen the surface charge of the electrode, however, extends much further than the compact layer and is called the diffuse double layer. These ion rearrangements of the electrolyte (that result in transient currents) are not considered in the Faraday’s law since they do not directly involve a redox reaction/chemical change and they are called non-faradaic events. The magnitude
12 of the non-faradaic current and the energy stored in this mode can range orders of magnitude depending on the surface area of the electrode used and is primarily a result of the charging or discharging of the electrochemical double layer. The electrochemical double layer, as described above, can be visualized, in terms of classical electrical circuit components as a double layer capacitor with a certain capacitance. The capacitance and thus the energy stored in the double layer/in non-faradaic fashion depends primarily on the microscopic surface area of the electrode used as predicted by the simple parallel plate capacitor relations. Supercapacitors utilize this charge stored in the double layer and can achieve extremely high capacitances at limited package sizes owing to the extremely small distances at which the charges are stored. In terms of the electroactive material in the solution, the analyte, the applied potential causes the electroactive material in the vicinity of the electrode to pick up or lose electrons at the electrode. For this heterogeneous electron transfer reaction to occur, the electroactive species need to diffuse to the electrode surface in the timescale of the experiment. The timescale of the experiment can be controlled by the applied perturbation, where if a constant potential (as in choronoamperometry) is applied for long periods of time, then an extended region of analyte have the time to diffuse to the electrode and participate in redox reactions, while if the perturbation constantly changes in amplitude and polarity (as in usual cyclic voltammetry) with time, then only a small region near the vicinity of the electrode (~μm in conventional cyclic voltammetry) can participate in redox reactions. This region of the solution where concentrations of the various electroactive species are different than the bulk concentrations as a
13 result of the redox reactions taking place at the electrode is called the diffusion layer. The diffusion layer is a construct that enables the visualization of the processes occurring at the electrode-electrolyte interface where in an electrochemical measurement, faradaic current response is only observed for the species that can travel the length of the diffusion layer in the timescale of the experiment.
Similar to the electrochemical double layer, it is possible to depict the major phenomena occurring in the electrochemical cell as circuit elements. This approach of equivalent circuit analysis is usually employed to extract relevant parameters (resistances, capacitances, number of interfaces...) out of Electrochemical Impedance Spectra (EIS). EIS can get incredibly involved in terms of analysis especially when porous materials such as battery electrodes are investigated. For the simple electrochemical cell, however, a relatively simple equivalent circuit can be constructed which aids in understanding processes occurring near the electrode. As explained above, the electrochemical double layer can be modeled as a capacitor. The capacitance of this capacitor depends on the dielectric constant of the electrolyte and the surface area of the electrode in question. While the ions of the supporting electrolyte move in the solution to form the double layer and use some of the current response, redox reactions at the surface of the electrode compete for the same current, therefore the formation of the electrochemical double layer and the redox reactions should be depicted by circuit elements that are in parallel to each other. The redox reactions can be modeled by a resistance associated with the charge transfer as can be derived by the low over-potential limit of the
Butler-14 Volmer kinetics [22]. The resistance introduced to the electrochemical cell due to the rest of the electrolyte solution/the bulk of the solution, is then modeled as a series resistance. This parasitic resistance causes small ohmic losses in the electrochemical setup which is usually ignored for conventional experiments due to the relatively low value of the resistance (~Ω) and the relatively low currents involved (~µA). The summarized equivalent circuit is called a simplified Randles’ Cell. For a more complete picture for processes under mass transport limits a theoretical circuit component (called a Warburg) can be attached in series to the charge transfer resistance.
Figure 1. 3 Simplified Randles’ equivalent circuit of a common electrochemical cell
The above summarized picture, then, involves multiple physical phenomena occurring simultaneously to yield the currents we investigate in potentiostatic experiments. The flux of redox-active species to the working electrode can be calculated and can be used to predict the current responses to various voltage waveforms. This flux has contributions from diffusion, migration and convection
15 as explained by the Nernst-Planck equation (Eq. 1.2). In most electrochemical systems the contribution to the flux from migration and convection (second and third terms of Eq. 1.2. respectively) are ignored. The migration of electroactive species is ignored since usually a supporting electrolyte is used to carry the bulk of the current flowing through the electrochemical cell while convection is ignored since no intentional flow is introduced into the system. Electrochemical methods under purposefully introduced convective flows is called hydrodynamic techniques and allows the study of electrochemical reactions without mass transport limits. For the purposes of this thesis, these methods are not directly relevant, a detailed discussion can be found elsewhere[22].
𝐽(𝑥) = −𝐷
𝜕𝐶 𝜕𝑥−
𝑧𝐹 𝑅𝑇𝐷𝐶
𝜕𝛾 𝜕𝑥+ 𝐶𝑣(𝑥)
(1.2)On the following sections, for the most prevalent voltage perturbations, the solution of the appropriate ion flux equations will be discussed, however, instrumentation that can apply these voltage perturbations deserve a mention as well.
16 Commercialization of Operational Amplifiers, OpAmps, in cheap and small packages enabled electrochemistry to evolve from few simple DC experiments at constant currents to the vast field it is today. Especially the high bandwidth, high gain OpAmps that are readily available from multiple manufacturers allows custom instruments to be built for tailored applications. The instrument that controls the potential applied to the electrochemical cell is called a potentiostat. Although the specific potentiostat circuitry relevant in this thesis will be discussed in the Ultrafast Spectroelectrochemistry Chapter, the basic principles are as follows. A signal waveform is generated either using a digital or analog signal generator as denoted by FXNGEN in the schematic. The above schematic uses a grounded working electrode (as denoted by 1 in the Figure) for reasons that will be discussed in the Ultrafast Spectroelectrochemistry Chapter. A feedback loop (denoted as 2) that compares the voltage of the reference electrode (denoted as RE) to the voltages of the working electrode (denoted as 3, keep in mind that the working electrode is grounded) and the function generator input is employed such that the potential measured over the working and the reference leads of the instrument is held at the same potential imposed by the signal generator. This outlined circuit can be expanded to include a signal amplification, current to voltage conversion chain and a solution resistance compensation as will be shown in the Ultrafast Spectroelectrochemistry Chapter.
17
1.2.1 Chronoamperometry
Figure 1. 5 The voltage profile applied in a standard chronoamperometry experiment.
In chronoamperometry, a simple abrupt change in potential is applied to the electrode and the current as a result of the applied voltage step is monitored. Potential steps and its associated methods present one of the most utilized techniques in electrochemistry. Information regarding the diffusion coefficients of the electroactive species and the electrochemical reversibility of the system can be extracted by relatively simple treatments to the chronoamperometry data.
As explained in the previous chapter, an electrochemical cell can be explained using equivalent circuit models. This not only helps in understanding the electrode processes and extracting parameters regarding these processes, but also can help predict the behavior of the electrochemical cell to an external perturbation. Considering a simple first order RC circuit, the current response to a step in potential is simply an exponential decay with a certain time constant as shown in Eq. 1.3.
18
𝑖 = −
𝑉𝑜𝑅
𝑒
−𝑅𝐶𝑡(1.3)
Eq. 1.3. is derived for a pure RC circuit, which is applicable for a Simplified Randles Cell, however, in most electrochemical cells, reactions occur under mass transport limitations and flux equations such as the Nernst Planck equation shown in Eq. 1.2 needs to be solved with the appropriate boundary conditions. The problem, however, is simplified considering that migration and convection is ignored and only the Fick’s Law of diffusion needs to be solved for the given geometry. Still the simple RC analysis guides our expectations from an analytical solution and presents a lower limit on the observed currents. Usually, in electrochemical cells, a small electrode is used such that the applied potential does not change the bulk concentrations of ions appreciably and the timescales are such that the bulk concentration is constant. This simplifies the mathematical treatment substantially. Especially with the utilization of ultramicroelectrodes(UME) (of diameter ~μm), this assumption holds without fail.
Once a step is applied, all of the species in the vicinity of the electrode undergo redox reactions and result in a large current, while at longer times, current slowly decays since more and more electroactive species need to travel longer distances from the electrode to continue the redox reaction at the electrode. Assuming a planar electrode with sufficiently large applied potential to fully oxidize or reduce the species at the electrode surface such that the surface concentration of the electroactive species at the given potential is 0, the diffusion equations can be solved to yield the Cottrell equation as seen in Eq. 1.4.
19
𝑖(𝑡) =
𝑛𝐹𝐴𝐷 1 2𝐶 𝜋 1 2𝑡 1 2 (1.4)As can be seen, Cottrell Equation predicts infinite current once the potential step occurs. In reality this infinite jump is limited by various factors. It is important to understand these limitations which are almost always present in any electrochemical methods/setups. The first limit is imposed by the potentiostat of choice to conduct the experiment where there is an upper limit on the current that can be supplied by the instrument, thus the infinite current predicted can never be supplied by the instrument. Even before a faradaic reaction occurs, non-faradaic effects occur and the double layer charging needs to complete. During the experiment the time constant of the electrochemical cell determined by the double layer capacitance and the uncompensated resistance of the electrolyte presents an upper bound on the smallest time at which a change in potential can be established. Therefore, an infinitely sharp current spike cannot be observed. At the infinite time limit, the inherent vibrations in regular electrochemical cells and the local temperature fluctuations due to the current flow introduces convection to the electrochemical cell which causes deviations from the expected behavior predicted by Cottrell equation.
Considering Eq. 1.4, Cottrell equation predicts a current that decays with a square root dependence which is a signature of a process under diffusion/mass transport limit which presents itself in various other forms throughout most electrochemical processes as will be shown for cyclic voltammetry as well.
20 Further extensions of the chronoamperometric techniques to yield steady state voltammograms and reversal experiments to probe reversibility of the systems along with other applications can be found elsewhere [22].
1.2.2 Cyclic Voltammetry
Figure 1. 6 The voltage profile applied in cyclic voltammetry and the resulting cyclic voltammogram.
In cyclic voltammetry, a linear potential that changes at a certain rate (called the sweep rate) is applied to the electrode. The name cyclic comes from the fact that the voltage is swept forwards and backwards between two potential limits at the specified sweep rate. As the potential approaches to values around the half-cell potential of the redox active material, a higher fraction of the electrode collisions result in reactions and current increases as a function of voltage, at some point however, a limit to the increment is achieved due to mass transport limits and the current no longer can increase. A geometrical way of visualizing the peak shape is shown in Figure 1.7. Electrochemical behavior of a system can be fully
21 characterized by collecting current data at closely separated potential steps as depicted [22]. A linear sweep corresponds to a slice in this surface as depicted[23].
Figure 1. 7 Geometrical representation of a linear sweep in the current-time-potential surface. “Adapted with permission from [23]. Copyright 1960, American Chemical Society.”
Similar to the Cottrell equation, solutions to the diffusion equations for various electrode geometries are numerically possible. The most prominent voltammetric feature is the peak in current observed in either scan direction and once both scan directions are plotted in the same plot, the so-called “duck” like shape is obtained. The mathematical treatment of the diffusion equations for cyclic voltammetry are more complicated compared to chronoamperometry because of the time varying potential applied. Still, depending on the applied potential and its value compared to the standard half-cell potential of interest, the current function at different times can be calculated numerically. Similarly, at the peak of this i-E curve, the current function can be evaluated as Eq. 1.5 and is called the Randles-Sevcik equation[24].
22 As can be seen, the value of the peak current evolves with the square root of the sweep rate of the applied potential and again information regarding the diffusion coefficients of the system can be obtained through experiments at different sweep-rates. The information regarding diffusion coefficients, however, is not the reason why cyclic voltammetry is among the first techniques used in elucidating electrochemical behavior of novel systems, rather the information regarding the number of electrons involved in the redox reaction, the reversibility of the system, or whether a coupled chemical reaction occurs to the redox reaction taking place at the electrode makes cyclic voltammetry the technique of choice for almost all electrochemists. The details on how to extract this information can be found elsewhere [24].
The timescale of a cyclic voltammetry experiment is determined by the sweep rate of the applied potential. For instance, as an oxidizing potential is swept only the current response from the oxidizable species in the electrolyte solution that can diffuse from the solution to the electrode surface before the polarity/scan direction of the applied potential is reversed can be seen. The length from the electrode at which these species reside is called the diffusion layer as explained previously. By definition this length depends on the sweep rate. At high sweep rates the length of the diffusion layer is small while at low sweep rates the length of the diffusion layer is large. The ability to probe different timescales with a single experiment is among the reasons why cyclic voltammetry is such a versatile tool in investigating not only ion transport but also other novel systems[24].
23
Figure 1. 8 Transient(top) and steady state voltammograms(bottom) of a fast redox couple simulated assuming equal diffusion coefficients of the oxidized and the reduced species (1e-5) at a hemispherical UME of radius 10 μm at 1 V/s and 0.001 V/s sweep rates.
Figure 1. 9 The surface concentrations of the electroactive species under transient conditions (top) and under steady state conditions (bottom) at the peak potential.
24 Depending on the timescale of the experiment and the electrodes in question, the results of a given cyclic voltammetric experiment can vary greatly as shown in Figure 1.8. The cyclic voltammetry response of a hemispherical electrode at different timescales were simulated and a transition between the transient and steady-state voltammograms can be seen. The perfectly overlapping forward and backward sweeps show that the voltammogram is independent of the kinetics at the electrode for a steady state voltammogram while the peaks observed for the transient voltammogram suggests that the oxidation and the reduction reactions are displaced with respect to each other thus have kinetic contributions. For the simulated hemispherical electrode, two modes of diffusion can be imagined, a linear diffusion and a spherical diffusion. Spherical diffusion is much more effective in mass transport compared to linear diffusion due to edge effects [22]. At long timescales, the contribution from the spherical diffusion to the electrode dominates the response and as such the more effective mass transport results in the constant concentration profile observed in Figure 1.9. At short timescales, linear diffusion becomes more effective and dominates the current response, however, since it is not as effective in mass transport as spherical diffusion, electrode kinetics and various differences in the transport properties of the electroactive species results in the well-known transient cyclic voltammogram as shown in Figure 1.8.
Recently cyclic voltammetry investigations in model compounds (such as quinones) that undergo two consequent electron transfer reactions followed by a chemical reaction between these electroactive species in the following scheme were
25 conducted in weakly and fully supported electrolytes to elucidate the fine details in the electrochemical reaction mechanism involved.
𝑂𝑥 + 𝑒− ⇌ 𝑂𝑥− 𝑂𝑥−+ 𝑒− ⇌ 𝑂𝑥2− 𝑂𝑥 + 𝑂𝑥2− ⇌ 2𝑂𝑥−
The chemical reaction in the above mechanism is called a comproportionation reaction where Ox and Ox2- are two reactants that have the same molecular formula, however at different oxidation states. The presence of this comproportionation step in a two electron transfer mechanism cannot be probed by conventional cyclic voltammetry in fully supported electrolyte solutions. As such two reversible redox waves of comparable peak size is seen in the conventional cyclic voltammetry regardless comproportionation occurs or not. In a weakly supported electrolyte, however, the second reduction wave, compared to the first oxidation has a noticeably smaller peak. This can be explained by the fact that the current at the second reduction peak is limited by the diffusion of neutral Ox species to the electrode in the absence of a comproportionation step. The diffused Ox undergoes two consequent and almost immediate oxidation steps to yield the current response. In the presence of a comproportionation step, however, the diffusion limit is imposed by the negatively charged Ox- species whose transport can be effected by electric fields near the electrodes. In the properly supported medium, the electric field effects are nullified while in weakly supported electrolytes these differences can be measured through voltammetry[25]. This study not only highlights the inability of the conventional voltammetry to distinguish between mechanisms
26 under different ion transport regimes but also proposes a new tool in the electrochemical toolbox that is cyclic voltammetry in weakly supported electrolytes. Establishing novel methods to probe the effects of ion transport as previously explained is among the chief aims of this thesis.
The rest of this thesis is organized as follows: In Chapter 2 a method of measuring the electrochemical noise of commercial Li-Ion batteries and supercapacitors is outlined where the electrochemical noise should have information regarding ion transport phenomena occurring at the equilibrated state. A new offset reduction method is introduced and employed to accurately measure the electrochemical noise of batteries. Especially for primary batteries, electrochemical noise will be shown as a potential tool to characterize whether a given cell is shorted or not. In Chapter 3, a simple method that utilizes facile hydrogen transport through coated metal samples and pH indicators to reveal coating defects which is detrimental for overall coating integrity especially under corrosive environments will be outlined. Chapter 4 involves electrochemical investigations in an unconventional electrolyte, a Liquid crystal mesophase. The ability of this phase to stabilize thermodynamically unstable species for potential applications in Lead Acid Batteries will be shown, as well as fundamental investigations towards understanding the processes that govern this distinct behavior compared to their dilute solution counterparts will be discussed. In Chapter 5, an ultrafast potentiostat circuit with positive feedback on-line iR compensation will be discussed. Its potential in decoupling consecutive processes across multiple timescales will also be discussed. Moreover, developments towards a new spectroelectrochemical method, Ultrafast
27 Spectroelectrochemistry with a broadband UV-Vis spectrometer will be shown. Finally, in Chapter 6, a computationally inexpensive, coarse grained electrostatic model to explain the charge screening effects and the double layer formation kinetics at extended distances away from the point of contacts for an ionic liquid under external bias will be outlined. Through comparison between the described model and XPS results, insights towards understanding ion dynamics in this unconventional electrolyte will be discussed.
The unifying theme is developing an understanding of ion transport in an unconventional system (such as ionic liquids or liquid crystals) or attempts at improving on the state-of-the-art to extract further information regarding ion transport and ion transport controlled processes.
28
Chapter 2
2. A New Method for Voltage Noise
Measurement and Its Application to
Abused Primary Batteries
(This part is also described in Can Berk Uzundal; Burak Ulgut, “A New
Method for Voltage Noise Measurements and Its Application to Abused Primary Batteries”, Journal of Electrochemical Society, Under Review. “Reproduced with permission from JES Copyright 2018”)
29
2.1 Introduction
Ionic transport governs the operation and performance of a number of electrochemical devices. Information regarding the underlying processes within electrochemical systems can be extracted through processing signals that are either the results of applied external excitations or intrinsically generated.
Electrochemical noise measurements with the appropriate measurement and signal processing routines especially relevant in this regard where the noise measured is a vital indicator of the stochastic processes such as crevice and pitting in corrosion studies. The electrochemical noise literature is rich with both well-defined measurement systems and data analysis methods. Application of these methods to corrosion systems were thoroughly reviewed by Cottis[26]. Further, a guideline to standardize electrochemical noise in studies of corrosion were published by ECG-COMON[27]. If measured properly, even local behavior can be extracted from monitoring voltage or current noise of corroding systems[28–30]. Recently, electrochemical noise measurement of fuel cells and batteries have been attracting interest as a diagnostic tool due to the non-invasive nature of the measurement. Residual water content of the fuel cell, which is known to be detrimental, was shown to correlate with the electrochemical noise of the system[31]. On another example, calendar aging of supercapacitors were followed by careful investigations of their flicker noise [32]. In batteries, early reports of electrochemical noise measurements were conducted using aqueous chemistries as extensions to the corrosion studies. Lead-acid batteries were the focus of these reports where
30 electrolysis can be followed via noise measurements[33]. Similar measurements were further extended to Ni based aqueous systems as well[34,35]. Yet, noise measurements involving new generation batteries, especially Li-Ion batteries are sparse in the literature. Only recently, articles measuring voltage noise of commercially available Li-Ion batteries with very low backgrounds was published [36]. The conclusions drawn from this low background electrochemical noise data, however, is highly suspect since the published analysis suffers from lack of appropriate de-trending. The need for well-defined analysis methods and measurement techniques is clear. The apparent noise should be, unequivocally, from the battery while the numerical handling of the stochastic data should not introduce artifacts.
These techniques elucidate the underlying processes to both diagnose the state of the systems and also gain insights to increase next generation performances[37,38]. Especially for primary chemistries that are inherently not rechargeable, nondestructive/equilibrium techniques such as electrochemical noise is attractive where conventional techniques deplete the battery in question during the quality control process. For various other attempts at non-destructive battery quality control methods see the following references[39,40].
Though underappreciated in academic circles, the market share of the primary batteries are still expected to continuously grow in the near future and thus primary battery diagnosis is still an open question[41]. Primary chemistries are prevalently used in household items and medical tools due to their high and steady energy outputs in addition to their military uses.
31 Though both voltage and current noise are routinely measured in corrosion studies, due to the much lower noise levels, current noise measurements of batteries are dominated by the noise introduced to the system due to the noise in the applied potential. Therefore, noise studies on batteries are focused on voltage noise only [32–34,36] since the noise measurements can be performed without any applied signal under open circuit. For simplicity, throughout the rest of this manuscript, noise always refers to voltage noise.
In the literature, to draw both quantitative and qualitative conclusions from noise data, usually a background measurement is employed that involves a shorted lead measurement and resistors of relevant resistance levels[26]. Although resistor experiments can guide the initial inquiry, voltage noise of batteries are affected by issues that are not reflected in resistor measurements.
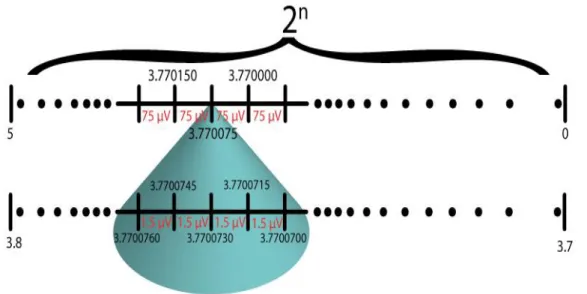
Figure 2. 1 Illustration of the increased resolution by offset reduction
An analog process that ends up introducing artifacts to the measured signal at amplitudes relevant to noise measurements (~μV) in batteries is offset subtraction.
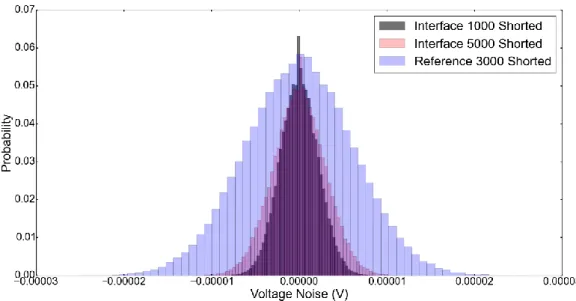
32 Most instruments achieve high resolution even at high voltage amplitudes by offset subtraction and gaining the low residual as illustrated in Figure 2.1. The smallest voltage that can be measured above the quantization error is determined both by the amplitude of the voltage signal to be converted and the resolution of the A/D converter (given by the number of bits available). Roughly, offset correction subtracts the static part of the voltage from the whole thus reducing the voltage amplitude and increasing the resolution on the analog-to-digital converter. Our experiments show that this offset correction may significantly contribute to the apparent noise and can be circumvented by using another battery of the same voltage in an anti-serial connection (i.e. connected in series with same sign poles connected to each other) as shown in Figure 2.3. When two batteries are attached in parallel, they are at a high voltage amplitude (4.1V) which requires offset correction to achieve high resolution. During this offset correction, noise that stems from the instrument is introduced to the measurement. In the anti-serial connection, the voltage that needs to be measured by the instrument is effectively already offset corrected (it is at 0V) which enables the high resolution required for noise measurements. Offset correction by anti-serial connection achieves the high resolution required for battery noise measurements while mitigating the noise introduced by the electronic offset reduction.
2.2 Materials and Methods
SANYO 18650 Li-Ion batteries of 3400mAh capacity, MAXELL CR2032 (batch 63) coin-cells and 5F Nesscap Supercapacitors were procured from local suppliers.
33 Supercapacitors and the 18650 batteries were charged to the desired voltage and left to relax over a day such that voltage equilibration is complete (voltage changes less than 1mV/min) prior to noise measurement.
Impedance of primary batteries were measured galvanostatically with a DC offset of -2µA and AC amplitude of 2µA in the frequency region of 10mHz to 50kHz.
All measurements were done inside an earth grounded Faraday’s cage to ensure the quality of the experiment. The energy storage devices were connected to the Gamry Interface 5000 in a two electrode configuration. ESA 410 software which specializes in measurement of electrochemical noise was utilized. Using this software, the potentiostat can be used as a galvanostat with an output frequency of 500 Hz and an output filter of 0.1%. The data was sampled at 500 Hz. Only for primary batteries the output frequency and the sampling rate was lowered guided by our initial experiments on primary batteries where the battery noise was mostly seen in the low frequency region. For these systems, the potentiostat was operated as a galvanostat with an output frequency of 5 Hz, sampled at 5 Hz.
The voltage noise measured has a contribution from the slow self-discharge of the batteries and various instrumental offsets. The analytical form of self-discharge can be extremely complex and may not be known[42] therefore directly removing it from the voltage noise with a non-linear fit is not viable. Instead a piecewise linear trend is used in the literature to remove this background[26]. The obtained de-trended voltage can be taken to the frequency domain and analyzed, however the voltage trace is not periodic but rather stochastic, thus limited insight is gained from
![Figure 1. 1 The Walden plot of various ionic liquids at different temperatures. "Reproduced with permission from [11]."](https://thumb-eu.123doks.com/thumbv2/9libnet/5687456.114748/23.892.208.780.412.799/figure-walden-various-liquids-different-temperatures-reproduced-permission.webp)