Analyst, April 1994, Vol. 119 693
Analysis of Polymers Using Evolved-gas and
Di rect-pyrol ysis Techniques"
Mohammed M. Fares, Talat Yalcin and Jale Hacaloglu
Chemistry Department, Middle East Technical University, 06531 Ankara, Turkey
Atilla Gungor
TUBITA K Marmara Research Center, 41 470 Gebze, Kocaeli, Turkey Sefik Suzert
Chemistry Department, Bilkent University, 06533 Ankara, Turkey
Thermal analysis of polystyrene, poly(p-methylstyrene) and poly(a-methylstyrene) has been carried out using evolved-gas analysis by infrared and mass spectrometry, and direct- pyrolysis analysis by mass spectrometric techniques. Evolved-gas analysis, both by infrared and mass spectrometry, reveals features due mainly to the
corresponding monomers or stable, volatile, and low relative molecular mass degradation products. In direct-pyrolysis mass spectrometry, however, primary decomposition products and heavier fragments such as dimers and trimers can also be detected. The ion-temperature profiles of the corresponding monomer ions reveal information about the thermal stability of the polymers.
Keywords: Polymer; pyrolysis; Infrared technique; mass spectrometry
Introduction
In a thermal-degradation study there may be many different objectives such as polymer identification, determination of thermal stability, degradation mechanism and products, or measurement of the temperatures at which physical or mechancial properties change. The techniques available for the study of the thermal decomposition'" of polymers have increased substantially during the last decades, each having its own potential and limitations, Pyrolysis techniques are among the most common methods, especially if degradation products are sought. Indirect pyrolysis or evolved-gas analysis29"lo can be carried out with gas chromatography-mass spectrometry (GC-MS), mass spectrometry (MS) or infrared (IR) tech- niques. The information that can be obtained is limited and questionable, as only volatile fragments can be analysed and secondary reactions are likely to confuse the interpretation of results. In direct-pyrolysis MS6-11-13 high relative molecular mass fragments are also detected, as condensation is preven- ted. Furthermore, as the possibility of secondary reactions is diminished, due to the high vacuum conditions and the rapid MS detection system, the data are more reliable for the investigation of degradation mechanisms.
The thermal degradation of polystyrene (PS), has been the subject of numerous investigations for many years with the use of different thermal-analysis techniques.8,14-'9 The thermal analyses of its methyl-substituted derivatives such as poly@- methylstyrene) (PPMS) and poly( a-methylstyrene) (PAMS) have also been studied to some extent.20-23 In this work, our * Presented at the XXVIII Colloquium Spectroscopicum Internationale (CSI),
York, UK, June 29-July 4, 1993.
+ To whom correspondence should be addressed.
principal aim was to compare evolved-gas and direct-pyrol ysis techniques by studying the results of the thermal analysis of PS, PPMS, and PAMS using MS and IR techniques.
Experimental Apparatus
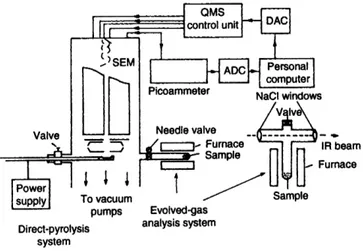
The mass spectrometer used throughout was a Balzers QMG 311 spectrometer coupled to a personal computer for instru- ment control, and data acquisition and processing. A Nicolet 510 FTIR spectrometer was employed for IR studies. Fig. 1 shows a schematic diagram of the experimental set-up.
Evolved-gas Analysis by MS and IR
The experimental system used in evolved-gas analysis (EGA)18J9 consisted of a pyrolysis chamber and a furnace. A needle valve was used to control the flow of the evolved gases into the mass spectrometer. The maximum temperature that could be reached was 700°C. The same system could also be connected directly to an IR gas cell. Samples (10 mg) in the form of fine powders were used. After sample introduction and before the start of the experiment, the pyrolysis chamber and the IR gas cell were evacuated to 0.01 Pa; the cell was heated to 50°C, while evacuated, to dry the solvent or the unreacted monomer. The gases evolved were recorded at
NaCl windows Picoammeter
Sample Evolved-gas
Direct-pyrolysis analysis system system
Fig. 1 Experimental set-up. The quadrupole mass spectrometer (QMS) is controlled by a personal computer via the digital-to- analogue converter (DAC). the ions are multiplied by the secondary electron multiplier (SEM), amplified by the picoammeter and read by the computer via the analogue-to-digital converter (ADC)
Published on 01 January 1994. Downloaded by Bilkent University on 28/08/2017 12:54:26.
694 Analyst, April 1994, Vol. 119
10 "C intervals and the data were stored for further manipula- tion. Typically, a heating rate of 10°C min-1 was applied. Direct-pyrolysis MS
A direct insertion probe has been designed for direct pyrolysis experiments.13 It consists of a stainless-steel tube Ag-soldered to a copper sample holder assembly, a heater, a power supply, and a cromel-alumel thermocouple. The probe can be inserted directly into the mass spectrometer using a valve that allows differential pumping of the probe-inlet line. The samples, in the form of films cast from 0.1% m/v polymer- benzene solutions onto the flat base of the copper sample holder (6 mm diameter), are subjected to thermal degradation under high vacuum ( 4 0 - 2 Pa). For direct pyrolysis, a slightly higher heating rate, 15 "C min-1, is employed. It is known that not only homogeneity, but also sample thickness are impor- tant in thermal analysis. To check the effect of sample thickness, films generated by the evaporation of 20,30, and 50 pl of 0.1% monodispersed PS (number average molecular mass, M, = 300000)-benzene solutions were used. The relative intensities of the peaks at mlz 78, 91, 104, and 208, recorded during the thermal degradation of PS at temperat- ures corresponding to maximum ion yields for the three samples, are given in Table 1. As the relative intensities of these main peaks in the PS spectrum are seen to be independent of the solution volume evaporated, the results indicate that the sample thickness does not have any significant effect on the degradation processes in this volume range. Hence 20 pl of 0.1% m/v polymer solution were used
Table 1 Relative intensities of some characteristic peaks observed
during the direct pyrolysis of PS cast from 20,30, and 50 ~ 1 0 . 1 % m/v
solutions
Relative peak intensity (%)
Volume/yl T,,,,,PC mlz 78 mlz 91 mlz 104 mlz 208
20 230 584 890 lo00 22
30 228 593 896 lo00 17
50 229 588 878 lo00 30
Table 2 Relative intensities of the most characteristic peaks observed during the indirect pyrolysis (above 400°C) of PS, PPMS, and PAMS. with the assigned chemical formulae
Relative intensity (%) mlz 77 78 91 92 103 104 105 106 115 117 118 PS 326 547 81 34 718 lo00 - - - -
-
PPMS 170 105 697 110 174 20 64 65 319 lo00 764 PAMS 335 398 294 28 543 99 25 4 279 872 lo00 Assignment C6H5+ C6H6+ C7H7+ C,H,CH,' C,HsCH = CH' C,HSCH = CH,' C7H,CH3' CH3 CH;,C,H,C,H,' fJ@ C,H,CH = CH' CH = CH,' CH3C = CH,'O
CH3h
throughout the direct-pyrolysis experiments to minimize possible contamination of the spectrometer.
Polymer samples
Monodispersed PS samples (number average molecular mass, 300000) supplied by Aldrich (Milwaukee, USA) were used without further purification. Poly(p-methylstyrene) and poly(wmethy1styrene) were prepared as described previ- ously.21.25
Results and Discussions Evolved-gas Analysis by MS
None of the polymers under investigation produced ion peaks at higher mlz than the monomer peaks. Intense peaks below
h
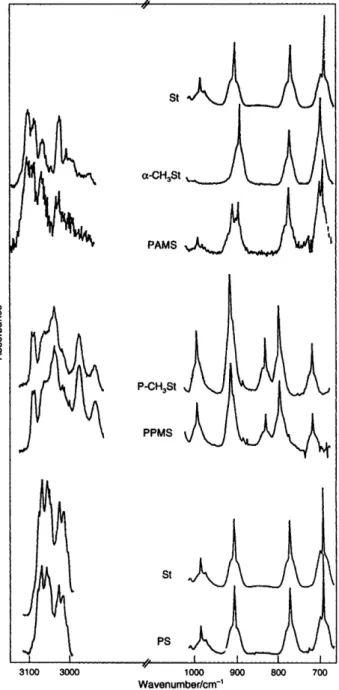
~ PAMS I I 3100 3ooo lo00 900 800 700 Wavenumbedcm-'Fig. 2 IR spectra of evolved gases from the pyrolysis of PS, PPMS,
and PAMS, and the corresponding monomers: St, styrene; P-CH3St,
p-methylstyrene; and cw-CH3St, cw-methylstyrene. Only part of the spectrum is displayed in each instance as the full spectra reveal features due to C 0 2 , H 2 0 . etc., which could cause unnecessary confusion
Published on 01 January 1994. Downloaded by Bilkent University on 28/08/2017 12:54:26.
Analyst, April 1994, Vol. 119 695
mlz 40 were observed during the initial stages of pyrolysis below 350 "C, indicating the formation of low relative molecular mass volatile compounds such as ethylene and acetylene. The main decomposition started above 400°C for the polymer samples studied in this work. The relative intensities of the most characteristic ions observed during the direct pyrolysis of PS, PPMS, and PAMS, and the assigned chemical formulae are given in Table 2. The base peak is the monomer at mlz 104 for PS and mlz 118 for PAMS, whereas for PPMS, the base peak is at mlz 117. As the mass spectra of the gases, e.g., of the corresponding monomers, toluene and styrene, also yield identical peaks due to ionization andor fragmentation within the ion source of the mass spectrometer, it is extremely difficult to assign with high certainty all the fragments produced.
All the polymers under investigation yield mainly their corresponding monomers, similar to the situation with indir- ect pyrolysis. However, peaks corresponding to dimer ions (at mlz 208 for PS, mlz 236 for PAMS, and mlz 235 for PPMS) are also detectable. Other high mass fragments around mlz 131, 167, 178, 194,221, and 250 can also be detected. In all three instances, the intensities of the higher mass peaks are less than 5% of the monomer ion intensities. However, it must be remembered that the peaks observed in the mass spectra cannot be directly attributed to sample-degradation products, as further fragmentation by electron impact occurs in the ion source. It is also known that under vacuum or in an oxygen atmosphere, thermal degradation of PS at elevated tempera- tures (below 300 "C) is initiated by random scission of the main
Evolved-gas Analysis by IR
The IR spectra recorded during the pyrolysis of polystyrenes indicate that the polymers mainly depolymerize to the corresponding monomers. The relevant parts of the IR spectra of the gases evolved during the pyrolysis of PS, PPMS, and PAMS, and of the related monomers are shown in Fig. 2. The spectrum of the evolved gases from PS matches exactly the spectrum of the monomer (St). Similarly, the spectrum of the evolved gases from PPMS is the same as that of its monomer, p-methylstyrene (P-CH3St). Only for PAMS, is there an indication of styrene (St) formation in addition to the presence of the monomer (a-CH,St). No other thermal degradation product can be identified from the IR data for any of the polymers under study. Weak peaks due to the solvents used in sample preparation are present in the PPMS spectrum.
Direct-pyrolysis by MS
The mass spectra recorded at different temperatures during the direct pyrolysis of PS are shown in Fig. 3. Analysis of such data requires a considerable amount of effort. Fig. 4 displays the mass spectra obtained during the direct pyrolysis of PS, PPMS, and PAMS at 230, 217, and 197"C, corresponding to their respective maximum decomposition temperatures.
. . L .
... ...
_...-
F I 50 I I 175 300 m/zFig. 3 Mass spectra of PS recorded at various temperatures: A, 50;
B, 60; C, 70; D, 80; E, 90; F, 100; G, 200; H, 210; I, 220; J, 230; and K, 240 "C I18 I I 194 50 100 150 N Z 200
197 "C, respectively). RI, RelatiGe intensity a
Fig. I Direct-pyrolysis mass spectra of ( a ) PS, (b) PPMS, and
PAMS at their maximum decomDosition temwratures (230, 217 and
Fig. 5 Ion-temperature profiles of the monomers corresponding to 180 190 200 210 220 230 240
TemperaturePC
PS (St), PPMS (P-CH3St), and PAMS (cx-CH$t)
Published on 01 January 1994. Downloaded by Bilkent University on 28/08/2017 12:54:26.
696 Analyst, April 1994, Vol. 119
chain, without evdution of low relative moelcular mass volatile products to give primary and secondary macrorad- icals, which depolymerize to the monomer.15-17724 Hence a radical depolymerization mechanism, initiated by random scission of the main chain followed by unzipping reactions, can be assigned for the thermal degradation of these polymers under direct-pyrolysis conditions, in agreement with other findings.14-20 Owing to similarities between the ions that would be produced from all possible products, complete identification of the decomposition products is not possible.
Some information concerning the thermal stability of the polymers can also be inferred from the data. The ion- temperature profiles of the monomers corresponding to the polymers studied exhibit different maxima for each polymer (Fig. 5). Accordingly, the thermal stability of these polymers is seen to follow the trend, PS
>
PPMS>
PAMS, as expected.Conclusions
It has been shown that of the three systems studied direct- pyrolysis MS provides the most reliable information for structural analysis an dor the determination of the degrada- tion mechanism. Only stable degradation products can be detected by evolved-gas analysis. Mass spectrometric tech- niques yield more complicated data than evolved-gas analysis by IR, however, the much lower sensitivity of IR spectro- meters must be taken into account.
We acknowledge the financial support provided by METU through research grant No. AFP-92-01-03-01, and one of us (M. M. F.) acknowledges the TUBITAK fellowship.
References
1 McNeil, 1. C., Polym. Eng. Sci., 1980, 20, 668.
2 Emmerich, W. D., Janoschek, J., and Kaisersberger, E.,
J . Therm. Anal., 1989,35, 1067.
3 Barnes, P. A., Thermochim. Acta, 1987, 114, 1.
4 Grassiee, N., Br. Polym. J., 1984, 16, 244. 9 10 11 12 13 14 15 16 17 18 19 20 21 22 23 24 25
Schultze, D., Thermochim. Acta, 1987,110,51.
Morelli, J. J., J. Anal. Appl. Pyrol., 1990, 18, 1. Luderwald, I., Pure Appl. Chem., 1982,54,255.
Erdogan, M., Yalcin, T., Tincer, T., and Suzer, S., Eur. Polym.
J . , 1991,27,413.
Langer, H. G., Thermochim. Acta, 1986, 10, 187. Holdiness, M. R., Thermochim. Acta, 1984,75361. Meuzelaar, H. L. C., Windig, W., Harper, A. M., Huff, S. M., McClennen, W. H., and Richards, J. M., Science, 1984, 226, 268.
Blease, T. G., Peterson, G. A., and Scrivens, J. H., Br. Polym., J., 1989,21,37.
Fares, M. M., Hacaloglu, J., and Suzer, S., Eur. Polym. J . , in the press.
Lehrle, R. S . , Peakman, R. E., and Robb, J. C., Eur. Polym. J., 1982, 18, 517.
Cameron, G. G., Bryce, W. A. J., and McWalter, I. T., Eur.
Polym. J., 1984,20,563.
Guaita, M., Br. Polym. J., 1986, 18,226.
Ohtani, H., Yuyama, T., Tsuge, S., Plage, B., and Schultan, H. R., Eur. Polym. J . , 1990, 26,893.
Greenwalt, C. G., Futrell, J. H., and Lyman, D. Y., J. Polym.
Sci. Part A , Polym. Chem., 1989,27, 301.
Ozden, B., Yalcin, T., and Suzer, S., J. Mol. Struct., 1992,267, 135.
Malhotra, S. L., Lesard, P., Minh, L., and Blanchard, L. P., J. Macromol. Sci., Chem., 1980, A14,517.
Schroder, U. K. O., Ebert, K. H., and Ederer, H. J.,
Makromol. Chem., 1987,188, 561.
Malhotra, S. L., Baillet, C., Minh, L., and Blanchard, L. P., J. Makromol. Sci., Chem., 1978, A12, 129.
Guaita, M., and Chiantore, D., Polym. Degr. Stability, 1985, 11, 167.
Luderwald, I., and Vogl, O., Makromol. Chem., 1979, 180, 2302.
Leonard, J., and Malhotra, S. L., J. Polym. Sci., 1971, A l , 1983; and 1976, A10, 1279.
Paper 31041 93J Received July 19, 1993 Accepted September 7, 1993
Published on 01 January 1994. Downloaded by Bilkent University on 28/08/2017 12:54:26.