Custos e @gronegócio on line - v. 15, n. 2, Abr/Jun - 2019. ISSN 1808-2882
www.custoseagronegocioonline.com.br
Comparison of economic Analysis of dairy farms supported and
non-supported by IPARD program: a case study of Konya Province, Turkey
Recebimento dos originais: 21/11/2018
Aceitação para publicação: 12/06/2019
Aykut Örs
Ph.D. in Agricultural Economics
Institution: Agriculture and Rural Development Institute Address: Konya Provincial Coordination Unit.
P.O.Box:42060, Konya, Turkey E-mail: [email protected]
Cennet Oğuz
Prof. Dr. in Agricultural Economics Institution: Selçuk University
Address: Faculty of Agriculture, Department of Agricultural Economics. P.O.Box:42075, Konya, Turkey
E-mail: [email protected]
Abstract
The aim of this study was to compare the economic analysis of dairy farms, supported and non-supported by The Instrument for Pre-Accession Assistance-Rural Development (IPARD) program in Konya where has an important place in milk production in Turkey. The primary data of the study were obtained from dairy farms supported and non-supported by the IPARD program by using a questionnaire filled during the face-to-face interviews. Full count method was used to determine the 50 dairy farms supported by IPARD Program (SDF) while Neyman allocation sampling method was used to determine the 100 dairy farms non-supported by IPARD program (NSDF). As a result of the study, the average gross production value (GPV) was found as $154,618.59 per farm in NSDF while it was found as $624,334.06 in SDF. The average GPV per Large Animal Unit (LAU) was $3,104.98 in NSDF while it was $3,909.29 in SDF.As expected, for both groups, most of the costs constituted from feed costs. In NSDF, 48.65% of the variable costs were concentrated feed and 42.09% was roughage in NSDF, while these rates were 46.40% and 38.51% in SDF, respectively. Total production costs in NSDF were $129,624.43 while it was $461,403.75 in SDF. Total production costs per large animal unit (LAU) were $2,603.06 in NSDF while it was $2,889.10 in SDF. The average unit milk cost was determined as 0.37 $ / Kg and average milk selling price was determined as 0.38 $ / Kg in NSDF. The average unit milk cost was determined as 0.33 $ / Kg and average milk selling price was determined as 0.40 $ / Kg in SDF. When milk support was taken into account, the cost of unit milk in NSDF falls to 0.32 $ / Kg and in SDF to 0.28 $ / Kg. The average gross profit value for NSDF was $719.45 per LAU, while it was $1,397.53 per LAU for SDF. When the average gross profit values per LAU were evaluated, it was seen that dairy farms supported by IPARD program were much more profitable.
Keywords: Dairy Farms. IPARD Program. Economic Analysis. Turkey. 1. Introduction
Custos e @gronegócio on line - v. 15, n. 2, Abr/Jun - 2019. ISSN 1808-2882
www.custoseagronegocioonline.com.br
The agricultural sector, with its economic, social, political and technical aspects, has different characteristics from other sectors and has an indispensable importance. The fact that agricultural products are the main necessities has given them a strategic importance. All the countries in the world are trying to be self-sufficient in basic agricultural products such as grains, sugar, milk, meat and vegetable oil and they direct agricultural policies towards this objective. In our age where the population of World and Turkey increased steadily, agricultural production continues to maintain its importance and value. Agriculture has important functions in the national economy due to its contribution to national income, employment, foreign trade, agriculture and agriculture-based industries as well as meeting the absolute requirements of human nutrition (Arısoy and Oğuz 2005). Agriculture and agriculture's sub-sector livestock farming, whose relative importance in Turkey's economy although reduced, had vital importance for Turkey due to the healthy and balanced nutrition of the society, the development of the livestock-dependent industry, the creation of employment in the short term and with the most efficient investment, supporting the family economy, development of priority regions in agriculture, increasing the profitability in agriculture and ensuring the balance of foreign trade (Bayramoğlu 2003).
In the EU membership process of Turkey, about agriculture and animal husbandry, especially the agricultural population, plant and animal health conditions, business scale, efficiency, organization, support, institutional organization, use of technology, competitiveness, product quality and standards are needed to ensure compliance issues.The European Union (EU) uses the Instrument for Pre-Accession Assistance (IPA) to prepare candidate and potential candidate countries for membership. Main components of the IPA are Transition Assistance and Institution Building, Cross-Border Cooperation, Regional Development, Human Resources Development and Rural Development. The supports provided by the Instrument for Pre-Accession Assistance on Rural Development (IPARD) are providing finance to enable enterprises to achieve production that complies with standards that can compete with enterprises in EU member states. For this purpose, in Turkey IPARD I programme was applied between 2007 and 2013 and IPARD II programme was prepared to apply from 2014 to 2020. IPARD programme has been implementing in 42 provinces by the Ministry of Agriculture and Forestry and Agriculture and Rural Development Support Institution (ARDSI).
Custos e @gronegócio on line - v. 15, n. 2, Abr/Jun - 2019. ISSN 1808-2882
www.custoseagronegocioonline.com.br
Two sectors have been identified as the priority for IPARD program as regards investment in agricultural holdings to restructure and to upgrade to Community standards: Milk and Meat (both red meat and poultry). The objectives of supporting these sectors are to improve agricultural holdings sustainability and overall analysis in the production of primary agricultural products; while at the same time upgrading to the relevant Community standards and generally speaking Good Agricultural Practices; contribute to correct regional rural development imbalances and current depopulation of less developed areas. The specific objective of supporting milk agricultural holdings is to improve the overall analysis of dairy farms and to increase their competitiveness, including marketing competencies (Anonymous 2011, Kaya and Örs 2017). Within the scope of the IPARD I program which prepared for implementation between 2007 and 2013, 1,088 dairy cattle projects with a total support amount of €402,551,554 were supported in 42 cities in which the program was implemented (Anonymous 2018). Konya which had the highest number of cattle (740.148 head) and highest amount of milk production (1.018.917 tonnes) in Turkey according to Turkish Statistical Institute’s data of 2015, was one of the top three provinces, supported by IPARD program.
The purpose of this study was; In Konya, which has an important place in Turkey in milk production, to compare the economic analysis and unit milk costs of NSDF and SDF for determining the impact of the IPARD program on competitiveness.
2. Literature Review
One of the main topics of the agricultural economy is the measurement of the economic analysis of agricultural enterprises. Various economic indicators and financial ratios are used to measure the economic analysis of agricultural holdings. There are various literatures on the calculation of these economic indicators and financial ratios. Within the scope of this study, the literature about the agricultural holdings (Açıl and Demirci 1984, Erkuş, Bülbül et al. 1995, Karagölge 1996, İnan 1999, Acar 2003, Anonymous 2011, Çetin 2013, Çelik 2014, Oğuz and Bayramoğlu 2015) and the literature about measuring the economic analysis of dairy farms (Tranel and Gary 2002, Shoemaker, Eastridge et al. 2008) were used in the calculations.
A lot of studies have been done to measure the economic analysis of dairy farms. when these studies are examined, the main indicators and ratios used to measure the economic
Custos e @gronegócio on line - v. 15, n. 2, Abr/Jun - 2019. ISSN 1808-2882
www.custoseagronegocioonline.com.br
analysis of enterprises are; milk unit cost, production costs, milk yield, profitability, gross production value, agricultural income, gross profit, milk price, return on assets, profit margin and net farm income per cow. (Günlü 1997, Heinrich and Hinrichs 2000, Tauer 2001, Staal 2002, Bayramoğlu 2003, Isermeyer, Hemme et al. 2003, İçöz 2004, Mahmood, Saha et al. 2004, Thorne and Fingleton 2006, Benson 2007, Tümer and Kumbasaroğlu 2008, Tokmak 2009, Hemme and Otte 2010, Donnellan, Hennessy et al. 2011, Özüdoğru and Tatlıdil 2012, Yener 2013, Masuku, Masuku et al. 2014, Mitrovic, Knezevic et al. 2015, Aşkan and Dağdemir 2016, Oğuz and Yener 2017, Yener 2017, Oguz and Yener 2018). In this study, these basic indicators and ratios were used. The studies carried out in the province of Konya which was the research area of this study, were also used in the interpretation of the results (Günlü 1997, Bayramoğlu 2003, Murat 2011, Yener 2013, Oğuz and Yener 2017, Yener 2017, Oguz and Yener 2018). In this study dairy farms supported and non-supported by IPARD program were compared. IPARD I program (Anonymous 2011), IPARD II program (Anonymous 2015) and study of Kaya and Örs (2017) were used as a literature for IPARD.
3. Material and Methods 3.1. Material
As a research area, Konya province was selected according to “judgment sampling method". By the presence of cattle and milk production, Konya is the first province in Turkey. In Konya the cattle number was 740.148 head and milk production was 1.018.917 tons, according to the Turkish Statistical Institute’s (TSI) data of 2015. It is also one of the top three provinces, supported by IPARD program. The main material of the study is dairy farms supported and not supported by the IPARD program in Konya. Dairy farm data’s were obtained through interviews. The interviews were conducted by face to face interview between dates May and November 2017. In addition to these data’s, publications and web pages belonging to the relevant public institutions, previous research findings and published secondary data were used. In this study, $1 = 3.58 Turkish Liras calculated that was the average exchange rate of the dates of the field study was done.
Custos e @gronegócio on line - v. 15, n. 2, Abr/Jun - 2019. ISSN 1808-2882
www.custoseagronegocioonline.com.br
During the study, there were 50 dairy farms supported by IPARD program and operating in Konya. Because the population was small and it was easy to reach the desired information, the full count method was used to determine the SDF. The simple random sampling method was used to determine the NSDF.
According to IPARD program, milking cow number criteria for dairy farms is minimum 10 milking cows and maximum 120 milking cows. In accordance with this criterion; the main frame of NSDF was determined as 4.209 establishments in 16 districts of Konya which had milking cows between 10 to120 head. Neyman method from the stratified sampling method was used in the calculation of sample volume. According to the Neyman method, the equation that determines the sample volume was formulated as follows (Yamane 1967).
In formula; n = sample volume, N = total unit number belonging to the sampling frame, D = d / t, d = derivation from the average, t = standard normal distribution value.
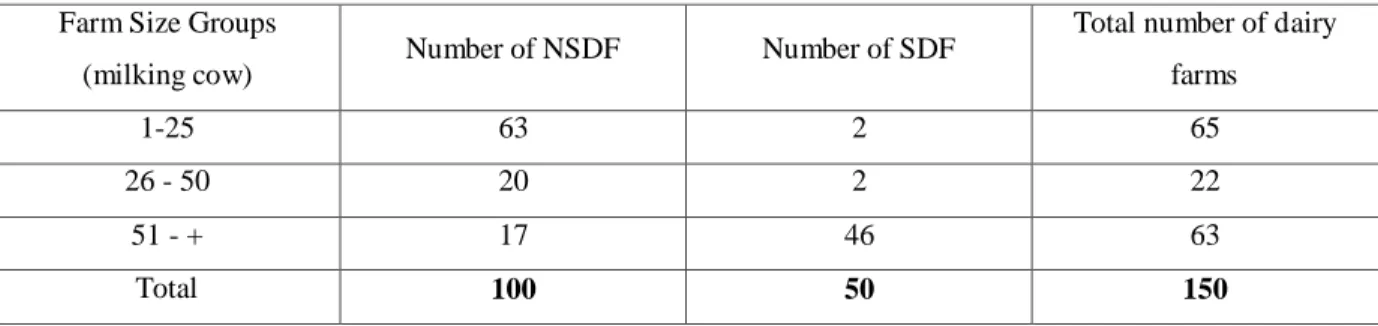
The sample volume was determined by using the number of milking cows. The sample size was calculated as 100 for a confidence interval of 95% and an error margin of 5%. As a result, 150 dairy farms were determined as total sample volume.
Table 1: Distribution of dairy farm numbers by farm size groups (sample size) Farm Size Groups
(milking cow) Number of NSDF Number of SDF
Total number of dairy farms
1-25 63 2 65
26 - 50 20 2 22
51 - + 17 46 63
Total 100 50 150
The sizes of the dairy farms were examined by arranging various strata and 3 strata were considered suitable considering the frequency distributions. These strata were determined as dairy farms which had 10 to 25 head, 26 to 50 head and 51 to 120 head milking cows (Table 1).
Custos e @gronegócio on line - v. 15, n. 2, Abr/Jun - 2019. ISSN 1808-2882
www.custoseagronegocioonline.com.br
Productive Stock Value (PSV) = (year end stock value + value of the sold stock + value of the stock slaughtered) – (value of the stock at the beginning of year + value of the stock bought)
Animal Production Value (APV)= (Milk Production Amount * Milk Price Paid to the Farmer) + Productive Stock Value (PSV) + Animal Manure Income
Plant Production Value (PPV) = Plant Production Value (sold and used product values) + Productive Stock Value (PSV)
Gross Production Value (GPV) = APV + PPV
Total Production Costs (TPC) = Total Variables Costs (TVC) + Total Fixed Costs (TFC)
Gross Profit = GPV – TVC
Agricultural Income = Gross Revenue – (Debit Interests and Rental) + Family Labor Cost
Unit Milk Cost = Milk Production Cost / Milk Production Amount
4. Results and Discussion
4.1. Comparison of economic analysis of dairy farms
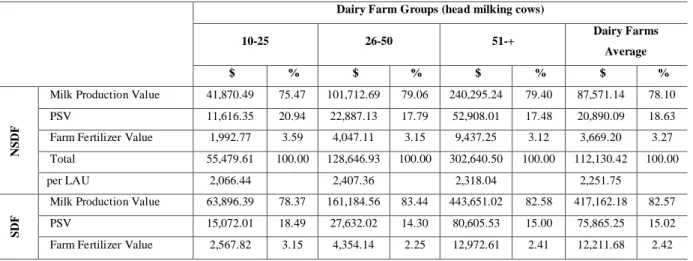
The gross production value is one of the important indicators to measure economic analysis. For the calculation of the gross production value, the animal production value was calculated first and given in Table 2.
Table 2: Animal production values ($) and rates (%).
Dairy Farm Groups (head milking cows)
10-25 26-50 51-+ Dairy Farms Average $ % $ % $ % $ % N S D F
Milk Production Value 41,870.49 75.47 101,712.69 79.06 240,295.24 79.40 87,571.14 78.10 PSV 11,616.35 20.94 22,887.13 17.79 52,908.01 17.48 20,890.09 18.63 Farm Fertilizer Value 1,992.77 3.59 4,047.11 3.15 9,437.25 3.12 3,669.20 3.27 Total 55,479.61 100.00 128,646.93 100.00 302,640.50 100.00 112,130.42 100.00 per LAU 2,066.44 2,407.36 2,318.04 2,251.75
S
D
F
Milk Production Value 63,896.39 78.37 161,184.56 83.44 443,651.02 82.58 417,162.18 82.57 PSV 15,072.01 18.49 27,632.02 14.30 80,605.53 15.00 75,865.25 15.02 Farm Fertilizer Value 2,567.82 3.15 4,354.14 2.25 12,972.61 2.41 12,211.68 2.42
Custos e @gronegócio on line - v. 15, n. 2, Abr/Jun - 2019. ISSN 1808-2882
www.custoseagronegocioonline.com.br
Total 81,536.23 100.00 193,170.72 100.00 537,229.15 100.00 505,239.10 100.00 per LAU 2,300.68 4,164.06 3,159.53 3,163.57
The average value of animal production in NSDF was $112,130.42 per farm and $2,251.75 per LAU while it was $505,239.10 and $3,163.57 in SDF, respectively. Animal production value consisted of 78.10% milk production value, 18.63% PSV and 3.27% farm manure value in NSDF while it was 82.04% milk production value, 15.47% PSV and 2.49% farm manure value in SDF. As the milk yield per milking cow in SDF was higher than in NSDF, the rate of milk production value was higher in animal production value.
Gross production value was calculated by the sum of animal production value and plant production value (Table 3). While the average of gross production value in NSDF was $154,618.59 per farm, it was $624,334.06 in SDF. In NSDF gross production value were $3,104.98 per LAU and $614.98 per decares. In SDF gross production value were $3,909.29 per LAU and $1,171.12 per decares.
Table 3: Gross production value (GPV) ($) and rates (%) in the dairy farms included in the study
Dairy Farm Groups (head milking cows)
10-25 26-50 51-+ Dairy Farms Average $ % $ % $ % $ %
N
S
D
F
Plant Production Value 27,956.18 33.51 53,322.10 29.30 83,596.20 21.64 42,488.17 27.48 Animal Production Value 55,479.61 66.49 128,646.93 70.70 302,640.50 78.36 112,130.42 72.52 Total GPV 83,435.79 100.00 181,969.03 100.00 386,236.70 100.00 154,618.59 100.00 per LAU 3,107.72 3,405.17 2,958.33 3,104.98 per decares 455.00 537.87 962.34 614.98 S D F
Plant Production Value 35,329.91 30.23 58,473.82 23.24 125,372.62 18.92 119,094.96 19.08 Animal Production Value 81,536.23 69.77 193,170.72 76.76 537,229.15 81.08 505,239.10 80.92 Total GPV 116,866.14 100.00 251,644.54 100.00 662,601.77 100.00 624,334.06 100.00 per LAU 3,297.58 5,424.54 3,896.86 3,909.29 per decares 524.06 1,433.87 1,178.71 1,171.12
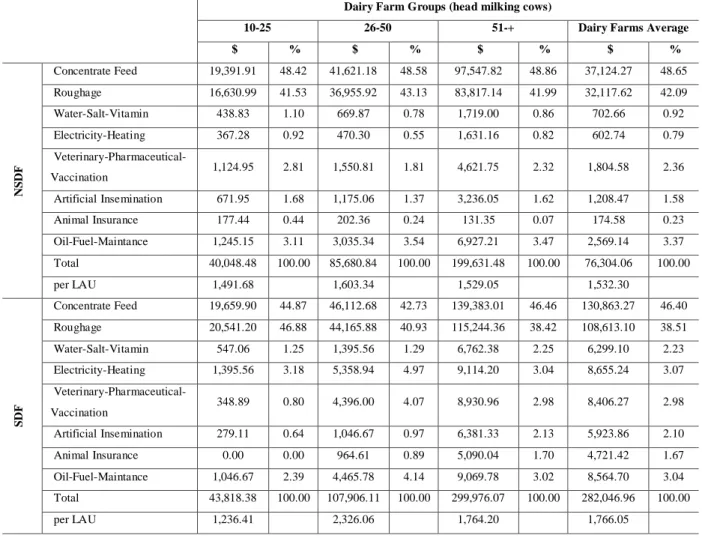
According to Table 3, GPV consisted of %72.52 APV and %27.48 PPV in NSDF while it was %80.92 and %19.08 in SDF, respectively. When the studies in the literature were examined, the distribution of GPV was: %83.11 APV and %16.89 PPV in Oguz and Yener (2018)’s study; %80.43 APV and %19.57 PPV in Yener (2017) ’s study. Animal production variable costs were presented in Table 4 according to dairy farm groups.
Custos e @gronegócio on line - v. 15, n. 2, Abr/Jun - 2019. ISSN 1808-2882
www.custoseagronegocioonline.com.br
Dairy Farm Groups (head milking cows)
10-25 26-50 51-+ Dairy Farms Average $ % $ % $ % $ % N S D F Concentrate Feed 19,391.91 48.42 41,621.18 48.58 97,547.82 48.86 37,124.27 48.65 Roughage 16,630.99 41.53 36,955.92 43.13 83,817.14 41.99 32,117.62 42.09 Water-Salt-Vitamin 438.83 1.10 669.87 0.78 1,719.00 0.86 702.66 0.92 Electricity-Heating 367.28 0.92 470.30 0.55 1,631.16 0.82 602.74 0.79 Veterinary-Pharmaceutical-Vaccination 1,124.95 2.81 1,550.81 1.81 4,621.75 2.32 1,804.58 2.36 Artificial Insemination 671.95 1.68 1,175.06 1.37 3,236.05 1.62 1,208.47 1.58 Animal Insurance 177.44 0.44 202.36 0.24 131.35 0.07 174.58 0.23 Oil-Fuel-Maintance 1,245.15 3.11 3,035.34 3.54 6,927.21 3.47 2,569.14 3.37 Total 40,048.48 100.00 85,680.84 100.00 199,631.48 100.00 76,304.06 100.00 per LAU 1,491.68 1,603.34 1,529.05 1,532.30 S D F Concentrate Feed 19,659.90 44.87 46,112.68 42.73 139,383.01 46.46 130,863.27 46.40 Roughage 20,541.20 46.88 44,165.88 40.93 115,244.36 38.42 108,613.10 38.51 Water-Salt-Vitamin 547.06 1.25 1,395.56 1.29 6,762.38 2.25 6,299.10 2.23 Electricity-Heating 1,395.56 3.18 5,358.94 4.97 9,114.20 3.04 8,655.24 3.07 Veterinary-Pharmaceutical-Vaccination 348.89 0.80 4,396.00 4.07 8,930.96 2.98 8,406.27 2.98 Artificial Insemination 279.11 0.64 1,046.67 0.97 6,381.33 2.13 5,923.86 2.10 Animal Insurance 0.00 0.00 964.61 0.89 5,090.04 1.70 4,721.42 1.67 Oil-Fuel-Maintance 1,046.67 2.39 4,465.78 4.14 9,069.78 3.02 8,564.70 3.04 Total 43,818.38 100.00 107,906.11 100.00 299,976.07 100.00 282,046.96 100.00 per LAU 1,236.41 2,326.06 1,764.20 1,766.05
While the average of animal production variable costs in NSDF was $76,304.06 per farm, it was $282,046.96 in SDF. In NSDF gross production value was $1,532.30 per LAU and close to this value, in SDF gross production value was $1,766.05 per LAU. While 90.74% of the variable costs were concentrated feed and roughage in NSDF, this ratio was 84.91% in SDF. When the studies in the literature were examined, the percentage of concentrated feed and rough feed costs in the variable costs of animal production: In Oguz and Yener (2018)’s study, %83.25; In Yener (2017)’s study, %85.00; In Bayramoğlu (2003)’s study, %81.68; In Aşkan and Dağdemir (2016)’s study %75.63.
Total variable costs were calculated by the sum of animal production variable costs and plant production variable costs (Table 5).
Table 5: Total of the variables costs ($) and rates (%)
Dairy Farm Groups (head milking cows)
10-25 26-50 51-+ Dairy Farms Average $ % $ % $ % $ % NS DF Animal Production 40,048.48 77.63 85,680.84 79.50 199,631.48 85.53 76,304.06 81.41
Custos e @gronegócio on line - v. 15, n. 2, Abr/Jun - 2019. ISSN 1808-2882
www.custoseagronegocioonline.com.br
Variable Costs Plant Production
Variable Costs 11,540.10 22.37 22,089.84 20.50 33,764.49 14.47 17,428.20 18.59 Total Variable Costs 51,588.58 100.00 107,770.68 100.00 233,395.97 100.00 93,732.26 100.00 per LAU 1,921.51 2,016.70 1,787.67 1,882.29 per decares 281.33 318.55 581.52 372.81 S D F Animal Production Variable Costs 43,818.38 78.15 107,906.11 79.72 299,976.07 86.56 282,046.96 86.39 Plant Production Variable Costs 12,250.20 21.85 27,445.71 20.28 46,577.22 13.44 44,438.88 13.61 Total Variable Costs 56,068.58 100.00 135,351.82 100.00 346,553.29 100.00 326,485.84 100.00 per LAU 1,582.07 2,917.69 2,038.13 2,044.30
per decares 251.43 771.24 616.49 612.42
The average of total variable costs in NSDF was $93,732.26 per farm, $1,882.29 per LAU and $372.81 per decares, while it was $326,485.84 per farm, $2,044.30 per LAU and $612.42 per decares in SDF. When the distribution of total variable costs was examined, it consisted of 81.41% animal production costs and 18.59% plant production variable costs in NSDF, while it was 86.39% and 13.61% in SDF, respectively. Even though the distributions of total variable costs were close to each other in both groups, in SDF animal production costs were slightly higher than in NSDF. Fixed costs were presented in Table 6 by dairy farm groups.
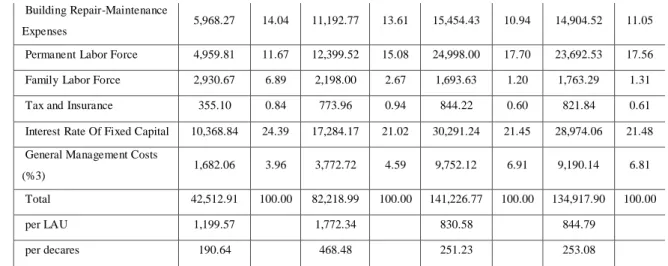
Table 6: Fixed cost ($) and relevant rates (%)
Dairy Farm Groups (head milking cows)
10-25 26-50 51-+ Dairy Farms Average $ % $ % $ % $ % N S D F Depreciation Expenses 7,667.17 31.80 14,882.34 37.04 32,827.65 44.06 13,387.48 37.30 Building Repair-Maintenance Expenses 1,706.63 7.08 2,491.49 6.20 4,423.09 5.94 2,325.40 6.48 Permanent Labor Force 998.55 4.14 4,112.57 10.23 5,666.94 7.61 2,414.98 6.73 Family Labor Force 8,070.19 33.47 7,815.12 19.45 8,409.87 11.29 8,076.92 22.50 Tax and Insurance 0.00 0.00 0.00 0.00 0.00 0.00 0.00 0.00 Interest Rate Of Fixed Capital 4,120.38 17.09 7,649.62 19.04 16,174.40 21.71 6,875.41 19.16 General Management Costs
(%3) 1,547.66 6.42 3,233.12 8.05 7,001.88 9.40 2,811.97 7.83 Total 24,110.59 100.00 40,184.25 100.00 74,503.84 100.00 35,892.17 100.00 per LAU 898.04 751.96 570.65 720.77 per decares 131.48 118.78 185.63 142.76 S D F Depreciation Expenses 16,248.18 38.22 34,597.84 42.08 58,193.14 41.21 55,571.53 41.19
Custos e @gronegócio on line - v. 15, n. 2, Abr/Jun - 2019. ISSN 1808-2882
www.custoseagronegocioonline.com.br
Building Repair-Maintenance
Expenses 5,968.27 14.04 11,192.77 13.61 15,454.43 10.94 14,904.52 11.05 Permanent Labor Force 4,959.81 11.67 12,399.52 15.08 24,998.00 17.70 23,692.53 17.56 Family Labor Force 2,930.67 6.89 2,198.00 2.67 1,693.63 1.20 1,763.29 1.31 Tax and Insurance 355.10 0.84 773.96 0.94 844.22 0.60 821.84 0.61 Interest Rate Of Fixed Capital 10,368.84 24.39 17,284.17 21.02 30,291.24 21.45 28,974.06 21.48 General Management Costs
(%3) 1,682.06 3.96 3,772.72 4.59 9,752.12 6.91 9,190.14 6.81 Total 42,512.91 100.00 82,218.99 100.00 141,226.77 100.00 134,917.90 100.00
per LAU 1,199.57 1,772.34 830.58 844.79
per decares 190.64 468.48 251.23 253.08
Table 6 shows that the average of total fixed costs in NSDF was $35,892.17 per farm, $720.77 per LAU and $142.76 per decares, while it was $134,917.90 per farm, $844.79 per LAU and $253.08 per decares in SDF. The first three fixed costs that were the highest ratio in NSDF were depreciation expenses (37.30%), family labor force (22.50%) and the interest rate of fixed capital (19.16%). The first three fixed costs that were the highest ratio in SDF were depreciation expenses (41.19%), the interest rate of fixed capital (21.48%) and permanent labor force (17.56%). In addition to the interest rate of fixed capital and depreciation expenses, one of the three fixed cost in NSDF was family labor force cost, while in SDF it was permanent labor force cost. This was due to the fact that almost all of the NSDF were family dairy farms, while the SDF were professional dairy farms. Total production costs were given in Table 7 by dairy farm groups.
Table 7: Total production costs ($) and relevant rates (%) in the research area
Dairy Farm Groups (head milking cows)
10-25 26-50 51-+ Dairy Farms Average $ % $ % $ % $ % N S D F Variables Costs 51,588.58 68.15 107,770.68 72.84 233,395.97 75.80 93,732.26 72.31 Fixed Costs 24,110.59 31.85 40,184.25 27.16 74,503.84 24.20 35,892.17 27.69 Total Production Costs 75,699.17 100.00 147,954.93 100.00 307,899.81 100.00 129,624.43 100.00 per LAU 2,819.55 2,768.67 2,358.32 2,603.06
per decares 412.81 437.33 767.15 515.57
Rate to Active Capital (%) 19.47 20.85 24.80 21.68
S
D
F
Variables Costs 56,068.58 56.88 135,351.82 62.21 346,553.29 71.05 326,485.84 70.76 Fixed Costs 42,512.91 43.12 82,218.99 37.79 141,226.77 28.95 134,917.90 29.24 Total Production Costs 98,581.49 100.00 217,570.81 100.00 487,780.06 100.00 461,403.75 100.00 per LAU 2,781.64 4,690.04 2,868.71 2,889.10 per decares 442.07 1,239.72 867.72 865.49
Custos e @gronegócio on line - v. 15, n. 2, Abr/Jun - 2019. ISSN 1808-2882
www.custoseagronegocioonline.com.br
Rate to Active Capital (%) 11.45 20.07 20.53 20.39
The average of total production costs in NSDF was $129,624.43 per farm, $2,603.06 per LAU and $515.57 per decares, while it was $461,403.75 per farm, $2,889.10 per LAU and $865.49per decares in SDF. Although the average total production costs in NSDF was almost 4 times higher than in SDF, there was not much difference between the average total production costs per LAU and per decares. The average total production cost in SDF was slightly higher when compared with it in NSDF.
Total production cost consisted of %72 variable costs and %28 fixed costs in NSDF, against %71 and %29 in SDF. When the studies in the literature were examined, total production cost consisted of: %70.69 variable costs and %29.31 fixed costs in Oguz and Yener (2018)’s study; %69.68 variable costs and %30.32 fixed costs in Yener (2017) ’s study; %50.60 variable costs and %49.40 fixed costs in Bayramoğlu (2003)’s study. When the rate of the total production costs to active capital was examined, it was 21.68% in NSDF while it was 20.39% in SDF. The rate of the total production costs of the two groups to the active capital was close to each other.
Gross profit was calculated by the subtraction of total variable costs from gross production value (Table 8).
Table 8: Gross profit ($) and relevant rates (%).
Dairy Farm Groups (head milking cows)
10-25 26-50 51-+ Dairy Farms Average $ % $ % $ % $ % N S D F GPV 83,435.79 100.00 181,969.03 100.00 386,236.70 100.00 154,618.59 100.00 Total Variable Costs 51,588.58 61.83 107,770.68 59.22 233,395.97 60.43 93,732.26 60.62 Gross Profit 31,847.20 38.17 74,198.34 40.78 152,840.73 39.57 60,886.33 39.38 per LAU 1,186.21 1,388.47 1,170.67 1,222.69 per Decares 173.67 219.32 380.81 242.17 S D F GPV 116,866.14 100.00 251,644.54 100.00 662,601.77 100.00 624,334.06 100.00 Total Variable Costs 56,068.58 47.98 135,351.82 53.79 346,553.29 52.30 326,485.84 52.29 Gross Profit 60,797.56 52.02 116,292.72 46.21 316,048.48 47.70 297,848.21 47.71 per LAU 1,715.51 2,506.85 1,858.73 1,864.99
per Decares 272.63 662.64 562.22 558.70
The average of gross profit in NSDF was $60,886.33 per farm, $1,222.69 per LAU and $242.17 per decares, while it was $297,848.21 per farm, $1,864.99 per LAU and $558.70 per decares in SDF. The average of gross profit per LAU and per decares was higher in SDF
Custos e @gronegócio on line - v. 15, n. 2, Abr/Jun - 2019. ISSN 1808-2882
www.custoseagronegocioonline.com.br
and this was an indicator that they were more competitive and more successful in terms of business organization.
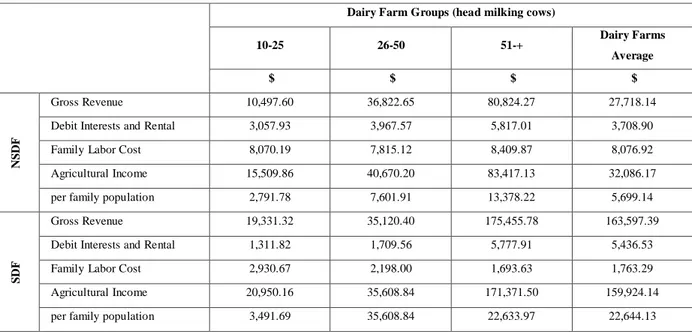
Table 9: Agricultural Income ($)
Dairy Farm Groups (head milking cows)
10-25 26-50 51-+ Dairy Farms Average $ $ $ $ N S D F Gross Revenue 10,497.60 36,822.65 80,824.27 27,718.14 Debit Interests and Rental 3,057.93 3,967.57 5,817.01 3,708.90 Family Labor Cost 8,070.19 7,815.12 8,409.87 8,076.92 Agricultural Income 15,509.86 40,670.20 83,417.13 32,086.17 per family population 2,791.78 7,601.91 13,378.22 5,699.14
S
D
F
Gross Revenue 19,331.32 35,120.40 175,455.78 163,597.39 Debit Interests and Rental 1,311.82 1,709.56 5,777.91 5,436.53 Family Labor Cost 2,930.67 2,198.00 1,693.63 1,763.29 Agricultural Income 20,950.16 35,608.84 171,371.50 159,924.14 per family population 3,491.69 35,608.84 22,633.97 22,644.13
When Table 9 was examined, the average of agricultural income wa s $32,086.17 in NSDF while it was $159,924.14 in SDF. The average of agricultural income per family population was $5,699.14 in NSDF and it was $22,644.13 in SDF. Milk production costs were presented in Table 10 as the sum of animal production variable costs and fixed costs.
Table 10: Milk production costs ($) and rates (%).
Dairy Farm Groups (head milking cows)
10-25 26-50 51-+ Dairy Farms Average $ % $ % $ % $ % N S D F Animal Production Variable Costs 40,048.48 62.42 85,680.84 68.07 199,631.48 72.82 76,304.06 68.01 Fixed Costs 24,110.59 37.58 40,184.25 31.93 74,503.84 27.18 35,892.17 31.99 Total Milk Production
Costs 64,159.07 100.00 125,865.09 100.00 274,135.32 100.00 112,196.24 100.00 S D F Animal Production Variable Costs 43,818.38 50.76 107,906.11 56.76 299,976.07 67.99 282,046.96 67.64 Fixed Costs 42,512.91 49.24 82,218.99 43.24 141,226.77 32.01 134,917.90 32.36 Total Milk Production
Custos e @gronegócio on line - v. 15, n. 2, Abr/Jun - 2019. ISSN 1808-2882
www.custoseagronegocioonline.com.br
The average of milk production costs in NSDF was $112,196.24 and it was $416,964.87 in SDF. When the distribution of milk production costs was examined, it consisted of 68.01% animal production variable costs and 31.99% fixed costs in NSDF, while it was 67.64% and 32.36% in SDF, respectively. The animal production value and its proportional distribution were presented in Table 11 in order to distribute the production costs to each product in proportion to the dairy farming gross production value.
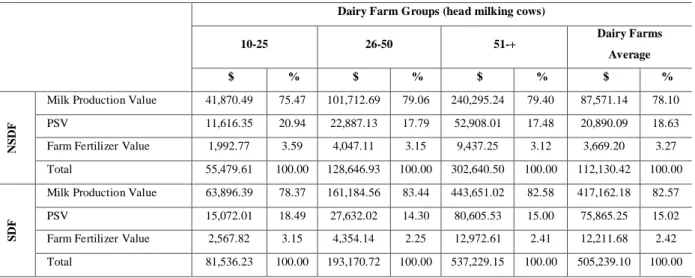
Table 11: Dairy farming gross production value ($) and rates (%).
Dairy Farm Groups (head milking cows)
10-25 26-50 51-+ Dairy Farms Average $ % $ % $ % $ % N S D F
Milk Production Value 41,870.49 75.47 101,712.69 79.06 240,295.24 79.40 87,571.14 78.10 PSV 11,616.35 20.94 22,887.13 17.79 52,908.01 17.48 20,890.09 18.63 Farm Fertilizer Value 1,992.77 3.59 4,047.11 3.15 9,437.25 3.12 3,669.20 3.27 Total 55,479.61 100.00 128,646.93 100.00 302,640.50 100.00 112,130.42 100.00
S
D
F
Milk Production Value 63,896.39 78.37 161,184.56 83.44 443,651.02 82.58 417,162.18 82.57 PSV 15,072.01 18.49 27,632.02 14.30 80,605.53 15.00 75,865.25 15.02 Farm Fertilizer Value 2,567.82 3.15 4,354.14 2.25 12,972.61 2.41 12,211.68 2.42 Total 81,536.23 100.00 193,170.72 100.00 537,229.15 100.00 505,239.10 100.00
The average of dairy farming gross production value in NSDF was $112,130.42 it was $505,239.10 in SDF. When the distribution of dairy farming gross production values was examined, it consisted of 78.10% milk production value, 18.63% PSV and 3.27% farm fertilizer value in NSDF, while it was 82.57%, 15.02% and 2.42% in SDF, respectively.
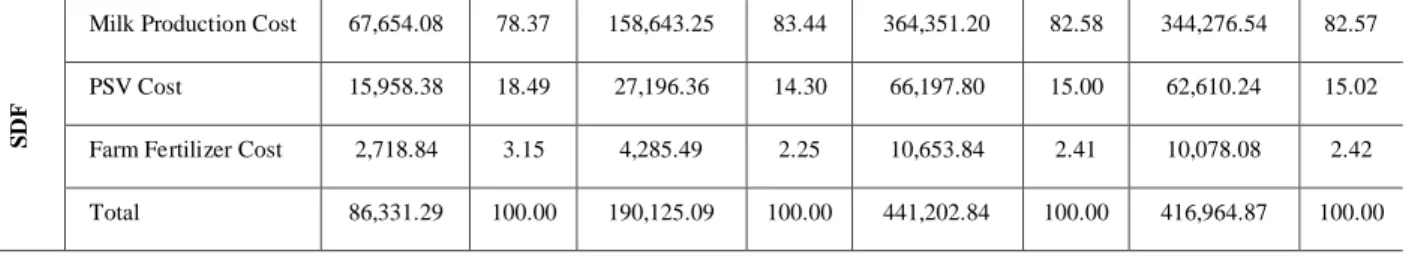
In order to calculate the milk cost according to the relative sales method, the distribution of the production costs according to products obtained was presented in Table 12.
Table 12: Distribution of the production costs according to products obtained ($) and rates (%)
Dairy Farm Groups (head milking cows)
10-25 26-50 51-+ Dairy Farms Average $ % $ % $ % $ %
N
S
D
F
Milk Production Cost 48,420.89 75.47 99,513.27 79.06 217,662.25 79.40 87,622.54 78.10 PSV Cost 13,433.66 20.94 22,392.22 17.79 47,924.70 17.48 20,902.35 18.63 Farm Fertilizer Cost 2,304.52 3.59 3,959.60 3.15 8,548.37 3.12 3,671.35 3.27 Total 64,159.07 100.00 125,865.09 100.00 274,135.32 100.00 112,196.24 100.00
Custos e @gronegócio on line - v. 15, n. 2, Abr/Jun - 2019. ISSN 1808-2882
www.custoseagronegocioonline.com.br
S
D
F
Milk Production Cost 67,654.08 78.37 158,643.25 83.44 364,351.20 82.58 344,276.54 82.57 PSV Cost 15,958.38 18.49 27,196.36 14.30 66,197.80 15.00 62,610.24 15.02 Farm Fertilizer Cost 2,718.84 3.15 4,285.49 2.25 10,653.84 2.41 10,078.08 2.42 Total 86,331.29 100.00 190,125.09 100.00 441,202.84 100.00 416,964.87 100.00
According to Table 12, the average of milk production cost in NSDF was $87,622.54 while it was $344,276.54 in SDF. The unit milk cost was obtained by dividing the milk production costs to the milk production amounts (Table 13). In this respect, the average unit milk cost was computed as $0.37 per kg and milk sales price was $0.38 per kg in NSDF. In SDF, the average unit milk cost was computed as $0.33 per kg and milk sales price was $0.40 per kg. In NSDF, the difference between the unit milk cost and milk sales price was $ 0.01 per kg, while the difference in SDF was $ 0.07 per kg.
When milk support was taken into account, the average unit milk cost was falling to $0.32 per kg in NSDF and $0.28 per kg in SDF. By milk support, the difference between the unit milk cost and milk sales price became $ 0.06 per kg in NSDF whilethe difference in SDF became $ 0.12 per kg.
Table 13: Unit milk cost ($/kg).
Dairy Farm Groups (head milking cows)
10-25 26-50 51-+ Dairy Farms Average $ $ $ $ N S D F
Milk Production Cost ($) 48,420.89 99,513.27 217,662.25 87,622.54
Milk Production Amount (Kg) 113,712.40 274,191.04 644,310.88 236,009.87
Unit Milk Cost ($/Kg) 0.43 0.36 0.34 0.37
Milk Sales Price ($/Kg) 0.38 0.37 0.37 0.38
Variable Costs per Unit
Production ($/Kg) 0.35 0.31 0.31 0.32
Unit Milk Cost by Milk
Support ($/Kg) 0.38 0.31 0.29 0.32
S
D
F
Milk Production Cost ($) 67,654.08 158,643.25 364,351.20 344,276.54
Custos e @gronegócio on line - v. 15, n. 2, Abr/Jun - 2019. ISSN 1808-2882
www.custoseagronegocioonline.com.br
Unit Milk Cost ($/Kg) 0.41 0.39 0.33 0.33
Milk Sales Price ($/Kg) 0.39 0.40 0.40 0.40
Variable Costs per Unit
Production ($/Kg) 0.27 0.27 0.27 0.27
Unit Milk Cost by Milk
Support ($/Kg) 0.36 0.32 0.28 0.28
Dairy farming gross profit was calculated by the subtraction of total animal production variable costs from dairy farming gross production value (milk production value, PSV value, farm fertilizer value) and presented in Table 14.
The average of dairy farming gross profit in NSDF was $35,826.36 per farm and $719.45 per LAU, while it was $223,192.13 per farm and $1,397.53 in SDF. When the dairy farming gross profit values per LAU were evaluated, it was seen that the NSDF were much more profitable.
Table 14: Dairy farming gross profit ($)
Dairy Farm Groups (head milking cows)
10-25 26-50 51-+ Dairy Farms Average
$ $ $ $ N S D F Dairy farming GPV 55,479.61 128,646.93 302,640.50 112,130.42 Animal Production Variable Costs 40,048.48 85,680.84 199,631.48 76,304.06 Dairy farming Gross
Profit 15,431.12 42,966.09 103,009.02 35,826.36 per LAU 574.76 804.02 788.99 719.45 S D F Dairy farming GPV 81,536.23 193,170.72 537,229.15 505,239.10 Animal Production Variable Costs 43,818.38 107,906.11 299,976.07 282,046.96 Dairy farming Gross
Profit 37,717.85 85,264.61 237,253.08 223,192.13
per LAU 1,064.27 1,838.00 1,395.32 1,397.53
Custos e @gronegócio on line - v. 15, n. 2, Abr/Jun - 2019. ISSN 1808-2882
www.custoseagronegocioonline.com.br
When the economic analysis of NSDF and SDF were compared; it seems that animal production value and gross production value of SDF was four times higher than NSDF. However, the difference between the two groups was not high when the value of animal production per LAU and GPV per LAU was observed. The average of animal production value was $2,251.75 per LAU and the average of gross production value was $3,104.98 per LAU in NSDF, while it was $3,163.57 and $3,909.29 in SDF, respectively. The value of animal production per LAU and GPV per LAU was a little higher in SDF. In NSDF, the first three costs with the highest ratio in the animal production variable costs were concentrated feed (%31.66), roughage (%27.37) and oil - fuel - maintenance (%2.53) costs while in SDF, the first three costs were concentrated feed (%30.81), roughage (%25.86) and electricity-heating (%2.53) costs. While 90.74% of the variable costs were concentrated feed and roughage in NSDF, this ratio was 84.91% in SDF. When the distribution of fixed costs was examined; The first three fixed costs that were the highest ratio in NSDF were depreciation expenses (37.30%), family labor force (22.50%) and the interest rate of fixed capital (19.16%). The first three fixed costs that were the highest ratio in SDF were depreciation expenses (41.19%), the interest rate of fixed capital (21.48%) and permanent labor force (17.56%). In addition to the interest rate of fixed capital and depreciation expenses, one of the three fixed cost in NSDF was family labor force cost, while in SDF it was permanent labor force cost. This was due to the fact that almost all of the NSDF were family dairy farms, while the SDF were professional dairy farms. The average unit milk cost was computed as $0.37 per kg and milk sales price was $0.38 per kg in NSDF. In SDF, the average unit milk cost was computed as $0.33 per kg and milk sales price was $0.40 per kg. In NSDF, the difference between the unit milk cost and milk sales price was $ 0.01 per kg, while the difference in SDF was $ 0.07 per kg. When milk support was taken into account, the average unit milk cost was falling to $0.32 per kg in NSDF and $0.28 per kg in SDF. By milk support, the difference between the unit milk cost and milk sales price became $ 0.06 per kg in NSDF while the difference in SDF became $ 0.12 per kg. Considering milk support, per kg of milk, SDF earned 6 cents more than NSDF. In both cases before and after support, the gain they derived from a unit of milk in SDF was higher than that in NSDF.
The average of gross profit in NSDF was $60,886.33 per farm, $1,222.69 per LAU and $242.17 per decares, while it was $297,848.21 per farm, $1,864.99 per LAU and $558.70 per decares in SDF. The average of gross profit per LAU and per decares was higher in SDF. In terms of agriculture income, the average of agricultural income per family population was
Custos e @gronegócio on line - v. 15, n. 2, Abr/Jun - 2019. ISSN 1808-2882
www.custoseagronegocioonline.com.br
$5,699.14 in NSDF and it was $22,644.13 in SDF. In terms of GPV, unit milk cost, gross profit value and agricultural income; it was clear that the economic analysis of SDF was more successful than that of NSDF. This was an indication that the SDF was more competitive and more successful in terms of business organization. The economic and financial results obtained in this paper show that supports were given by IPARD program make dairy farms more competitive and more successful in terms of economic analysis and business organization. When considering the dairy farm groups which were generated according to the number of milking cows, as the number of milking cows increased; animal production value, GPV, gross profit and agricultural income increased. However, considering the values per LAU; dairy farm group which had milking cows between 26 and 50 head, got the highest animal production value, GPV and gross profit. This was an indicator that dairy farm group which had milking cows between 26 and 50 head, became more successful in economic analysis than other dairy farm groups.
6. References
ACAR, M. Tarımsal işletmelerde finansal performans analizi. Journal Of Faculty Of Economics And Administrative Sciences, V. 20, p. 21-37, ISSN 1301-3688, 2003.
AÇIL, A. F., DEMIRCI, R. Agricultural economics courses, p. 880, 1984.
ANONYMOUS. Financial guidelines for agricultural producers, F. F. S. Council, Connecticut, U.S.A., 2011.
ANONYMOUS. The Instrument for Pre-accession Assistance-Rural Development (IPARD) program (2007-2013), Republic of Turkey Ministry of Agriculture and Forestry Publications, Ankara, 2011.
ANONYMOUS. The Instrument for Pre-accession Assistance-Rural Development (IPARD) program (2014-2020), Republic of Turkey Ministry of Agriculture and Forestry Publications, Ankara, 2015.
ANONYMOUS. The IPARD Programme statistics, 2018.
Custos e @gronegócio on line - v. 15, n. 2, Abr/Jun - 2019. ISSN 1808-2882
www.custoseagronegocioonline.com.br
ARISOY, H., OĞUZ, C. Tarımsal Araştırma Enstitüleri tarafından yeni geliştirilen buğday çeşitlerinin tarım işletmelerinde kullanım düzeyi ve geleneksel çeşitler ile karşılaştırmalı ekonomik analizi -Konya ili örneği-, Agricultural Economic and Policy Development Institute, Publication no: 130, Ankara, ISBN:975-407-148-9, 2005.
AŞKAN, E., DAĞDEMIR, V. TRA1 Düzey 2 bölgesinde destek ve teşvik alan süt sığırcılığı işletmelerinde süt üretim maliyeti ve karlılık durumu, The Journal of Agricultural Economics
Researches, V. 1, p. 1-12, ISSN 2149-3928, 2016.
BAYRAMOĞLU, Z. Konya ilinde süt sığırcılığı projesi (100 x 2) kapsamında yer alan işletmelerin ekonomik analizi, Master Thesis, Graduate School of Natural and Applied Sciences, Selçuk University, Konya, 2003.
BENSON, G. Competitiveness of NC dairy farms, Department of Agricultural & Resource Economics, North Carolina State University, 2007.
ÇELIK, Y. Calculation Methods of Agricultural Costs and Income by Different Accounting Systems in Turkey, Turkish Journal of Agricultural Economics, V. 20, n. 1, p. 41-52, ISSN 1303-0183, 2014.
ÇETIN, B. Uygulamalı tarim ekonomisi, Nobel Akademik Yayıncılık, Ankara, ISBN: 9786051335476, 2013.
DONNELLAN, T., HENNESSY, T., KEANE, M., THORNE, F. Study of the international competitiveness of the Irish dairy sector at farm level, Rural Economy Research Centre Teagasc, 2011.
ERKUŞ, A., BÜLBÜL, M., KIRAL, T., AÇIL, A., DEMIRCI, R. Tarım ekonomisi, Ankara University Faculty of Agriculture, Research and Development Foundation Publications, V. 5, p. 298, 1995.
GÜNLÜ, A. Konya ili süt sığırcılık işletmelerinde karlılık ve verimlilik analizleri ile işletmelerin üretim ve pazarlama sorunları, Ph.D. Thesis, Graduate School of Health Sciences, Ankara University, 1997.
HEINRICH, I., HINRICHS, P. Inter-regional competitiveness–a cross-country comparison of dairy farming. Research Consortium Sustainable Animal Production, Virtual Conference, Germany, 2000.
Custos e @gronegócio on line - v. 15, n. 2, Abr/Jun - 2019. ISSN 1808-2882
www.custoseagronegocioonline.com.br
HEMME, T., OTTE, J. Status and prospects for smallholder milk production: a global perspective, Food and Agriculture Organization of the United Nations (FAO), 2010.
İÇÖZ, Y. Bursa ili süt sığırcılık işletmelerinde karlılık ve verimlilik analizi, Agricultural Economic and Policy Development Institute, Publication no: 116, Ankara, ISBN:975 -407-148-9, 2004.
İNAN, İ. H. Tarım ekonomisi ders kitabi, Ankara University Faculty of Agriculture, 1999. ISERMEYER, F., HEMME, T. VE HOLZNER, J. Analysis of international competitiveness of milk production in the framework of the IFCN, Agric. Econ. – Czech, V. 49, n. 2, p. 94-100, ISSN 1805-9295, 2003.
KARAGÖLGE, C.Tarımsal İşletmecilik, Atatürk University Publications. Publication no. 427, 1996.
KAYA, E., ÖRS, A. Comparison Of IPARD I and IPARD II Programmes as a source of rural development financing in Turkey. The 4th International Conference On Sustainable agriculture and Environment, Surakarta, Indonesia, 2017.
MAHMOOD, K., SAHA, A., GRACIA, O., HEMME, T. International competitiveness of small scale dairy farms in India/Pakistan, Conference on Rural Poverty Reduction through Research for development and Transformation, Humboldt University, Berlin, 2004.
MASUKU, B., MASUKU, M., BELETE, A., Economic efficiency of smallholder dairy farmers in Swaziland: An application of the profit function, Journal of Agricultural Studies V.2, n. 2, p. 132-146, ISSN:2166-0379, 2014.
MITROVIC, A., KNEZEVIC, S., VELICKOVIC, M. Ratio analysis specifics of the family dairies' financial statements, Ekonomika poljoprivrede, V. 62, n. 4, p. 1061, ISSN:0352-3462, 2015.
MURAT, H. Ege ve Orta Anadolu Bölgesi Damızlık Sığır Yetiştiricileri Birliğine bağli süt siğircilik işletmelerinin ekonomik analizi, Ph.D. Thesis, Graduate School of Health Sciences, Ankara University, 2011.
Custos e @gronegócio on line - v. 15, n. 2, Abr/Jun - 2019. ISSN 1808-2882
www.custoseagronegocioonline.com.br
OGUZ, C., YENER, A. Productivity analysis of dairy cattle farms in Turkey: case study of Konya Province, Custos e @gronegocio On Line, V. 14, n. 1, p. 298-319, ISSN:1808-2882, 2018.
OĞUZ, C., BAYRAMOĞLU, Z. Tarım Ekonomisi, Atlas Kitapevi, Second Edition, 2015. OGUZ, C., YENER, A. Economic analysis of dairy cattle enterprises: the case of Konya province, European Countryside, V. 9, n. 2, p. 263-273, ISSN: 1803-8417, 2017.
ÖZÜDOĞRU, T., TATLIDIL, F. F. Amasya Damızlık Sığır Yetiştiricileri Birliğine Üye olan ve olmayan işletmelerin ekonomik analizi ve süt sığırcılığına yönelik desteklerin gelire etkisi, Selçuk University, Journal of Agricultural Sciences, V.26, n. 3, p. 42-49, ISSN: 1309-0550, 2012.
SHOEMAKER, D., EASTRIDGE, M., BREECE, D., WOODRUFF, J., RADER, D., MARRISON, D. Measures of Dairy Farm Competitiveness, The Ohio State University, U.S.A., 2008.
STAAL, S. The competitiveness of smallholder dairy production: Evidence from sub-Sahara Africa, Asia and Latin America. Smallholder dairy production and marketing-Opportunities and constraints, Proceedings of a South–South workshop, 2002.
TAUER, L. W. Efficiency and competitiveness of the small New York dairy farm, Journal of dairy science, V. 84, n. 11, p. 2573-2576, ISSN:0022-0302, 2001.
THORNE, F., FINGLETON, W. Examining the relative competitiveness of milk production: An Irish case study (1996–2004), Journal of International Farm Management, V. 3, n. 4, p. 49-61, ISSN: 1816-2495, 2006.
TOKMAK, T. Niğde ilinde süt siğirciliği işletmelerinin ekonomik analizi ve sütün pazara arzi, Master Thesis, Niğde Ömer Halisdemir University, Graduate School Of Social Sciences, 2009.
TRANEL, L. F., GARY, F. Managing dairy farm finances, Iowa State University Extension Publication, 2002.
Custos e @gronegócio on line - v. 15, n. 2, Abr/Jun - 2019. ISSN 1808-2882
www.custoseagronegocioonline.com.br
TÜMER, E. İ., KUMBASAROĞLU, H. Tokat ili Turhal ilçesinde hayvan sigortasi yaptiran ve yaptirmayan işletmelerde inek sütü maliyetlerinin hesaplanmasi, Atatürk University, Journal of the Faculty of Agriculture, V. 39, n. 2, p. 187-194, ISSN: 1300-9036, 2008. YAMANE, T. Elementary sampling theory prentice inc, Englewood Cliffs, NS, USA, p. 371-390, 1967.
YENER, A. Konya ili Ereğli ilçesi süt işletmelerinin ekonomik faaliyetleri ve yenilikleri benimseme düzeyleri, Master Thesis, Graduate School of Natural and Applied Sciences, Selçuk University, Konya, 2013.
Yener, A. Konya ilinde süt sığırcılığı yapan aile işletmelerinde yeniliklerin benimsenmesi ve yayılmasına etki eden faktörler, Ph.D. Thesis, Graduate School of Natural and Applied Sciences, Selçuk University, Konya, 2017.
Acknowledgement
This article has been prepared by using the Ph.D. dissertation entitled "Impact of IPARD Program on Competitiveness of Dairy Farms in Konya" and This study was supported the TUBİTAK project numbered 116K697. At the same time Selcuk University, Scientific Research Fund (BAP) Project No: 17401049. We would like to thank TUBİTAK and Selcuk University Scientific Research and Projects Coordination Unit for their financial support to this project.