Renewed Evidence of Environmental Sustainability from Globalization and
Energy consumption over Economic growth in China
Festus Victor Bekun1
Faculty of Economics Administrative and Social sciences, Istanbul Gelisim University, Istanbul, Turkey Corresponding author: Email: [email protected]
Kürşat Yalçiner
Faculty of Economics, Administrative and Social Sciences, Istanbul Gelisim University, Istanbul, Turkey
Email: [email protected]
Mfonobong Udom Etokakpan Department of Economics, Famagusta,
Eastern Mediterranean University, North Cyprus, via Mersin 10, Turkey Email: [email protected]
Andrew Adewale Alola
Faculty of Economics Administrative and Social sciences, Istanbul Gelisim University, Istanbul, Turkey.
E-mail: [email protected]
Abstract
This study is primarily motivated by exploring the role of globalization, energy intensity over economic expansion and it impact on environmental sustainability in China. To this end, sequence of econometrics tests were conducted to address this hypothesized concern. The choice of China is informed by intense industrial activities and being one of the leading world economies. Annual frequency data from 1971-2015 is utilized for the current study. Stationarity properties of the variables under investigation namely globalization index, ecological footprint, energy consumption and real gross domestic product is examined using the conventional unit tests of Augmented Dickey Fuller (ADF) unit root and Philips-Perron (PP) unit test complemented by the Zivot-Andrews unit root that accounts for single structural break. For cointegration analysis, the novel and unique Bayer and Hanck (2013) combined cointegration test in conjunction with
1 Corresponding author: Festus Victor Bekun Email: [email protected]
Pesaran’s Autoregressive Distributed Lag (ARDL) methodology as robustness check is employed while Granger causality test is utilized to detect the direction of causality among the variables. Empirical finding from Bayer and Hanck supports cointegration equilibrium relationship among the variables under review. This indicate a convergence between the explanatory variable to the explained variable in the fitted model. Further empirical evidence shows a positive statistically significant relationship between the variables real income, ecological footprint and globalization index. This outcome is insightful for environmental economist and policymakers. The causality analysis presents supports the growth induced energy consumption hypothesis. Based on these revelations policy direction for the energy sector in China in the face of global interconnectedness are offered in the concluding remark of this study.
Keywords: Energy intensity, globalization, energy conservation, pollutant emission, China.
1. Introduction
The Republic of China (3 5 00 N, 105 00 E) like other advanced states have continued to pioneer
and drive the awareness for environmental sustainability amidst the drive for competitive
economic strength and advantage. With a population of over 1.3 billion people (estimated at
1,384 ,688,986 in 201 8) and total area of 9,596,960 square kilometers (comprisin g o f
9,326 ,410 square kilometers o f land and 270,550 square kilometers), China’s climatic
co ndition is bein g described as extremely diverse and tro pical from South subarctic
in the North (C entral Intelligence Agen cy, CIA, 2019). The global effect o f climate
ch ange and human activities has neither sp ared the country’s natu ral resources (such
as coal, iron ore deposits, e.t.c) nor its n atu ral terrain s (high plateau s, western plains,
e.tc.), thus pos in g a p ersistent threat to its agricu ltural land, arab le land, forest , and
The seemingly threat to the national ecological fo otp rint of Ch ina is attrib uted to the
co untry’s carbon emissions tre nd. In recent time, China is n oted with the h ighest
emission o f 9232.6 million tons of carbon dioxide (CO2) (Alola, 2019 a&b). Also, with the global
increase in the CO2 emission from 29, 714.2 million tons to 33, 444.0 million tons between 2009
and 2017 (British Petroleum, BP, 2018), the world environmental and intergovernmental agencies
have continued to urge more commitment of stakeholders to the 2015 Paris Agreement2. The fact
that a global economic race exists especially among the leading economies make it a daunting
challenge to averting the global environmental disaster such as the global warming. For instance,
the unprecedented growth of the Chinese economy in the last decades has not happen without
environmental imbalances. Since the China shifted to a more market-based economy, it has
continued to experience about 10% in average annual Gross Domestic Product (GDP) growth, thus
making it the fasted sustained economic expansion of a major economy (The World Bank, 2019).
Interestingly, the World Bank indicated that China was able to make significant contribution to
the global Millennium Development Goals (MDGs) achievements after achieving it national
MDGs target in 2015. Although induced energy consumption has been arguably attributed to the
source of economic expansion and environmental concern in the past decades, the recent trend in
(market) globalization is gradually becoming a source for both paradigm concerns.
In the wake of global trade dichotomy, the pros and cons of the global integration of markets and
societies has further been put forward by the lingering trade rows, financial settlement disputes,
economic and political fragmentations between countries of the world. Notwithstanding,
globalization has availed countries to export good and service with comparative advantage, thus
2The Paris Agreement is the United Nations Framework Convention on Climate Change [38] of 2015. More details
relating to the Paris Agreement of 2015 are available at: https://unfccc.int/process/conferences/pastconferences/ paris-climate-change-conference-november-2015/ Paris-agreement.
earning significantly from trade as a result of specialization. A shred of evidence provided by the
Global Economic Dynamics (2019) posits that countries significantly earns from growing
integration in the world economy since 1990, thus suggesting that globalization have positive
impact on the GDP of both the advanced and emerging economies. Adding to the complexity of
the integration of the world market is the increasing competitiveness and uncertainty associated
with the leading markets such as the oil market. For instance, in spite of the uncertainty in the oil
market, the World Energy Outlook 2018 implies that energy demand is predicted to grow by over
25% in 2040, thus suggesting more investment opportunities (International Energy Agency, IEA,
2018). Therefore, as much as there is drive for global integration of market amidst global energy
demand (consumption), this is expected to have persistent demand on the earth’s cropland, grazing
land, fishing grounds, built-up land, forest area, and carbon demand capacities (EFP accounting).
In light of the above motivations and considering the peculiarity of China because of the
continuous and historic shift in the geography of energy consumption to Asia, the current study
considers the underpinning of the role of globalization and energy consumption on the
environmental sustainability of China. While employing the experimental period of 1971 – 2014,
the objective of the study is set at hypothesizing that (1) the globalization led growth have
significant impact on the ecological footprint vis-a-vis environmental sustainability, (2) induced
energy consumption affects the country’s environmental sustainability, and (3) there is dynamic
and causal nexus of between the concern factors. Importantly, the current study is designed to
significantly contribute to the existing literature because the ecological footprint accounting is
employed as the dependent variable in lieu of carbon or Greenhouse gas emissions.In summary,
this study complements the existing literature by the adoption of a broader measure of
energy-environment literature. This present study seek to bridge and fill this identified void for vast/robust
debate in the energy-environment literature. This is an innovation and distinction into the related
literature. Ecological footprint stands out given it broader ingredients and qualities that consist of
its ability to account for natural essentials and economic expansion (Bello et al.,2018). The natural
areas accounted for includes availability of water resource, fresh water and availability of arable
farmland, forest reserves and fresh air. Theses aforementioned constituents have ability to support
life and ecosystem as well as terrestrial acidity, eutrophication strong point, and ecotoxicity of the
ecosystem by extension. These are the key traits that distinct EFP from other measures like
greenhouse gases (GHG) and carbon dioxides emissions (CO2) which the current study adopts.
(Katircioglu et al., 2018) To the best of authors knowledge, the use of EFP is rarely used in the
pollutant-environment and economic growth literature. Thus, the present study seek to bridge this
gap and serves as an addition to the relevant literature3. In addition, the case of China is peculiar
in the context of market, economic and political globalization because it potentially factored in the
current trade row with the United States.
The remaining part of this study is planned as follow. The extant studies underpinning the
relationship between globalization and the environment and that of energy consumption and the
environment is highlighted in section 2. Section 3 presents the data and the empirical approaches
employed, while section 4 reports and discusses the estimated results and findings. Section 5
concludes by providing policy suggestions and the potential future research directions.
2
.Globalization and Energy Consumption: An Environmental insight
3 For more insights into EFP interested reader can see
The world global energy market has consistently remains an integral part of the component of
transnational corporations resulting from the globalization of global markets. That there is an
environmental side to this perspective remains a subject of investigation among academicians,
environmentalists, and other stakeholders.
2.1 Globalization and the Environment
In line with the global environmental trend, recent studies have captured the role of globalization.
Through different perspectives, extant studies have shown that globalization can be linked to
environmental sustainability either by virtue of carbon emissions, Greenhouse gas, and other
environmental or anthropogenic gases (Shahbaz et al., 2017; Ding, Ning & Zhang, 2018; Saint
Akadiri et al., 2019; Saint Akadiri, Alola & Akadiri, 2019; Shahbaz et al., 2019; Zaidi et al., 2019).
For instance, Saint Akadiri et al (2019) and Saint Akadiri, Alola and Akadiri (2019) examined the
role of globalization in achieving environmental sustainability target for Italy and Turkey
respectively. Significantly, Saint Akadiri et al (2019) found that globalization actually mitigates
CO2 emissions, thus responsible for increased environmental quality (environmental
sustainability) in Italy. This desirable impact observed by Saint Akadiri et al (2019) is significantly
associated with both short-run and the long-run situations. In addition, Saint Akadiri, Alola and
Akadiri (2019) employed the Autoregressive Distributed Lag (ARDL) and the Bayer-Hanck
combined cointegration techniques and found a non-significant negative impact of globalization
on CO2 emissions in Turkey.
Importantly, Shahbaz et al (2017) and Ding, Ning and Zhang (2018) are separate studies that
recently examined the role of China’s globalization drive in the context of environmental
sustainability. Shahbaz et al (2017) employed the ARDL and the Bayer-Hanck combined
context of globalization for China. The study supports the EKC hypothesis for China in both the
immediate period and the long-run situation. Interestingly, the study found that globalization
mitigates CO2 emissions irrespective of using the overall index or sub-indices of globalization
metrics. A similar perspective is held by Ding, Ning and Zhang (2018) while considering the
bilateral trade activities of China. In the context of globalization, China is reportedly the world
largest exporter and second world largest importer and thereby contributing massive CO2
emissions annually. Within the same context of globalization-carbon emissions nexus, newly
conceived trends of the nexus of globalization and CO2 is being examined. For instance, the
concept of asymmetric relationship and spillover effects of globalization on the CO2 emissions are
being considered in the respective study of Shahbaz, Shahzad and Mahalik (2018) and You and
Lv (2018).
2.2 Energy Consumption and the Environment
The importance of energy is responsible for the broad scope of the context of energy and essentially
akin to a multidisciplinary subject. In the past decades, the concept of energy has been associate
linked to handful of macroeconomic, financial and socio and welfare economics among others.
But, the current trend in energy is largely associated with the economy and the environment. As
such, extant studies have widely examined the linkage between energy and the environment,
courtesy of the persistent awareness of the intergovernmental organizations such as the United
Nations Framework Convention on Climate Change. Most of the recent studies have applied
disaggregation of primary energy by studying it nexus with environmental indicators (Alola &
Alola, 2018; Alola, Alola, & Saint Akadiri, 2019; Alola, Bekun & Sarkodie, 2019; Balcilar, Bekun
2019; Saint Akadiri et al., 2019; Saint Akadiri, Bekun & Sarkodie, 2019; Samu, Bekun &
Fahrioglu, 2019).
For instance, the studies of Saint Akadiri et al (2019), Saint Akadiri, Alola & Akadiri (2019), and
Saint Akadiri, Bekun and Sarkodie (2019) separately examined the nexus of energy consumption
and the environment sustainability without necessary employing the disaggregate primary energy
forms. Each of the studies found that energy consumption is a vital determinant of environmental
quality. By using difference case studies, the renewable energy is being utilized along the
non-renewable energy (fossil fuel) to examine the differential nexus or effect of the two major energy
components on carbon emissions. Specifically, for the case of China, Wang et al (2016) found the
unidirectional causality from energy consumption to CO2 emissions for the period 1990–2012.
Similarly, Wang, Zeng & Wu (2016) found that the impact of energy consumption on carbon
emissions in China varies across the cities. The study explains that the point-industrial stage cities
such as Beijing and Shanghai are associated with larger emissions. For the western and central
China that is characterized with low energy efficiency technologies, higher emissions are also
reported in the region. Considering the energy-environmental nexus projection for 2050, there
seems to be no ease of the impact of energy consumption on environmental quality in China (Hao
et al., 2015). In specific term, Hao et al (2015) opined that energy consumption was responsible
for 8% of nationwide Greenhouse gas in China in 2013. The study however noted that if the
Business-As-Usual (BAU) pattern is not addressed, energy consumption will cause an estimate of
2.4 times the current values by 2050.
3 Methodological Framework
A multivariate framework is set up to investigate the relationship that exists between globalization, ecological footprint, electricity consumption and economic output of china economy. Globalization index as developed by Dreher (2006) is used and it accounts for important dimensions (political, economic and social) of globalization. Ecological footprint (EFP) is used as proxy for environmental quality, electricity consumption measured in kilowatt per hours and real gross domestic product (RGDP) measured in constant 2010 USD. The data for ecological footprint measured in global hectares (gha) was retrieved from Global Footprint Network National Footprint Account (2018 edition), whereas data for electricity consumption and economic growth were retrieved from World Bank Development Database Indicators and globalization index data was retrieved from KOF Swiss Economic Institute database. Annual data used for the econometric analysis covers 1971 – 2014 time period. Data description, unit and source is presented in Table 1 below:
Table 1: Series description and unit of measurement
Variable Unit of Measurement Source
Globalization index (GLDX) percentage KOF
Ecological footprint (EFP) Global hectare of land GFP
Energy consumption (EU) Oil equivalent per in kg WDI
Real Gross Domestic Product (RGDP) Constant 2010n$ USD WDI
Author's compilation
The study follows this empirical sequence: Augmented Dickey-Fuller (1981) and Phillips-Perron (1988) unit root tests analysis and complemented with Zivot-Andrews (1992) unit root test with structural break. Then, Bayer and Hanck (2013) combined cointegration test is used together with bounds test of Pesaran et al. (2001) testing for long run relationship among the variables. Lastly, Granger causality test is applied to ascertain causal relationships between the series.
3.3 Model Specification
The current study builds on the existing study of Shahbaz et al (2016). Thus, this study functional form is presented below as:
EFP = f (EU, GLDX, RGDP) (1)
Logarithm transformation in the above equation is necessary to ascertain homoscedasticity in the series.
Where α denotes constant and δ1, δ2 and δ3 are partial slope parameters. 3.4 Test of Stationarity
To avoid spurious regression testing for stationarity among variables is necessary to establish order of integration of the series. Augmented Dickey-Fuller (1981), Phillips and Perron (1988) and Elliot et al. (1992) tests are needed in determining the order of integration of variables. These are usually referred to as the conventional unit root test which is deficient in accounting for structural breaks and as a result, produces inconsistent and invalid estimates in the presence of structural breaks in the data series. When confronted with economic datasets that is characterized with structural breaks as it is the case of times series data, then conventional unit root tests are complemented with Zivot-Andrews which has the unique feature of capturing structural break in a singular manner.
Below is Zivot-Andrews test model:
= + + Ɣ + + ∑ + (3)
= + + Ɣ + + ∑ + (4)
= + + Ɣ + + + ∑ + (5)
The null hypothesis of Zivot-Andrews unit root 0: Ɣ > 0 is tested against the alternative of stationarity 1: Ɣ< 0. The implication of this is, the inability to reject null hypothesis validates the presence of unit roots, whereas rejection ascertains stationarity.
3.5 Measuring Cointegration Relationships
The econometrics literature provides us with plethora of processes for testing cointegration relationship between variables. These cointegration relationships ranges from short run to long run cointegration relationship them (Carrion-i-Silvestre & Sansó, 2006; Gregory & Hansen, 1996; Johansen, 1991; Phillips & Ouliaris, 1990; Johansen & Juselius, 1990; Engle & Granger, 1987). However, due to the diverse conclusions arrived at by these cointegration tests, there is consideration of a more robust results that can be achieved by individually exploring the test statistics of Bayer and Hanck (2013), Banerjee et al. (1998), Boswijk (1995), Johansen (1991) and Engle and Granger (1987).
The ARDL bounds testing technique is efficient and robust when used to test for cointegration in small sample size among globalization index, ecological footprint, energy consumption and economic output. The striking feature of this approach is the long run and short run dynamics of the fitted regression with error correction model reported simultaneously. The technique also has the ability to determine unknown order of integration of series so far as it I(0) and I(1). The unrestricted version of error correction model assumes that all the variables are endogenous and it is specified.
= + + + + + + +
(6)
is an exogenous variable which accommodates structural breaks in the framework, while Vk represents the vector. F statistics computed from the bounds test is used to validate null hypothesis when there is no cointegration. Three different scenarios exist in making this decision; (i) where F value computed is greater than the upper bounds of the critical values reported. The conclusion is to reject null of no cointegration (ii) where F value lies within both lower and upper bounds, an inconclusive result, and (iii) where F value lies below the upper bounds, a case of no cointegration. Below is the specification of the hypotheses for bounds test:
H0 : β1 = β2 = ……= βk+2 = 0 H1: β1 ≠ β2 ≠ ……≠ βk+2 ≠ 0
3.6.1 Bayer and Hanck Combined Cointegration test
The statistics and econometrics body of knowledge have good compilations of much documented
techniques to equilibrium (cointegration) analysis since the 1980s. The recently developed Bayer
and Hanck (2013) methodology to cointegration ameliorate for the shortcomings of the previous
test. The Bayer and Hanck (B-H) combines different individual tests statistics, which offers the
from B-H more robust to cointegration estimations. The B-H test is based on the Boswijk and
Banerjee test Johansen, Engle and Granger test .The statistical computation is given below:
2[log( ro EG) ( ro JOH)]
EGJOH P P (7)
2[log(( roEG) ( ro JOH) ( ro BO) ( roBDM)
EGJOHBOBDM P P P P (8)
Where, Pro EG,Pro JOH,ProBOandPro BDMrepresents the individual test probability test statistics. The
B-H test have a null hypothesis of no cointegration. This implies that if the null is rejected the fisher
test statistics greater than outlined critical values, we report cointegration among the interest
variables.
3.7 Granger Causality Approach
In determining the direction of causality between variables, causality is necessary though it is a norm that a traditional regression does not necessarily mean causal relationships. However, this allows and arm policymakers and stakeholders good insight with their predictability powers among variables of interest. Where variable X Granger causes Y, this simply means in its entirety that both present and past realizations of the X variable is a good predictor of variable Y. This is usually specified in the bivariate form as:
= + + + (9)
= + + + (10)
From equation (9) the null hypothesis is usually tested against the alternative hypothesis and same is done for equation (10). Granger causality can come in the following form; (a) neutrality which implies no causal interaction or relationship between variable X and Y; (b) unidirectional denoting the interaction from X to Y or otherwise and (c) bidirectional representing a feedback relationship from X to Y and Y to X.
4 Empirical Results and Discussions
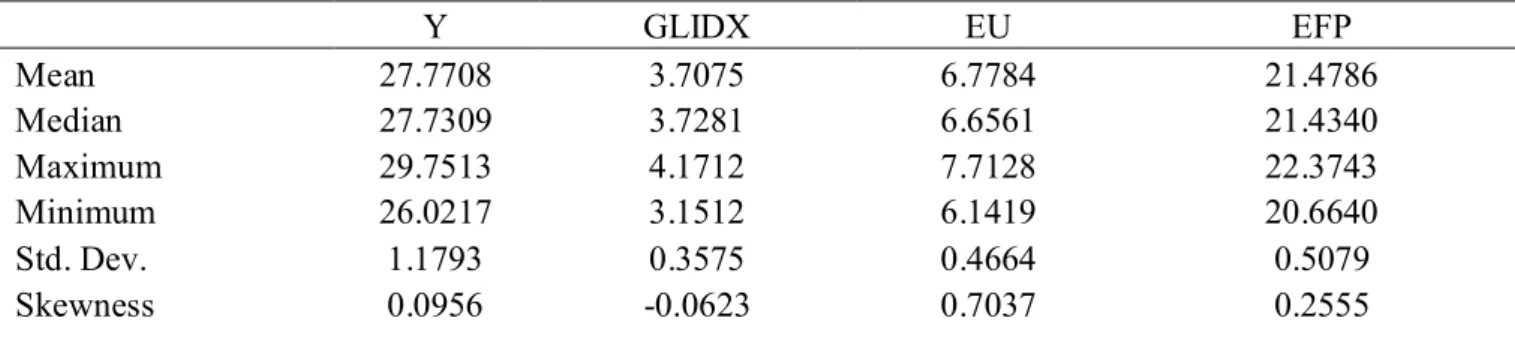
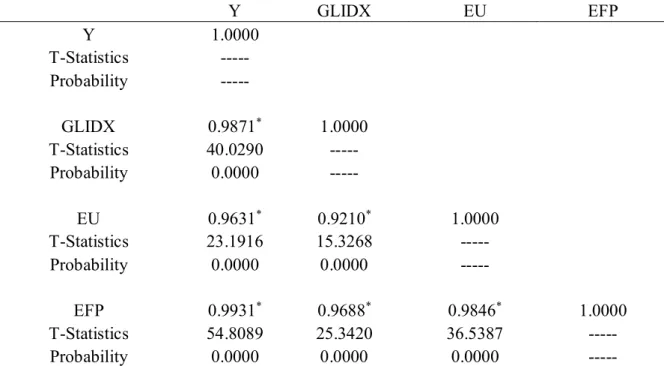
As a preliminary step in empirical analysis, a graphical plot of the dataset is necessary especially for time series estimations to assess the behavior and pattern of the variables under review. Figure 1 shows series that are upward trending with scanty structural break, however measures are taken by the model to account for structural breaks in the course of estimation. Table 2 captures the variables used in the study and reports the descriptive statistics as being normally distributed. The table further reveals wide gap between the maximum and the minimum values for the period under consideration. Table 3 reports the correlation matrix analysis and reveals high and very significant positive association between globalization, energy use, ecological footprint and economic growth over the sampled period. Similar trend is observed with energy use, ecological footprint and globalization. Ecological footprint is positively correlated with energy use. The observed positive correlation among the variables in Chinese economy is quite intuitive and should be explored by various stakeholders for maximum benefits.
Figure 1: Visual plots of RGDP, GLIDX, EU and EFP
Table 2: Basic summary statistics of underlined variables Y GLIDX EU EFP Mean 27.7708 3.7075 6.7784 21.4786 Median 27.7309 3.7281 6.6561 21.4340 Maximum 29.7513 4.1712 7.7128 22.3743 Minimum 26.0217 3.1512 6.1419 20.6640 Std. Dev. 1.1793 0.3575 0.4664 0.5079 Skewness 0.0956 -0.0623 0.7037 0.2555
Kurtosis 1.7274 1.4570 2.3494 1.9876 Author's compilation.
Y represents RGDP, GLIDX stands Globalization index, EGU means Energy
Use, and EFP means ecological footprint
Table 3: Coefficient of Correlation Matrix
Y GLIDX EU EFP Y 1.0000 T-Statistics --- Probability --- GLIDX 0.9871* 1.0000 T-Statistics 40.0290 --- Probability 0.0000 --- EU 0.9631* 0.9210* 1.0000 T-Statistics 23.1916 15.3268 --- Probability 0.0000 0.0000 --- EFP 0.9931* 0.9688* 0.9846* 1.0000 T-Statistics 54.8089 25.3420 36.5387 --- Probability 0.0000 0.0000 0.0000 --- Author's compilation
Y denotes RGDP, GLIDX means globalization index, Energy Use is for EU and EFP stands for ecological footprint. Subsequently, Augmented-Dickey Fuller and Philips and Perron unit root tests is used to test the integrating properties of series of a study and a such useful in providing major stakeholders sound basis for informed decision. Table 4 and 5 reports results of unit root tests.
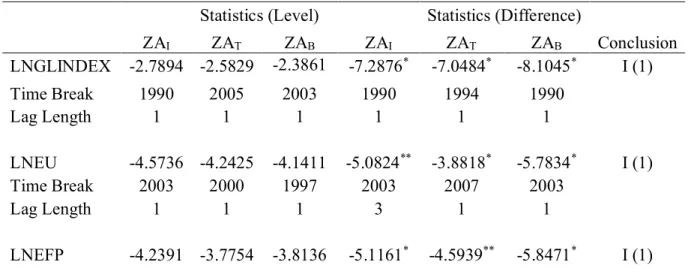
The variables (economic growth, globalization, energy use and ecological footprint) are integrated of order one. From the result, it is observed that structural break does not allow stationarity at levels except at difference. This allows the integrated variables at order one at significance level of 1%. Zivot-Andrews (ZA) is introduced in other to ameliorate inherent issues associated with
ADF and PP unit root tests thereby leading to unreliable and ambiguous results. The ZA test is presented in Table 5, both non-stationarity test are in harmony of unit root at level form and concludes first difference stationarity for considered variables.
Table 4: Unit Root Results (Without break)
Variables ADF PP Panel A: Level Y 0.6450 1.4686 GLIDX -1.0909 -1.0184 EU 0.6430 1.3387 EFP 0.1438 0.4953
Panel B: First Difference
Y -3.1641** -4.3267*
GLIDX -5.63453* -5.6805*
EU -3.5655** -3.5689**
EFP -4.5313* -4.5313*
Author's compilation.
Asterisks (*,**) denotes 1% and 5% significance level of rejection
Table 5: Unit Root Test (with Break)
Statistics (Level) Statistics (Difference)
ZAI ZAT ZAB ZAI ZAT ZAB Conclusion
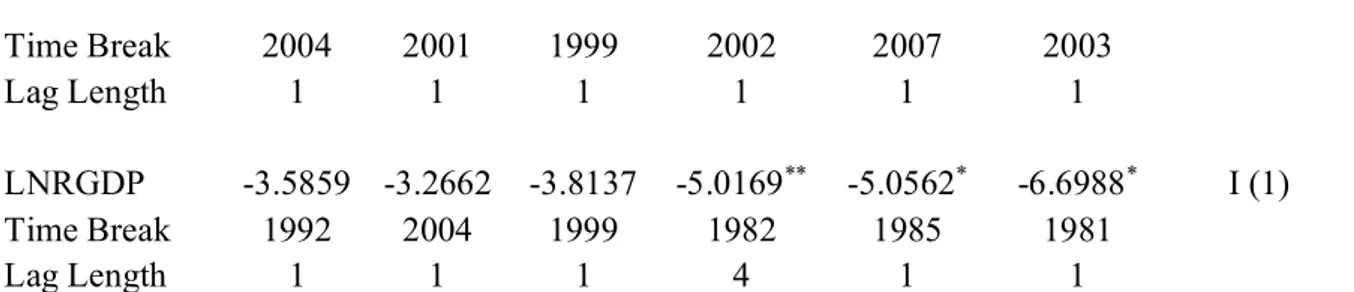
LNGLINDEX -2.7894 -2.5829 -2.3861 -7.2876* -7.0484* -8.1045* I (1) Time Break 1990 2005 2003 1990 1994 1990 Lag Length 1 1 1 1 1 1 LNEU -4.5736 -4.2425 -4.1411 -5.0824** -3.8818* -5.7834* I (1) Time Break 2003 2000 1997 2003 2007 2003 Lag Length 1 1 1 3 1 1 LNEFP -4.2391 -3.7754 -3.8136 -5.1161* -4.5939** -5.8471* I (1)
Time Break 2004 2001 1999 2002 2007 2003
Lag Length 1 1 1 1 1 1
LNRGDP -3.5859 -3.2662 -3.8137 -5.0169** -5.0562* -6.6988* I (1)
Time Break 1992 2004 1999 1982 1985 1981
Lag Length 1 1 1 4 1 1
Note: LnGlindex is globalization index, LnEngyuse is energy use, Lnefp is the ecological footprint and Lnrgdp is
real gross domestic product per capita. All of the variables are at their natural logarithms. ZAI represents the model
with a break in the intercept; ZAT is the model with a break in trend; ZAB is the model with a break in both the trend
and intercept. Asterisks (*,**) denotes 1% and 5% significance level of rejection
Table 6: Lag Length
Lag LogL LR FPE AIC SC HQ
0 138.5404 NA 1.7E-08 -6.6E+00 -6.4E+00 -6.5E+00
1 400.1785 459.4619 1.0E-13 -1.9E+01 -17.70940* -18.24091*
2 420.5995 31.87670* 8.61e-14* -18.76095* -1.7E+01 -1.8E+01
3 430.8996 14.0685 1.2E-13 -1.8E+01 -1.6E+01 -1.8E+01
AIC denotes Akaike information criterion, LR represents sequential modified LR statistic, HQ means Hannan Quinn, SC signifies Schwarz information criteria and finally FPE stands for Final prediction error.
Table 7: ARDL Bounds Test Result
Test Statistic Value k
F-statistic 5.34** 3
Critical Value Bounds
Significance I0 Bound I1 Bound
10% 3.47 4.45
5% 4.01 5.07
2.50% 4.52 5.62
1% 5.17 6.36
Table 8: Bayer and Hanck result
Fitted Model EG-JOH EG-JOH-BO-BDM Cointegration Remark
LnEFP= f(LnEU,LnGLINX,LnY) 50.464** 20.988 Yes
Author’s compilation: The asterisk (**) represents a percent significance level of rejection.
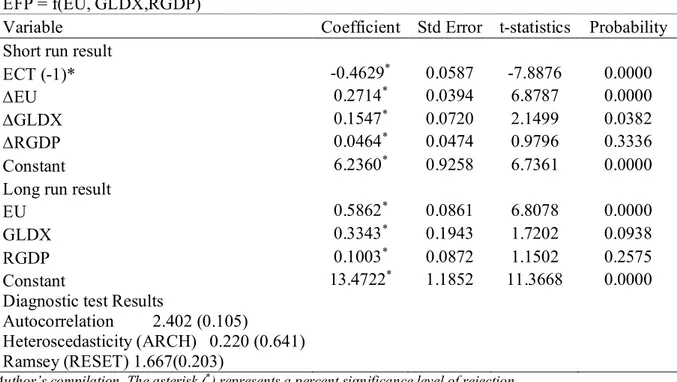
Table 9: Short and Long run ARDL Result
EFP = f(EU, GLDX,RGDP)
Variable Coefficient Std Error t-statistics Probability
Short run result
ECT (-1)* -0.4629* 0.0587 -7.8876 0.0000
∆EU 0.2714* 0.0394 6.8787 0.0000
∆GLDX 0.1547* 0.0720 2.1499 0.0382
∆RGDP 0.0464* 0.0474 0.9796 0.3336
Constant 6.2360* 0.9258 6.7361 0.0000
Long run result
EU 0.5862* 0.0861 6.8078 0.0000
GLDX 0.3343* 0.1943 1.7202 0.0938
RGDP 0.1003* 0.0872 1.1502 0.2575
Constant 13.4722* 1.1852 11.3668 0.0000
Diagnostic test Results Autocorrelation 2.402 (0.105)
Heteroscedasticity (ARCH) 0.220 (0.641) Ramsey (RESET) 1.667(0.203)
Author’s compilation. The asterisk (*) represents a percent significance level of rejection.
The present study proceed to investigate for long-run equilibrium relationship among the choice variables with the aid of Pesaran’s ARDL bounds in conjunction with the recent and novel Bayer and Hanck (2013) combined cointegration test. Prior to the cointegration test the optimum lag selection test is conducted as rendered in Table 6, the Schwarz Bayesian information criteria is chosen as the most parsimonious lag criterion and robust given the sampled data structure. The cointegration analysis shows equilibrium relationship between energy consumption, globalization and economic expansion and proxy for environmental degradation (EFP) over the sampled period.
Both the results of ARDL and B-H reported in Tables 7 and 8 respectively are consistent of convergence between the outlined variables (p <0.05) statistical level.
In Table 9 both short and long run analysis are reported. The error correction term (ECT) that show the speed of adjustment of the fitted model pass the (p<0.01) statistical level. This implies that in case of disequilibrium in the system the outlined explanatory variables adjust with magnitude of 46.3% to its equilibrium path on an annual basis with the contribution of its explanatory variables. Furthermore, we observe a statistical positive relationship at (p<0.01) level between energy consumption and environmental degradation in the short run and long run over the sampled period. This is indicative and informative to policymakers in China. This implied that the Chinse economy energy mix is not clean, that is her energy basket are fossil fuel driven which dampens the quality of the environment (Shahbaz & Sinha.2019). This also indicate the short run focus of the chinse economy is on economic expansion. That is the chinses economy is at the scale stage of her growth trajectory. However, in the long-run there is need for a paradigm shift to clean energy sources such are renewables like hydro, photovoltaic, wind and biomass are encouraged (Emir & Bekun, 2019). Furthermore, the wave of globalization also had its toll on the quality of Chinses economy, given the interconnectedness of the world in recent time. This phenomenon has infiltrated into depletion of the quality of the environment in china. This outcome raises concern for energy specialist in china and government administrator that formulate and design macro economy framework (blue prints). Thus, as much as globalization has its good side the negative impact should be watch closely by the Chinese government as it has negative effected in both long and short run over the sampled period with deterioration of quality of the environment. This outcome is consistent with the findings of Shahbaz et al (2017) and Ding, Ning and Zhang (2018). The quest by most government official is to increase economic growth, which translate into better living standard for citizenry; the chinses economy is no exception. This explains the recent strides by the chinses economy on theBelt and Road Initiative (BRI) establish in 2013 to join the rest of the world via aggressive road and infrastructure. However, these laudable fit does not come without its implication on the environment and ecosystem at large in China. Thus, the need for caution in policy construction is pertinent for increase economic expansion a well not jeopardy for the quality of the environment.
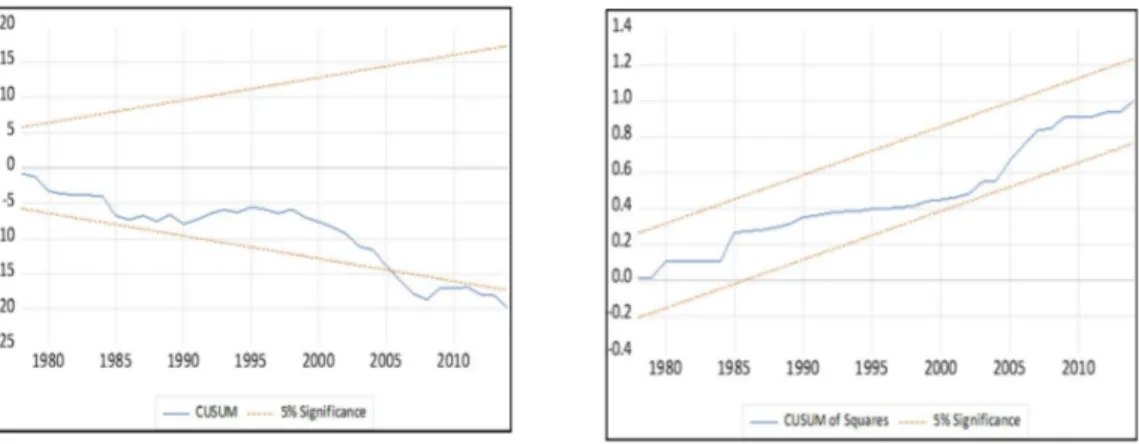
The fitted model is free from serial correlation issues, heteroscedasticity and properly specified model as reported at bottom of Table 9. The Stability of the model is presented in figure 2, which shows the model is fit and suitable for policy direction
Figure 2: Stability graphical plots of the CUSUM and CUSUMsq
Table 10: Granger Causality Test
Null Hypothesis: Causality F-Statistic Prob.
EU does not Granger Cause EFP EU → EFP 2.40228*** 0.0847
EFP does not Granger Cause EU 0.56555 0.6415
GLDX does not Granger Cause EFP EFP → GLDX 1.53149 0.2241
EFP does not Granger Cause GLDX 2.6135*** 0.0671
RGDP does not Granger Cause EFP RGDP ≠ EFP 1.34586 0.2758
EFP does not Granger Cause RGDP 0.05086 0.9846
GLDX does not Granger Cause EU GLDX ↔ EU 3.36867* 0.0296
EU does not Granger Cause GLDX 3.21155* 0.0351
RGDP does not Granger Cause EU RGDP ≠ EU 2.03592 0.1273
EU does not Granger Cause RGDP 0.19993 0.8957
RGDP does not Granger Cause GLDX GLDX → RGDP 0.49194 0.6902
Author’s compilation. Asterisk(s) ( *,**,*** )represents 1%, 5% and 10% significance level of rejection accordingly.
Note that ↔ represents bidirectional causality, while → denotes unidirectional causality and ≠ means neutrality. Generally, regression does not depicts causation. Thus, the need for causality test to determine the predictability power of one variable over another is crucial for policy construction. The present study applied the Granger causality test to detect the direction of casualty flow among the variables under review. Table 10 resents the causality analysis; we observe one-way causality running from energy consumption to EFP. This outcome is insightful, this implies that energy consumption drives environmental degradation in china. In addition, the wave of globalization further deplete environment al quality as uni-direction causality is seen running from EFP to Globalization. Feedback causality is experience between wave of globalization and energy consumption this is in line with the study of Shahbaz et al (2017) and Ding, Ning and Zhang (2018) of china. This means the quest for increase economic output as seen in the uni-directional causality seen from globalization to economic growth should be watch with caution not to dampen the quality of the environment in china given the high wave of globalization and industrial commerce and energy intensification for clean environment.
5. Conclusion
This study offers new insight into the interconnectedness of the world as it concerns increase energy consumption to determine its implications on environmental sustainability. This has made it possible for the global economies to be connected in various means such as integration of financial systems, politics, trade volumes and other areas. Thus, this study examined the role of globalization-led growth and induced energy consumption hypothesis in environmental sustainability using a multivariate approach for the case of China. The variables of interest were used in a multivariate framework to avoid the omitted variable bias. To this end, annual data from 1971 to 2015 were sourced from World Bank Development Database Indicators and KOF Swiss Economic Institute Database and used for the econometric analyses.
The key findings from this presents study includes validation of equilibrium relationship between the studied variables as traced by B-H and ARDL bounds test. Subsequently, energy intensification drives environmental degradation over the investigated period. This is instructive for chinse government officials given the recent BRI wave and wave globalization. There is need for policy mix to mange adequately increase energy consumption without compromise for the quality of the environment. Based on these findings the following policy prescription were suggested;
(i) The adoption of more efficient and updated energy technologies like renewables such as hydro, wind, photovoltaic and biomass energy sources are needed in China energy portfolio mix. This is a precondition for successful decarbonization of economic expansion from pollutant emissions.
(ii) There is need for china to reinforce her commitment on environmental treaties such as Kyoto protocol and many others. This will foster the attaining the SDGs 2030 targets.
Reference
Alola, A. A. (2019a). The trilemma of trade, monetary and immigration policies in the United
States: Accounting for environmental sustainability. Science of The Total
Environment, 658, 260-267.
Alola, A. A. (2019b). Carbon emissions and the trilemma of trade policy, migration policy and
health care in the US. Carbon Management, 10(2), 209-218.
Alola, A. A., & Alola, U. V. (2018). Agricultural land usage and tourism impact on renewable
energy consumption among Coastline Mediterranean Countries. Energy & Environment,
29(8), 1438-1454.
Alola, A. A., Alola, U. V., & Saint Akadiri, S. (2019). Renewable energy consumption in Coastline
Mediterranean Countries: impact of environmental degradation and housing policy.
Environmental Science and Pollution Research, 1-13.
Alola, A. A., Bekun, F. V., & Sarkodie, S. A. (2019). Dynamic impact of trade policy, economic
growth, fertility rate, renewable and non-renewable energy consumption on ecological
Balcilar, M., Bekun, F. V., & Uzuner, G. (2019). Revisiting the economic growth and electricity
consumption nexus in Pakistan. Environmental Science and Pollution Research, 26(12),
12158-12170.
Banerjee A., Dolado J., & Mestre, R. (1998). Error‐correction mechanism tests for cointegration
in a single‐equation framework. Journal of time series analysis, 19(3), 267-283.
Bayer, C., & Hanck, C. (2013). Combining non-cointegration tests. Journal of Time Series
Analysis, 34(1), 83–95.
Bekun, F. V., Alola, A. A., & Sarkodie, S. A. (2019). Toward a sustainable environment: Nexus
between CO2 emissions, resource rent, renewable and nonrenewable energy in 16-EU
countries. Science of the Total Environment, 657, 1023-1029.
Bekun, F. V., Emir, F., & Sarkodie, S. A. (2019). Another look at the relationship between energy
consumption, carbon dioxide emissions, and economic growth in South Africa. Science of
the Total Environment, 655, 759-765.
Bello, M. O., Solarin, S. A., & Yen, Y. Y. (2018). The impact of electricity consumption on CO2
emission, carbon footprint, water footprint and ecological footprint: the role of hydropower
in an emerging economy. Journal of environmental management, 219, 218-230.
British Petroleum, BP (2018). BP statistical review of world energy. 2018. Available
from:https://www.bp.com/en/global/corporate/energy-economics/statistical-review-of-world-energy/downloads.html. Retrieved 10 July 2019.
Boswijk, H. P. (1995). Efficient inference on cointegration parameters in structural error correction models. Journal of Econometrics 69(1), 133-158.
Carrion‐i‐Silvestre, J. L., & Sansó, A. (2006). Testing the null of cointegration with structural
Cen tral Intelligence Agency, C IA (2019).
https://www.cia.gov/library/publications/the-world-factbook/geos/ch.html. Retrieved 10 July 2019.
Ding, T., Ning, Y., & Zhang, Y. (2018). The contribution of China’s bilateral trade to global carbon
emissions in the context of globalization. Structural Change and Economic Dynamics, 46,
78-88.
Dickey, D. A., & Fuller, W. A. (1981). Likelihood ratio statistics for autoregressive time series
with a unit root. Econometrica: Journal of the Econometric Society, 1057-1072.
Elliott, G., Rothenberg, T. J., & Stock, J. H. (1992). Efficient tests for an autoregressive unit root.
Econometrica, 64, 813-836.
Emir, F., & Bekun, F. V. (2019). Energy intensity, carbon emissions, renewable energy, and
economic growth nexus: new insights from Romania. Energy & Environment, 30(3),
427-443.
Engle, R. F., & Granger, C. W. (1987). Co-integration and error correction: representation,
estimation, and testing. Econometrica: Journal of the Econometric Society, 251-276.
Engle, R. F., Granger, C. W., & Hallman, J. J. (1989). Merging short-and long-run forecasts: An
application of seasonal cointegration to monthly electricity sales forecasting. Journal of
Econometrics, 40(1), 45-62.
Global Economic Dynamics (2019). The pros and cons of globalization.
https://ged-project.de/allgemein-en/the-pros-and-cons-of-globalization/. Retrieved 10 July 2019.
Global Footprint Network. (2018). National footprint accounts, ecological footprint. Retrieved
Gregory, A. W., & Hansen, B. E. (1996). Residual-based tests for cointegration in models with
regime shifts. Journal of Econometrics, 70(1), 99-126.
Hao, H., Geng, Y., Li, W., & Guo, B. (2015). Energy consumption and GHG emissions from
China's freight transport sector: scenarios through 2050. Energy Policy, 85, 94-101.
International Energy Agency, IEA, (2018). World Energy Outlook 2018.
https://www.iea.org/weo2018/. Retrieved 10 July 2019.
Johansen, S. (1991). Estimation and hypothesis testing of cointegration vectors in Gaussian vector
autoregressive models. Econometrica, 59(6), 1551–1580.
Johansen, S., & Juselius, K. (1990). Maximum likelihood estimation and inference on
cointegration with applications to the demand for money. Oxford Bulletin of Economics
and Statistics, 52(2), 169–210.
Katircioglu, S., Gokmenoglu, K. K., & Eren, B. M. (2018). Testing the role of tourism
development in ecological footprint quality: evidence from top 10 tourist destinations.
Environmental Science and Pollution Research, 25(33), 33611-33619.
Pesaran, M. H., Shin, Y., & Smith, R. J. (2001). Bounds testing approaches to the analysis of level
relationships. Journal of applied econometrics, 16(3), 289-326.
Phillips, P.C., & Ouliaris, S. (1990). Asymptotic properties of residual based tests for
cointegration. Econometricia, 12, 165–193.
Phillips, P. C., & Perron, P. (1988). Testing for a unit root in time series regression. Biometrika,
Saint Akadiri, S., Alkawfi, M. M., Uğural, S., & Akadiri, A. C. (2019). Towards achieving
environmental sustainability target in Italy. The role of energy, real income and
globalization. Science of The Total Environment, 671, 1293-1301.
Saint Akadiri, S., Alola, A. A., & Akadiri, A. C. (2019). The role of globalization, real income,
tourism in environmental sustainability target. Evidence from Turkey. Science of The Total
Environment.
Saint Akadiri, S., Alola, A. A., Akadiri, A. C., & Alola, U. V. (2019). Renewable energy
consumption in EU-28 countries: policy toward pollution mitigation and economic
sustainability. Energy Policy, 132, 803-810.
Saint Akadiri, S., Bekun, F. V., & Sarkodie, S. A. (2019). Contemporaneous interaction between
energy consumption, economic growth and environmental sustainability in South Africa:
What drives what?. Science of The Total Environment, 686, 468-475.
Samu, R., Bekun, F. V., & Fahrioglu, M. (2019). Electricity consumption and economic growth
nexus in Zimbabwe revisited: fresh evidence from Maki cointegration. International
Journal of Green Energy, 16(7), 540-550.
Shahbaz, M., Khan, S., Ali, A., & Bhattacharya, M. (2017). The impact of globalization on CO2
emissions in China. The Singapore Economic Review, 62(04), 929-957.
Shahbaz, M., Mahalik, M. K., Shahzad, S. J. H., & Hammoudeh, S. (2019). Testing the
globalization-driven carbon emissions hypothesis: international evidence. International
Economics, 158, 25-38.
Shahbaz, M., Shahzad, S. J. H., & Mahalik, M. K. (2018). Is globalization detrimental to CO 2
emissions in Japan? New threshold analysis. Environmental Modeling & Assessment,
Shahbaz, M., & Sinha, A. (2019). Environmental Kuznets curve for CO2 emissions: a literature
survey. Journal of Economic Studies, 46(1), 106-168.
The Wo rld Ban k (2019). The World Bank in China.
https://www.worldbank.org/en/country/china/overview. Retrieved 10 July 2019.
Wang, S., Li, Q., Fang, C., & Zhou, C. (2016). The relationship between economic growth, energy
consumption, and CO2 emissions: Empirical evidence from China. Science of the Total
Environment, 542, 360-371.
Wang, Q., Zeng, Y. E., & Wu, B. W. (2016). Exploring the relationship between urbanization,
energy consumption, and CO2 emissions in different provinces of China. Renewable and
sustainable energy reviews, 54, 1563-1579.
You, W., & Lv, Z. (2018). Spillover effects of economic globalization on CO2 emissions: a spatial
panel approach. Energy Economics, 73, 248-257.
Zaidi, S. A. H., Zafar, M. W., Shahbaz, M., & Hou, F. (2019). Dynamic linkages between
globalization, financial development and carbon emissions: Evidence from Asia Pacific
Economic Cooperation countries. Journal of Cleaner Production, 228, 533-543.
Zivot, E., & Andrews, D. W. K. (1992). Further evidence on the Great Crash, the oil price shock,