STRIKING IMPROVEMENTS IN FEMALE EMPLOYMENT
1Seyfettin Gürsel*, Gökçe Uysal and Ayşenur Acar
Executive Summary
According to quarterly labor market statistics released by TurkStat, urban female employment increased by 56 percent (1.5 million) from 2005 to 2012. In parallel, female labor force also has expanded. From 2005 to 2012, urban labor force participation increased by 0.7 percentage points on average per year and after 2008 the increase accelerated and reached 1.3 percentage points per year. In the last four years, the participation rate has risen from 21 to 26 percent. Due to equivalent and simultaneous rises in female labor force and employment, urban female unemployment rate slightly decreased.
Increases in employment, especially in wage employment, is an important improvement in female employment. The analyses by education and age reveal that especially middle-aged and low-educated (less than high school) housewives have entered the labor market. This is a fresh and striking progress. If these increases in female labor force and employment continue, the gap in female labor force participation between Turkey and developed countries will shrink and Turkey will take a big step on its way to economic development.
Unusual increase in female employment
In recent years, unusual improvements in female employment have been observed. From 2005, when TurkStat started to release quarterly labor statistics, until 2012 female employment increased by 43 percent (Table 1). It may seem like the rise in female labor force recorded in this period is stemming from an unexpected increase in agricultural employment (between 2008 and 2010). However, data in Table 1 shows that only a part of total expansion in female employment can be explained by the rise in agricultural employment. Indeed, the increase in urban female employment rate reached 56 percent in seven years. In urban areas female employment expanded by 215 thousand on average per year. Note that the increase in urban employment has accelerated since 2008. 70 percent of 1.5 million expansion is recorded in the last four years. While urban employment increased by 16.1 percent (approximately 5 percent per year) during the period of 2005-2008, it reached 34.5 percent (approximately 7.5 percent increase per year) between 2008 and 2012. The unusual increase occurs during the last years of the period under study.
1 We would like to thank Mine Durmaz for translation.
**Prof. Dr. Seyfettin Gürsel, Betam, Director, [email protected]
Asst. Prof. Gökçe Uysal, Betam, Vice Director, [email protected]
Ayşenur Acar, Betam, Research Assistant, [email protected]
09 January 2014
Research Brief 14/160
Table 1: Female employment (in thousands, urban and total) Change Increase (%) 2005 2008 2012 2005-08 2008-12 2005-12 2005-08 2008-12 2005-12 Urban Employment 2,685 3,117 4,193 432 1,076 1,508 16.1 34.5 56.1 Total Employment 5,10 8 5,59 5 7,30 9 487 1,714 2,201 9.5 30.6 43.1 Service Employment (Urban) 1,67 4 2,09 2 2,94 5 418 853 1,271 25.0 40.8 75.9 Service Employment (Total) 1,892 2,366 3,349 474 983 1,457 25.1 41.5 77.0
Source: TurkStat; Betam
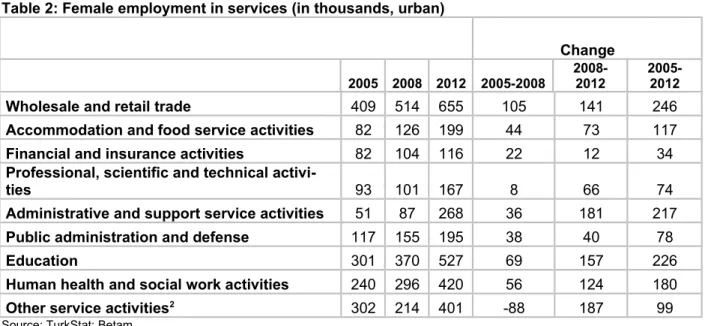
The data indicates that the major part of female employment increase (84 percent) occurred in services (Table 1). This is not surprising. Historically, as economies develop, the share of services in total employment increases, and so does the share of women in services. Looking more carefully at the subsectors in services may shed light on the increase in female employment. The most salient expansion in employment occurred in the subsectors "Administrative and support service activities" (approximately 5.5 times more) and "Accommodation and food services activities" (approximately 2.5 times more) (Table 2).
From 2005 to 2012 urban female employment increased by 1 million 271 thousand. Almost 80 percent of this increase corresponds to increases in 5 sub-sectors. The ranking of 5 sub-sectors by share of contribution are as follows: "Wholesale and retail trade", “Administrative and support service activities”, "Education", "Human health and social work activities", "Accommodation and food service activities". This finding on subsectors will be discussed further below in analyses by education and age.
Table 2: Female employment in services (in thousands, urban)
Change
2005 2008 2012 2005-2008 2008-2012 2005-2012
Wholesale and retail trade 409 514 655 105 141 246
Accommodation and food service activities 82 126 199 44 73 117
Financial and insurance activities 82 104 116 22 12 34
Professional, scientific and technical
activi-ties 93 101 167 8 66 74
Administrative and support service activities 51 87 268 36 181 217
Public administration and defense 117 155 195 38 40 78
Education 301 370 527 69 157 226
Human health and social work activities 240 296 420 56 124 180
Other service activities2 302 214 401 -88 187 99
Source: TurkStat; Betam
Unexpected increase in unskilled and regular female employment
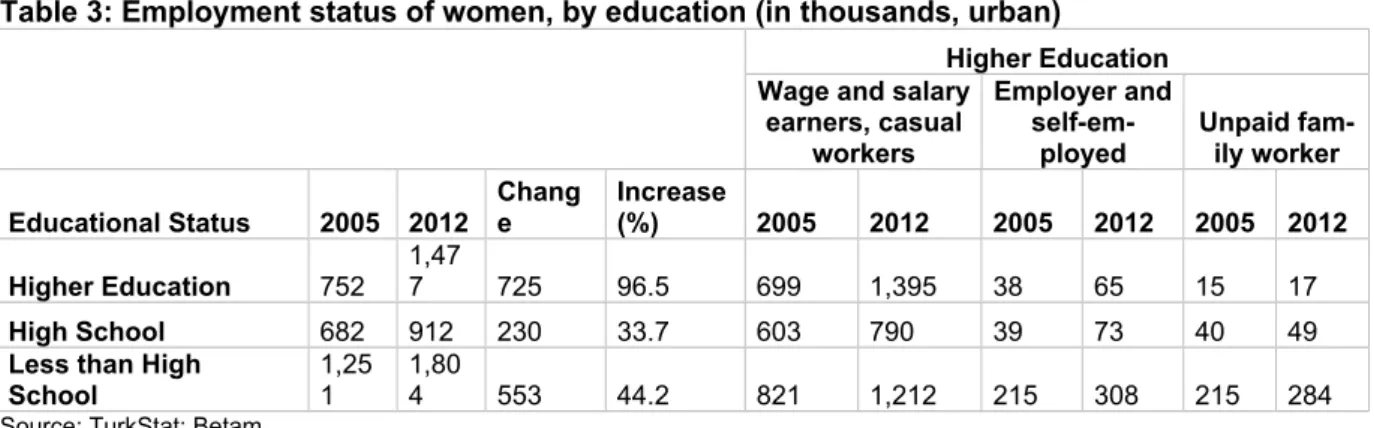
Table 3 provides information on urban female employment by education and employment status. Almost half of the expansion in urban female employment (725 thousand) is due to the increase in urban employment of highly educated females (Table 3). Labor force participation rate among highly educated women is quite high (71.1 percent) compared to those in other education groups (16.0 2TurkStat classifies the Services industry into 13 subcategories. Since the number of observations is small, we grouped 5 sub-sectors into a category of “Other service activities”. These subsub-sectors are “Transport and storage”, “Information and communication”, “Real estate activities”, “Arts, entertainment and recreation” and “Other service activities” (TurkStat). What it is called “Other service activities” by TurkStat includes activities of member organizations, computers, personal and household items maintenance and other personal service activities not included in any other group.
percent for "less than high school" and 33.1 percent for "high school") and also the number of highly educated women is consistently increasing. On the other hand, approximately 70 percent of the other half (553 thousand, 37 percent of total increase) is due to the increase in employment of unskilled females, namely women with less than high school education. In fact, employment of women with less than high school education rose from 1 million 251 thousand to 1 million 804 thousand (44.2 percent) while that of female high school graduates increased from 682 to 912 thousand (33.7 percent) (Table 3). This improvement is definitely surprising.
Table 3: Employment status of women, by education (in thousands, urban)
Higher Education Wage and salary
earners, casual workers
Employer and
self-em-ployed Unpaid fam-ily worker
Educational Status 2005 2012 Chang e Increase (%) 2005 2012 2005 2012 2005 2012 Higher Education 752 1,47 7 725 96.5 699 1,395 38 65 15 17 High School 682 912 230 33.7 603 790 39 73 40 49
Less than High
School 1,251 1,804 553 44.2 821 1,212 215 308 215 284
Source: TurkStat; Betam
Another striking feature of the large increase in urban female employment is that the major part of this increase is occurred in wage employment (Table 3). Employment among highly educated females expanded by 725 thousands and majority of them (696 thousand) are wage and salary earners or causal employees. Clearly jobs that require highly skilled labor pay more than the average wage. It is obvious that female university graduates prefer to work in wage employment rather than in self-employment. From 2005 to 2008, the amount of employer or self-employed women increased by 27 thousand.
As for high school graduates, 187 (81 percent) out of 230 thousand increase in employment is in wage employment (Table 3). The number of self-employed high school graduates is 34 thousand. Even though the rise in employment of high school graduates seems small relative to university graduates, it is still sizeable.
In the lower education category, 391 (71 percent) out of 553 thousand increase in employment is recorded in wage employment (Table 3). This increase is substantially large. The amount of unskilled but self-employed females is 93 thousand (16.8 percent). Note that the largest share of unpaid family workers is recorded in unskilled group of women (15.7 percent) while it is 5.7 percent among high school graduates.
As the level of education and thus the level of average wage decline, the number of self-employed females is increasing, as expected. However, it should be emphasized that recorded employment increase among unskilled females is mainly stemming from wage employment.
Limited role of the added worker effect
These findings indicate that the added worker effect is not as large as previously thought. This effect is observed during periods of economic crises where unemployment and risks of unemployment increase and real wages decrease. In economies especially with large amount of inactive female labor force, inactive women who are members of households that are negatively affected by economic crises, enter the labor market. Since it is not easy to find paid work, especially during economic crises, female unemployment increases as well as the number of women who set up their own businesses, which are mainly simple, temporary and with small earnings. Studies in literature show that the added worker effect is observed in Turkey during 1994, 2001 and 2009 crises.3
3Studies dealing with added worker effect during economic crises in Turkey are as follows: Başlevent, C. and O. Onaran, 2003, “Are Married Women in Turkey. More Likely to Become Added or Discouraged Workers? Labor 17(3): 439-458"; İlkkaracan, İ., 2012, " Why So Few Women in the Labor Market in Turkey? Feminist Economics, Volume 18, Issue 1, 2012"; Karaoğlan, D. and Ç.Ökten, 2012, " Labor Force Participation of Married Women in Turkey: Is There an Added or a Discouraged Worker Effect?" IZA DP No. 6616.
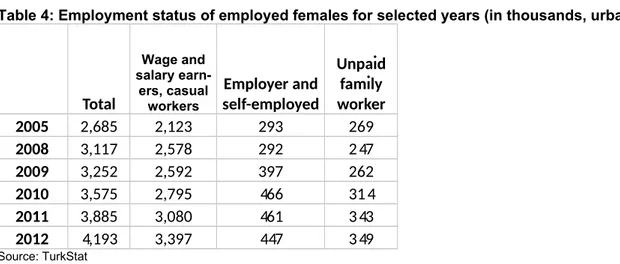
Table 4 represents female urban employment by employment status during the period of 2005-2012. During 2005-2008 the number of female employers and self-employed women remained unchanged. The number of female unpaid family workers declined slightly and wage employment increased by 455 thousand while employment expanded by 432 thousand. In spite of the economic crisis, from 2008 to 2009 the amount of urban female employment increased by 135 thousand but 105 thousand of this (major part) corresponds to an increase in employers and the self-employed. That is, added worker effect is observed during this period. It is interesting that female wage employment also increased in spite of the economic crisis. We think that one of the reason behind the increase in wage employment is the social security premium incentives that came into effect during this period.4 The added worker
effect is weakened in 2010 and from 2011 onward, the effect is lost. Moreover, when improvements in employment is analyzed in quarterly data, the added worker effect is much more significant during the period of economic crises (from the last quarter of 2008 to the second quarter of 2009). 5
Consequently, data reveals that the share of the added worker effect in the increase in female employment is limited and this effect is especially significant during the economic crisis. The extraordinary increase in urban female employment requires other explanations.
Table 4: Employment status of employed females for selected years (in thousands, urban)
Total Wage and salary earn-ers, casual workers Employer and self-employed Unpaid family worker 2005 2,685 2,123 293 269 2008 3,117 2,578 292 247 2009 3,252 2,592 397 262 2010 3,575 2,795 466 314 2011 3,885 3,080 461 343 2012 4,193 3,397 447 349 Source: TurkStat
Formal employment is increasing
There is a common belief that working females, especially unskilled ones, are employed informally. The numbers do not verify this view. In 2005, 1 million 105 thousand out of 2 million 685 thousand (41 percent) females in urban areas were working or being employed informally. Informal working ratio among female regular or causal employees was 30 percent. In 2012 these ratios decreased to 30 percent and 20 percent respectively (A.Table 1). An improvement of 10 percentage points in formality in seven years is observed. The most striking improvement in employment is observed for low-educated females (less than high school), namely in unskilled female employment. 392 out of 553 thousand (71 percent) rise in employment recorded in this educational category (less than high school) was formal employment.
Female unemployment declined despite strong labor force increase
One would expect that expansions in urban female employment lower female unemployment rates, we observe a slight reduction in unemployment rates. In 2005, urban female unemployment rate was 17 percent. It dropped to 16.6 percent in 2008 and 15.5 percent in 2012. This limited decrease stems from simultaneous expansions in urban female labor force and employment. From 2005 to 2008 urban female employment increased by 432 thousand, whereas urban labor force increased by 503 thousand. Due to equivalent increases in labor force and employment, unemployment rate fell by only 0.4 points. On the other hand, urban female employment expanded by 1 million 76 thousand from 2008 to 2012 (Table 1), while labor force expansion was 1 million 225 thousand. Since there is a 4For detailed information, please see Betam Research Brief #151 titled "Incentives Increase Formal Female Employment ", G. Uysal, 2013.
5For detailed information, please see Betam Research Brief #034 titled " Women are desperately seeking self-employment", Gürsel, S., G. Uysal ve M.A. Dinçer, 2009.
strong increase in employment despite of strong labor force increase, unemployment rate is reduced by 1.1 points.
In this context, we want to stress that another common belief “higher women labor participation, higher female unemployment rates” is falsified by the decrease in female unemployment despite increases in the female labor force.
Increase in unskilled female employment
In the light of previous findings, we raise the following question. Do unusual expansions in female employment stem from increases female labor force participation or is it a pull effect of an increased labor demand by the firms that increases female labor force participation and employment? In other words, did more women seek and find work? Or, did social security premium incentives granted for women increase the demand for female employees and encourage women to enter the labor market? At this point, note that supply and demand for labor are not completely independent from each other and both dynamics foster one another to some extent.
It is not possible to provide comprehensive answers to all of these questions above in this research brief, but some clues exist. As mentioned above, the most unusual improvement in female employment is the increase in labor force participation rate recorded among unskilled women during the period of 2008-2012. Moreover, acceleration in the rise in labor force is due to the increase in participation rate of middle-aged generation inactive in the labor force rather than that of the young generation who participate in the labor force for the first time. In order to test this insight and to investigate other possible factors, we calculated urban female participation rates with respect to education and age for the period of 2005-2012.
Higher education groups are postponing retirement
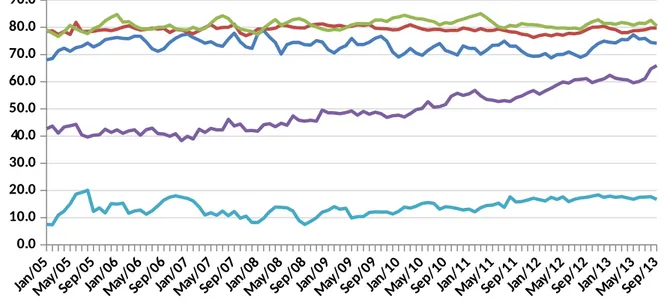
First, we discuss improvements in labor force participation rates in highly educated women. Figure 1 displays seasonally adjusted trends in quarterly labor force participation rates of female university graduates by age during the period 2005-2012. It is clear that participation rates for all age groups, except the 45-54 age group remained stagnant. At this point, note that we analyze trends in participation rates over time, stagnant participation rates do not imply stagnant labor force, the rise in labor force still continues and the increase is in line with the structural trend.
Figure 1: Trends in quarterly labor force participation rates of highly educated females, by age groups (urban, seasonally adjusted)
Jan/ 05 May /05 Sep/ 05 Jan/ 06 May /06 Sep/ 06 Jan/ 07 May /07 Sep/ 07 Jan/ 08 May /08 Sep/ 08 Jan/ 09 May /09 Sep/ 09 Jan/ 10 May /10 Sep/ 10 Jan/ 11 May /11 Sep/ 11 Jan/ 12 May /12 Sep/ 12 Jan/ 13 May /13 Sep/ 13 0.0 10.0 20.0 30.0 40.0 50.0 60.0 70.0 80.0 90.0 15-24 25-34 35-44 45-54 55+
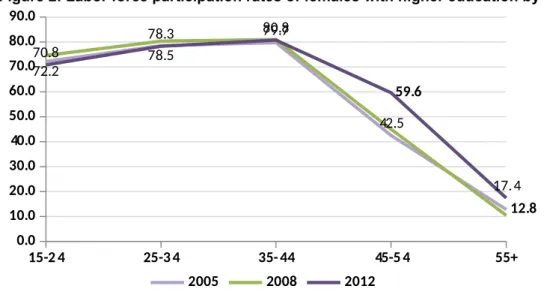
In the "higher education" group, there is an unusual improvement in labor market participation for women aged between 45 and 54. When the 2005, 2008 and 2012 curves of labor participation rates by age are taken together, this fact is apparent (Figure 2). Until the age of 45 these three curves (2005, 2008 and 2012 in Figure 2) almost coincide, which implies that there is no significant change in labor participation among middle-aged highly educated women. Although 2005 and 2008 curves are also almost identical for females older than 45, the 2012 curve has shifted upwards. Since we do not expect inactive women of this age to enter the labor market, this progress can only be explained by postponed retirement decisions. In a recently published Betam’s research brief, we showed that the effects of 1999 Reform that aims to defer the retirement age have started to be kick in.6 Females in
this age group are already postponing their retirement age compared to previous generations and continuing to work. We would say that in the upcoming years the effect of late retirement will continue and foster the increase in highly educated female labor force and employment concurrently.
Figure 2: Labor force participation rates of females with higher education by age (%, urban)
15-24 25-34 35-44 45-54 55+ 0.0 10.0 20.0 30.0 40.0 50.0 60.0 70.0 80.0 90.0 72.2 78.5 79.7 42.5 12.8 70.8 78.3 80.8 59.6 17.4 2005 2008 2012
Source: TUIK; Betam
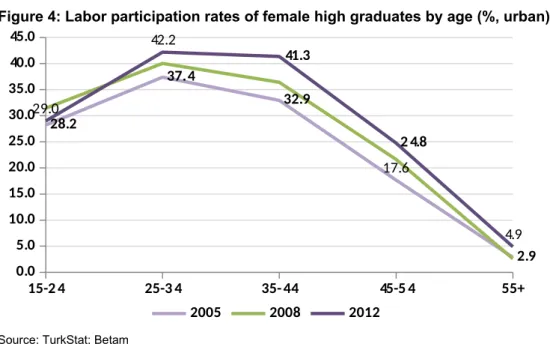
Steady increase in labor force participation of high school graduates
Looking at labor force participation of women by age groups, two different patterns emerge for high school graduates compared to more educated females. First, participation rates are increasing in all age groups except in the age group of 15-24. Secondly, the increase in the 2005-2008 period is almost equivalent to that in the 2008-2012 period. In other words, the curves of female labor force participation by age are consistently shifting upwards (Figure 4). There was no remarkable change in the participation rate of 15-24 age group, which can be explained by the decline in participation as enrollment in education increases among girls aged between 15 and 19 as well as the increase in participation rate in age group of 20-24. A closer look reveals that the participation rate decreased from 18.2 to 17.7 percent for females aged between 15 and 19 and fell from 34.7 to 34.5 percent for females in 20-24 age group.
Starting from the age of 25, participation rates are increasing consistently. The data indicates that the highest increase in the participation rates occurred in 35-44 age group (8.4 percent points) and the second highest is recorded in 45-54 age group (Figure 4). Postponed retirement decisions may have stimulated the increase for females older than 55. This impact would be present partially in the 45-54 age group as well. However, a high increase in labor force among the middle-aged (35-44) high school graduates is extraordinary and ought to be explained. A generational shift may have an impact on this high increase. On the other hande, the increase in participation rate in the 25-34 age group is relatively limited (4.8 points). This finding hints that the cohort effect would explain only a part of the large increase in 35-44 age group.
6 For detailed information, please see Betam Research Brief #155 titled "We are postponing retirement". http://betam.bahcesehir.edu.tr/en/wp-content/uploads/2013/11/ResearchBrief155.pdf
Figure 3: Trend of labor force participation rates of high school graduate females (Urban, seasonally adjusted) Jan/ 05 May /05 Sep/ 05 Jan/ 06 May /06 Sep/ 06 Jan/ 07 May /07 Sep/ 07 Jan/ 08 May /08 Sep/ 08 Jan/ 09 May /09 Sep/ 09 Jan/ 10 May /10 Sep/ 10 Jan/ 11 May /11 Sep/ 11 Jan/ 12 May /12 Sep/ 12 Jan/ 13 May /13 Sep/ 13 0.0 5.0 10.0 15.0 20.0 25.0 30.0 35.0 40.0 45.0 50.0 15-24 25-34 35-44 45-54 55+
Source: TurkStat; Betam
Consequently, there is an unusual increase in labor force participation among female high school graduates. As it can be seen below, this increase is parallel to the increase in unskilled (with less than high school education) female labor force. The rise in employment recorded for female high school graduates corresponds to a relatively small part (15 percent) of 1 million 508 thousand expansion in total urban female employment.
Figure 4: Labor participation rates of female high graduates by age (%, urban)
15-24 25-34 35-44 45-54 55+ 0.0 5.0 10.0 15.0 20.0 25.0 30.0 35.0 40.0 45.0 28.2 37.4 32.9 17.6 2.9 29.0 42.2 41.3 24.8 4.9 2005 2008 2012
Source: TurkStat; Betam
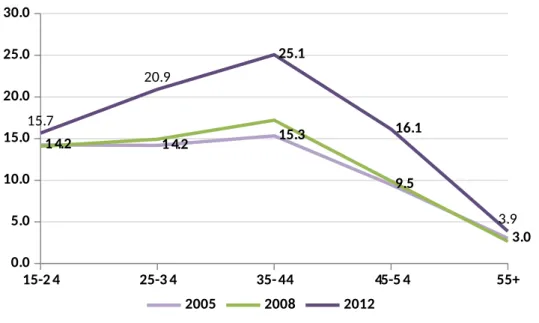
A striking increase in participation of middle-aged women with low education levels
One of the most striking improvements in the female labor market is the unusual increase in the size of unskilled female labor force (women without a high school degree). There are two characteristics of this increase. Firstly, it covers women between 25 and 54, namely that it is substantially widespread. Secondly, it is recorded after 2009 in the post-crisis period. Figure 5 and 6 clearly illustrate that the drastic increase in the labor force participation among middle-aged women has started in 2008. From 2005 to 2008 participation rate of urban females rose from 18.7 to 20.8 percent. During the same period it increased slightly from 11.3 to 11.7 percent for females with less than high school education. In the period of 2008-2012 total participation rate increased from 20.8 to 26.1 percent while
Figure 5: Trend of labor force participation rates of women with less than high school education (Urban, seasonally adjusted)
Jan/ 05 May /05 Sep/ 05 Jan/ 06 May /06 Sep/ 06 Jan/ 07 May /07 Sep/ 07 Jan/ 08 May /08 Sep/ 08 Jan/ 09 May /09 Sep/ 09 Jan/ 10 May /10 Sep/ 10 Jan/ 11 May /11 Sep/ 11 Jan/ 12 May /12 Sep/ 12 Jan/ 13 May /13 Sep/ 13 0.0 5.0 10.0 15.0 20.0 25.0 30.0 35.0 15-24 25-34 35-44 45-54 55+
Source: TurkStat; Betam
Figure 6: Labor force participation rates of women with less than high school education, by age (%,urban) 15-24 25-34 35-44 45-54 55+ 0.0 5.0 10.0 15.0 20.0 25.0 30.0 14.2 14.2 15.3 9.5 3.0 15.7 20.9 25.1 16.1 3.9 2005 2008 2012
Source. TurkStat; Betam
Looking at labor force participation by age groups, participation rate is quite weak among females older than 55 and aged between 15 and 24. On the contrary, participation rate increased by 6.7, 9.8 and 6.6 percent for age groups of "25-34", "35-44" and "45-54" respectively (Figure 6).
In the post-crises period, what are the factors behind this unusual behavioral change of low-educated and mostly married urban women? 7 We have discussed above that the added worker effect that
prevails during economic crisis, remains limited and disappears during periods of high growth. The findings imply that unskilled women in urban areas generally enter employment from inactivity. Part of this transition may be explained by a group of discouraged women entering the labor market as job opportunities increase. Table 7 and 8 represent changes in the number of discouraged women
7 There is no significant change in the share of married and working females with less than high school education in total working women aged between 25 and 54. This share is calculated as 77.2 , 78.4 and 79.4 percent in 2005,2008 and 2012 respectively (in microdata). These numbers indicate that the majority of women who entered the labor market during the period of 2008-2012 is married.
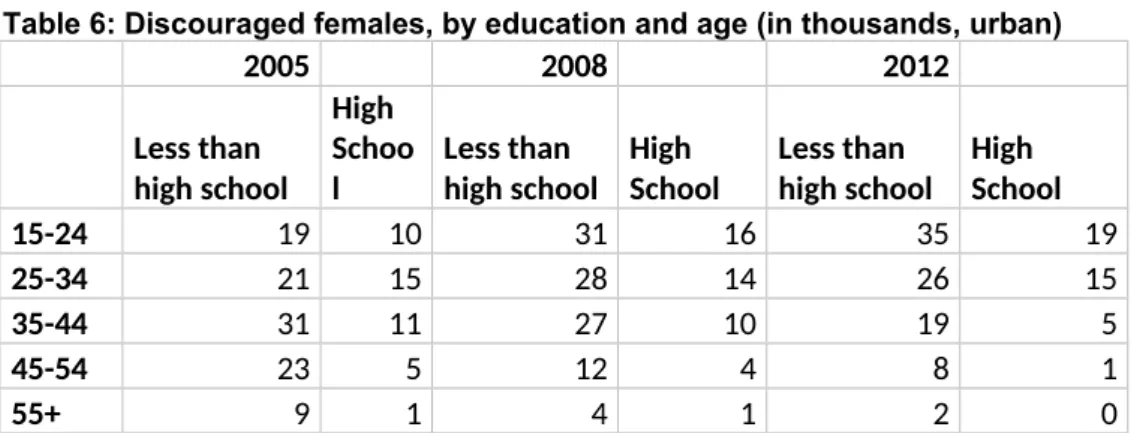
given years.There is no significant decline in the number of discouraged females at high school level (Table 5). On the other hand, the number of discouraged women with less than high school education remained constant in the period of 2005-2008 while it dropped by 13 thousand (12.6 percent) in the period of 2008-2012. As expected, this decrease is significant among women aged between 35 and 54 but amounts are very limited and it would explain only a small part of high increase in employment and labor force in middle-aged and unskilled females.
Table 5: Discouraged females, by education(in thousands, urban) Less than high school High schoo l Higher educa-tion Total 2005 103 41 21 165 2008 102 44 13 159 2012 89 40 9 138
Source: TurkStat; Betam
Table 6: Discouraged females, by education and age (in thousands, urban)
2005 2008 2012 Less than high school High Schoo l Less than high school High School Less than high school High School 15-24 19 10 31 16 35 19 25-34 21 15 28 14 26 15 35-44 31 11 27 10 19 5 45-54 23 5 12 4 8 1 55+ 9 1 4 1 2 0
Source: TurkStat; Betam
The data indicates that the majority of unskilled women in employment in urban areas were previously housewives. We argued above that the highest increase in employment occurred in "Accommodation and food" and "Administrative and support" service activities (Table 2). During the period of 2008-2012 the amount of employment expansion in these two subsectors were 73 thousand and 181 thousand respectively. During the same period, the increase in employment for women with less than high school education is recorded as 525 thousand. It may be that unskilled women employment increase occurred especially in these two subsectors. Note that it is not possible to employ women with less than high school education in other subsectors such as "Education" and “Human Health”.
Summary of findings
In recent years urban labor force and employment has grown simultaneously. Female labor force participation rate in urban areas increased from 18.7 to 26.1 percent and approximately 1 percent point on average per year.
The prominent features of this increase can be summarized as follows:
1. Increases in labor force and employment accelerated after 2008. During the period of 2005-2008 annual average increase in urban labor force was 0.7 points and during the period 2008-2012 it was 1.3 points.
2. Since female labor force and female employment grew simultaneously, urban female unemployment rate decreased slightly.
3. The structural dynamic in labor market is that as women's level of education increases, average labor participation rate increases and thus, labor force and employment expand. Moreover, since in recent years more low-educated and middle-aged women have started to work, an additional dynamic is prevailed.
4. The contribution of added worker effect (incidental to economic crises) remained weak. The majority of women have started to work as formal (registered) wage and salary earners or casual workers.
5. Increasing average retirement age has a significant impact on labor and employment growth, especially for university graduates.
6. Rapid growth in two subsectors of the service industry, i.e. "administrative and support service activities" and "accommodation and food service activities" and the employability of unskilled women in these sectors seem to be behind the increases in labor force and employment in these categories.
If these trends continue in the labor market, Turkey can decrease the gap in female labor force participation with developed countries and thus, stimulate the economic development.
Appendix
A.Table 1: Employment status of formal and informal female employees in selected years (in thousands, urban)
Informal Formal Total Wage and salary earners, casual workers Unpaid family worker Employer or self-employed Total Wage and salary earners, casual workers Unpaid family worker Employer or self-employed 2005 1,105 642 239 224 1,580 1,481 30 69 2008 1,047 624 225 198 2,070 1,954 22 94 2009 1,131 612 219 301 2,121 1,980 43 96 2010 1,263 637 270 355 2,312 2,158 44 111 2011 1,323 698 288 336 2,562 2,382 55 125 2012 1,272 664 289 318 2,921 2,733 60 129 Source: TurkStat
A.Table 2: Labor force participation of women with less than high school education by age (%, urban and total, seasonally adjusted)
Less than High School Urba n Total Urba n Total Urba n Total Urba n Total Urba n Tota l 15-24 15-24 25-34 25-34 35-44 35-44 45-54 45-54 55+ 55+ Jan.05 12.6 20.2 12.5 21.1 14.1 23.8 8.8 21.2 3.0 11.1 Sep.1 3 16.3 19.5 22.1 28.5 28.6 36.0 18.7 29.4 4.4 12.6
Source: TurkStat; Betam
A.Table 3: Labor force participation of women with high school education, by age (%, urban and total, seasonally adjusted)
High School Urba
n Total Urban Total Urban Total Urban Total Urban Total
15-24 15-24 25-34 25-34 35-44 35-44 45-54 45-54 55+ 55+ Jan.05 27.8 28.8 36.7 36.9 32.7 32.8 19.2 19.9 1.4 1.5 Sep.1 3 31.0 31.6 42.6 41.9 39.4 40.6 25.1 25.5 4.8 6.2
Source: TurkStat; Betam
A. Table 4: Labor force participation of highly educated women (%, urban and total, seasonally adjusted)
Higher Education Urba
n Total Urban Total Urban Total Urban Total Urban Total
15-24 15-24 25-34 25-34 35-44 35-44 45-54 45-54 55+ 55+ Jan.05 68.0 69.3 78.5 78.6 79.1 79.0 42.8 42.3 7.5 8.2 Sep.1 3 74.2 72.4 79.8 79.4 80.5 80.3 66.0 65.4 16.7 16.9