STRONG INCREASE IN NON-AGRICULTURAL EMPLOYMENT
Seyfettin Gursel*, Gokce Uysal∗∗ and Aysenur Acar∗∗∗ Executive Summary
According to the labor market statistics released by TurkStat, non-agricultural unemployment rate is 12.4 percent in the period of January 2012. However, we draw attention again to the importance of seasonally adjusted unemployment series in the evaluation of unemployment. Seasonally adjusted labor market data shows that non-agricultural unemployment rate decreased from 11.2 percent to 11.1 percent. According to the seasonally adjusted data, the number of unemployed persons in non-agricultural decreased by 20 thousand compared to the period of December 2012 and decreased by 391 thousand compared to December 2011. Employment in all sectors increased in the period of January 2012 compared to the previous period and the strong increase in service sector continues.
The number of unemployed persons in non-agricultural decreased by 384 thousand compared to previous year
According to the labor market statistics released by TurkStat on the 16th of April, non-agricultural
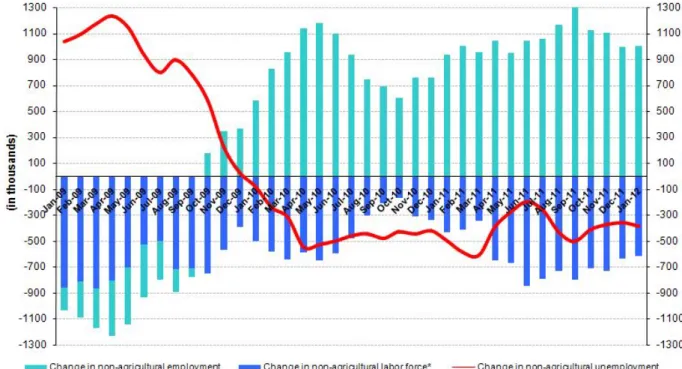
employment has reached 18 million 59 thousand in the period of January 2012 (December – January – February). During the period of January 2012, non-agricultural labor force increased by 615 thousand (3.1 percent), non-agricultural employment increased by 999 thousand (5.9 percent) on a year-on-year basis. The number of unemployed persons in non-agricultural decreased by 384 thousand to 2 million 556 thousand on a year-on-year basis (Figure 1).
Figure 1 Year-on-year changes in non-agricultural labor force, employment and unemployment
Source: TurkStat, Betam
*
Prof. Seyfettin Gürsel, Betam, Director, [email protected]
∗∗ Assoc. Prof. Gökçe Uysal, Betam, Vice Director, gokce.uysal @bahcesehir.edu.tr ∗∗∗ Aysenur Acar, Betam, Research Assistant, [email protected]
Labor Market Outlook:
April 2012
Seasonally adjusted non-agricultural unemployment decreased to 11.1 percent
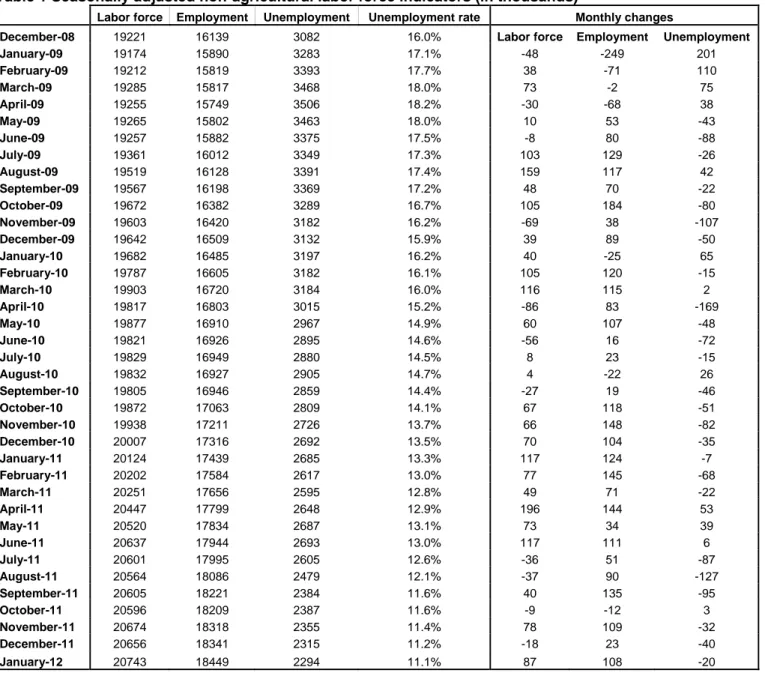
According to seasonally adjusted series, non-agricultural labor force increased by 87 thousand to 20 million 743 thousand in the period of January compared to the period of December 2011 (Figure 2, Table 1). Non-agricultural employment increased by 108 thousand and reached to 18 million 449 thousand. Consequently, the number of unemployed persons in non-agricultural sectors decreased by 20 thousand and seasonally adjusted non-agricultural unemployment rate decreased from 11.2 percent to 11.1 percent.
Figure 2 Seasonally adjusted non-agricultural labor force, employment and unemployment
Source: TurkStat, Betam
According to Kariyer.net data, non-agricultural unemploymentwill be stagnant in the period of February 20121
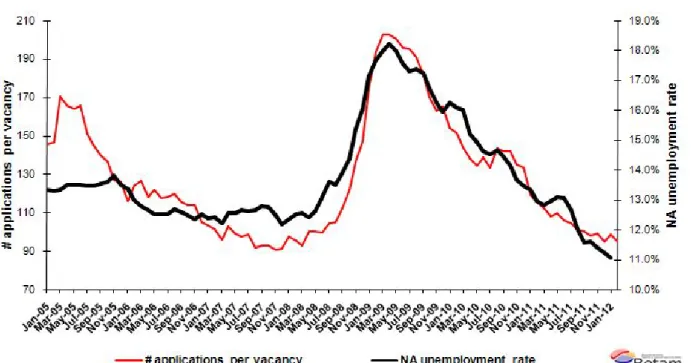
The application per vacancy series released by Kariyer.net indicates a slight decrease in non-agricultural unemployment in February 2012. However, the data pertaining to March 2012 has not been released this month due to technical difficulties.
1
Starting from April, Betam will be using a new series released by Kariyer.net on application per vacancy. A decrease in
applications per vacancy may be caused by an increase in vacancies or by a decrease in the number of applications. An increase in vacancies signals economic growth while decreasing number of applications indicates a decrease in number of people looking for a job. Figure 3 illustrates the seasonally adjusted non-agricultural unemployment rate and deseasonalized calendar day adjusted application per vacancy (Kariyer.net) series.
Figure 3 Non-agricultural unemployment rate and application per vacancy (SA)
Data source: Kariyer.net, TurkStat, Betam
Strong increase in service employment2
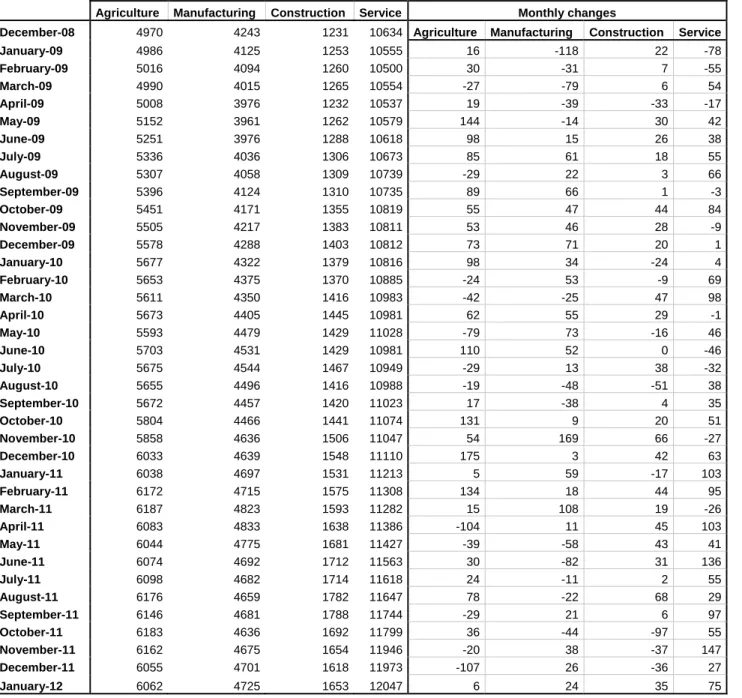
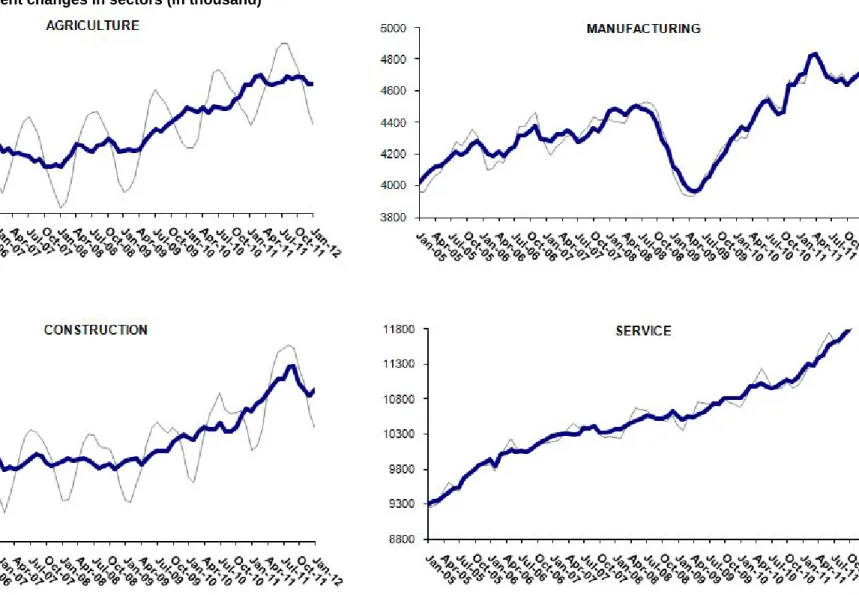
According to seasonally adjusted figures, employment increased in all sectors in the period of January 2012 (Table 2, Figure 4). Employment in manufacturing increased by 24 thousand, while employment in construction increased by 35 thousand. Also, service employment increased by 75 thousand. We think that increase in manufacturing employment will slow down in February 2012 since Industrial Production Index in February 2012 was lower than its December 2011 level. On the other hand, increase in service employment is remarkable. According to the seasonally adjusted data, agricultural employment increased by 6 thousand in the period of January 2012 compared to previous period. There seems to be stagnation in agricultural employment.
2
Seasonal adjustment procedure is applied to each sector of employment series separately. Hence the sum of these series may differ from the seasonally adjusted series of total employment. The difference stems from the non-linearity of the seasonal adjustment process.
Table 1 Seasonally adjusted non-agricultural labor force indicators (in thousands)
Labor force Employment Unemployment Unemployment rate Monthly changes
December-08 19221 16139 3082 16.0% Labor force Employment Unemployment
January-09 19174 15890 3283 17.1% -48 -249 201 February-09 19212 15819 3393 17.7% 38 -71 110 March-09 19285 15817 3468 18.0% 73 -2 75 April-09 19255 15749 3506 18.2% -30 -68 38 May-09 19265 15802 3463 18.0% 10 53 -43 June-09 19257 15882 3375 17.5% -8 80 -88 July-09 19361 16012 3349 17.3% 103 129 -26 August-09 19519 16128 3391 17.4% 159 117 42 September-09 19567 16198 3369 17.2% 48 70 -22 October-09 19672 16382 3289 16.7% 105 184 -80 November-09 19603 16420 3182 16.2% -69 38 -107 December-09 19642 16509 3132 15.9% 39 89 -50 January-10 19682 16485 3197 16.2% 40 -25 65 February-10 19787 16605 3182 16.1% 105 120 -15 March-10 19903 16720 3184 16.0% 116 115 2 April-10 19817 16803 3015 15.2% -86 83 -169 May-10 19877 16910 2967 14.9% 60 107 -48 June-10 19821 16926 2895 14.6% -56 16 -72 July-10 19829 16949 2880 14.5% 8 23 -15 August-10 19832 16927 2905 14.7% 4 -22 26 September-10 19805 16946 2859 14.4% -27 19 -46 October-10 19872 17063 2809 14.1% 67 118 -51 November-10 19938 17211 2726 13.7% 66 148 -82 December-10 20007 17316 2692 13.5% 70 104 -35 January-11 20124 17439 2685 13.3% 117 124 -7 February-11 20202 17584 2617 13.0% 77 145 -68 March-11 20251 17656 2595 12.8% 49 71 -22 April-11 20447 17799 2648 12.9% 196 144 53 May-11 20520 17834 2687 13.1% 73 34 39 June-11 20637 17944 2693 13.0% 117 111 6 July-11 20601 17995 2605 12.6% -36 51 -87 August-11 20564 18086 2479 12.1% -37 90 -127 September-11 20605 18221 2384 11.6% 40 135 -95 October-11 20596 18209 2387 11.6% -9 -12 3 November-11 20674 18318 2355 11.4% 78 109 -32 December-11 20656 18341 2315 11.2% -18 23 -40 January-12 20743 18449 2294 11.1% 87 108 -20
Table 2 Seasonally adjusted sector of employment (in thousands)
Agriculture Manufacturing Construction Service Monthly changes
December-08 4970 4243 1231 10634 Agriculture Manufacturing Construction Service
January-09 4986 4125 1253 10555 16 -118 22 -78 February-09 5016 4094 1260 10500 30 -31 7 -55 March-09 4990 4015 1265 10554 -27 -79 6 54 April-09 5008 3976 1232 10537 19 -39 -33 -17 May-09 5152 3961 1262 10579 144 -14 30 42 June-09 5251 3976 1288 10618 98 15 26 38 July-09 5336 4036 1306 10673 85 61 18 55 August-09 5307 4058 1309 10739 -29 22 3 66 September-09 5396 4124 1310 10735 89 66 1 -3 October-09 5451 4171 1355 10819 55 47 44 84 November-09 5505 4217 1383 10811 53 46 28 -9 December-09 5578 4288 1403 10812 73 71 20 1 January-10 5677 4322 1379 10816 98 34 -24 4 February-10 5653 4375 1370 10885 -24 53 -9 69 March-10 5611 4350 1416 10983 -42 -25 47 98 April-10 5673 4405 1445 10981 62 55 29 -1 May-10 5593 4479 1429 11028 -79 73 -16 46 June-10 5703 4531 1429 10981 110 52 0 -46 July-10 5675 4544 1467 10949 -29 13 38 -32 August-10 5655 4496 1416 10988 -19 -48 -51 38 September-10 5672 4457 1420 11023 17 -38 4 35 October-10 5804 4466 1441 11074 131 9 20 51 November-10 5858 4636 1506 11047 54 169 66 -27 December-10 6033 4639 1548 11110 175 3 42 63 January-11 6038 4697 1531 11213 5 59 -17 103 February-11 6172 4715 1575 11308 134 18 44 95 March-11 6187 4823 1593 11282 15 108 19 -26 April-11 6083 4833 1638 11386 -104 11 45 103 May-11 6044 4775 1681 11427 -39 -58 43 41 June-11 6074 4692 1712 11563 30 -82 31 136 July-11 6098 4682 1714 11618 24 -11 2 55 August-11 6176 4659 1782 11647 78 -22 68 29 September-11 6146 4681 1788 11744 -29 21 6 97 October-11 6183 4636 1692 11799 36 -44 -97 55 November-11 6162 4675 1654 11946 -20 38 -37 147 December-11 6055 4701 1618 11973 -107 26 -36 27 January-12 6062 4725 1653 12047 6 24 35 75
Figure 4 Employment changes in sectors (in thousand)3
Source: TurkStat, Betam
3