REMARKABLE INCREASE IN UNEMPLOYMENT
Seyfettin Gürsel
*Gökçe Uysal
∗∗and Ayşenur Acar
∗∗∗Abstract
Seasonally adjusted labor market data shows that non-agricultural unemployment rate increased from 12 percent
in the period of June 2013 to 12.5 percent in the period of July 2013. We observe strong declines in both
manufacturing and construction and a slight increase in service employment. Hence, the increase in
non-agricultural employment weakens, failing to compensate for the strong increases in labor force.
Decline in non-agricultural employment
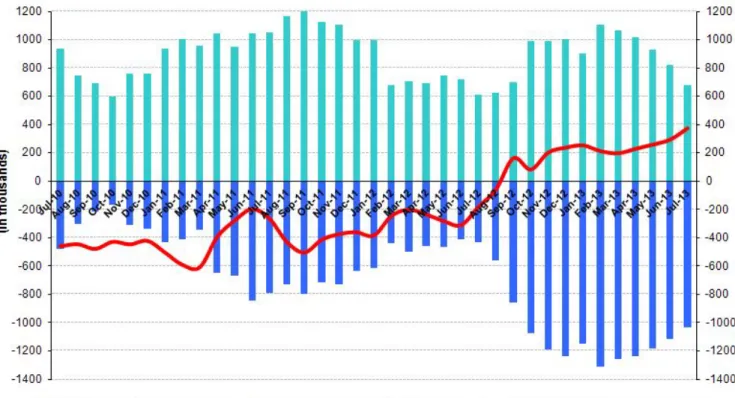
According to the data released by TurkSTAT, non-agricultural labor force increased by 1 million 37 thousand (4.9
percent) and non-agricultural employment increased by 682 thousand (3.6 percent) in the period of July 2013
(Figure 1). We observe that the strong increases in agricultural labor force continue, while the increase in
non-agricultural employment weakens. Consequently, the number of persons unemployed in non-non-agricultural sectors
increased by 372 thousand (16.5 percent).
Figure 1 Year-on-year changes in non-agricultural labor force, employment and unemployment
Source: TurkSTAT, Betam
* Prof. Dr. Seyfettin Gürsel, Betam, Director, [email protected]
∗∗ Yrd. Doç. Dr. Gökçe Uysal, Betam, Vice Director, [email protected] ∗∗∗ Ayşenur Acar, Betam, Research Assistant, [email protected]
Labor Market Outlook:
October 2013
www.betam.bahcesehir.edu.tr
2
Strong increase in non-agricultural unemployment
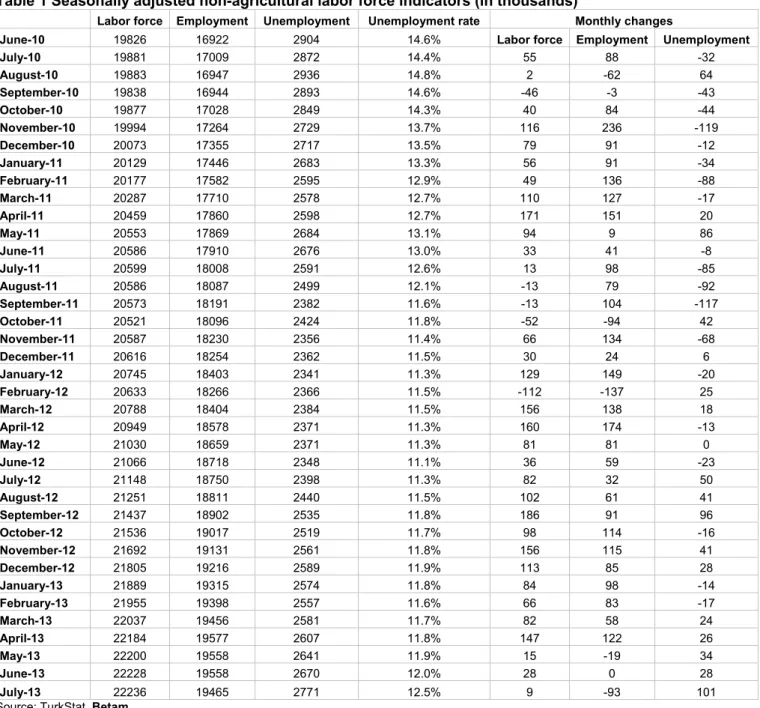
According to seasonally adjusted data, non-agricultural labor force increased by 9 thousand in the period of July
2013 compared to the period of June 2013 and reached 22 million 236 thousand (Figure 2, Table 1).
Non-agricultural employment decreased by 93 thousand and reached 19 million 465 thousand. Consequently, the
number of persons unemployed in non-agricultural sectors increased by 101 thousand and non-agricultural
unemployment rate increased from 12 percent in June 2013 to 12.5 percent in July 2013. This marks the highest
unemployment rate in the last two years.
Figure 2 Seasonally adjusted non-agricultural labor force, employment and unemployment
Source: TurkStat, Betam
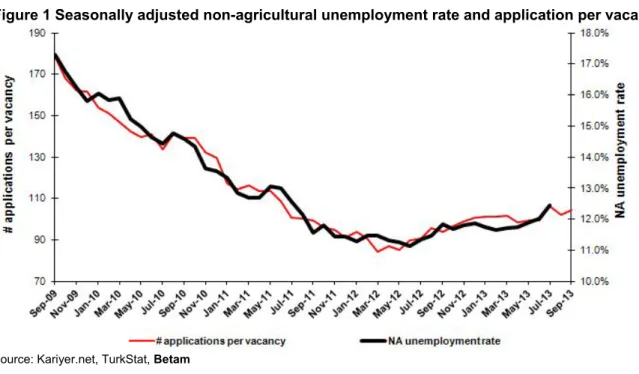
According to Kariyer.net data, non-agricultural unemployment will stagnate in the period of
September 2013
Seasonally adjusted applications per vacancy statistics calculated using Kariyer.net
1series indicate that
non-agricultural unemployment will stagnate in the period of September 2013.
Figure 1 Seasonally adjusted non-agricultural unemployment rate and application per vacancy
Source: Kariyer.net, TurkStat, Betam
1 Betam has been calculating application per vacancy using series released by Kariyer.net for a while. Seasonal and calendar adjustment
procedure is applied to application per vacancy series. A decrease in applications per vacancy may be caused by an increase in vacancies or by a decrease in the number of applications. An increase in vacancies signals economic growth while decreasing number of applications indicates a decrease in number of people looking for a job.
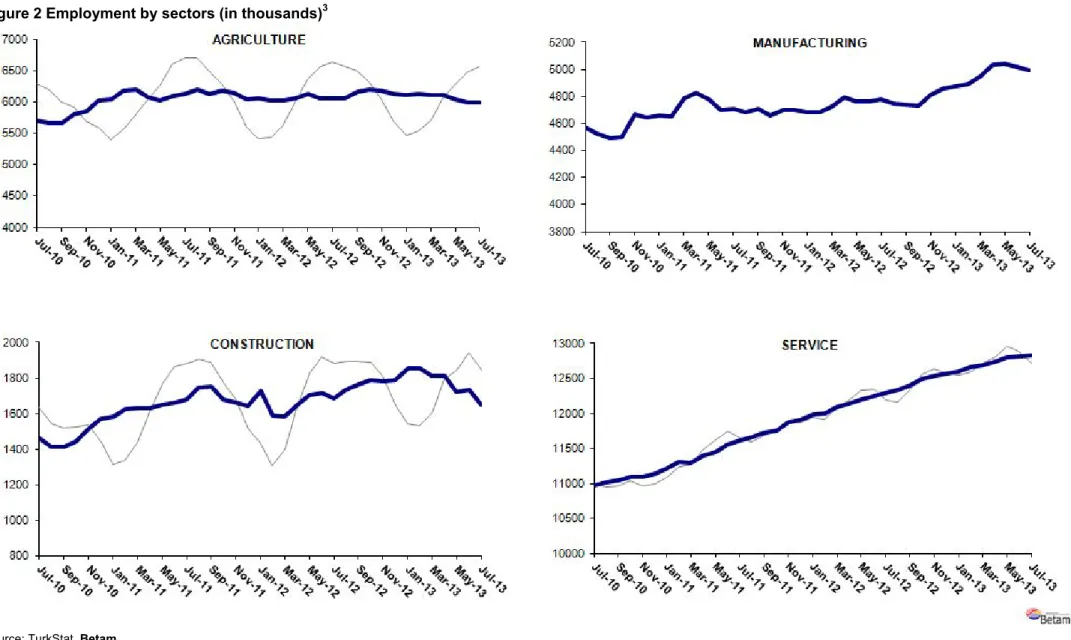
Employment losses in both manufacturing and construction sector
According to seasonally adjusted labor market series, we observe employment losses in both manufacturing and
construction sector (Table 2, Figure 4).
2Manufacturing employment decreased by 24 thousand, while construction
employment decreased by 80 thousand in the period of July 2013 compared to the period of June 2013. Also, we
observe that the increase in service sector weakens. Note that the average monthly employment increase in
services was about 50 thousand for the past year. However, service employment increased by only 12 thousand in
the period of July 2013. Agricultural employment decreased in the period of November 2012.
2 Employment in each sector is seasonally adjusted separately. Hence the sum of these series may differ from the seasonally adjusted series of
www.betam.bahcesehir.edu.tr
4
Figure 2 Employment by sectors (in thousands)
3Source: TurkStat, Betam
Table 1 Seasonally adjusted non-agricultural labor force indicators (in thousands)
Labor force Employment Unemployment Unemployment rate Monthly changes
June-10 19826 16922 2904 14.6% Labor force Employment Unemployment
July-10 19881 17009 2872 14.4% 55 88 -32 August-10 19883 16947 2936 14.8% 2 -62 64 September-10 19838 16944 2893 14.6% -46 -3 -43 October-10 19877 17028 2849 14.3% 40 84 -44 November-10 19994 17264 2729 13.7% 116 236 -119 December-10 20073 17355 2717 13.5% 79 91 -12 January-11 20129 17446 2683 13.3% 56 91 -34 February-11 20177 17582 2595 12.9% 49 136 -88 March-11 20287 17710 2578 12.7% 110 127 -17 April-11 20459 17860 2598 12.7% 171 151 20 May-11 20553 17869 2684 13.1% 94 9 86 June-11 20586 17910 2676 13.0% 33 41 -8 July-11 20599 18008 2591 12.6% 13 98 -85 August-11 20586 18087 2499 12.1% -13 79 -92 September-11 20573 18191 2382 11.6% -13 104 -117 October-11 20521 18096 2424 11.8% -52 -94 42 November-11 20587 18230 2356 11.4% 66 134 -68 December-11 20616 18254 2362 11.5% 30 24 6 January-12 20745 18403 2341 11.3% 129 149 -20 February-12 20633 18266 2366 11.5% -112 -137 25 March-12 20788 18404 2384 11.5% 156 138 18 April-12 20949 18578 2371 11.3% 160 174 -13 May-12 21030 18659 2371 11.3% 81 81 0 June-12 21066 18718 2348 11.1% 36 59 -23 July-12 21148 18750 2398 11.3% 82 32 50 August-12 21251 18811 2440 11.5% 102 61 41 September-12 21437 18902 2535 11.8% 186 91 96 October-12 21536 19017 2519 11.7% 98 114 -16 November-12 21692 19131 2561 11.8% 156 115 41 December-12 21805 19216 2589 11.9% 113 85 28 January-13 21889 19315 2574 11.8% 84 98 -14 February-13 21955 19398 2557 11.6% 66 83 -17 March-13 22037 19456 2581 11.7% 82 58 24 April-13 22184 19577 2607 11.8% 147 122 26 May-13 22200 19558 2641 11.9% 15 -19 34 June-13 22228 19558 2670 12.0% 28 0 28 July-13 22236 19465 2771 12.5% 9 -93 101
Source: TurkStat, Betam
6
Table 2 Seasonally adjusted employment by sector (in thousands)
Agriculture Manufacturing Construction Service Monthly changes
June-10 5723 4536 1409 10977 Agriculture Manufacturing Construction Service
July-10 5691 4575 1458 10977 -31 39 49 0 August-10 5667 4525 1412 11011 -24 -50 -46 34 September-10 5660 4489 1413 11042 -7 -36 1 32 October-10 5793 4498 1444 11086 133 9 31 44 November-10 5846 4667 1512 11085 53 169 68 -2 December-10 6028 4642 1567 11146 182 -25 55 61 January-11 6032 4656 1580 11210 4 14 13 64 February-11 6177 4652 1626 11305 144 -4 45 95 March-11 6194 4790 1628 11291 18 138 3 -13 April-11 6077 4828 1630 11402 -117 38 2 111 May-11 6029 4777 1649 11443 -48 -51 19 41 June-11 6098 4697 1661 11552 69 -80 12 109 July-11 6120 4710 1680 11618 22 13 19 66 August-11 6196 4682 1746 11659 76 -28 67 40 September-11 6134 4707 1754 11730 -61 25 8 71 October-11 6170 4657 1682 11758 36 -50 -73 28 November-11 6146 4700 1658 11872 -24 43 -23 114 December-11 6045 4701 1644 11910 -102 1 -15 38 January-12 6050 4685 1727 11992 6 -16 83 82 February-12 6030 4684 1587 11996 -20 -1 -140 4 March-12 6022 4721 1583 12099 -8 37 -3 104 April-12 6058 4792 1650 12136 36 71 66 37 May-12 6120 4760 1704 12195 62 -32 54 58 June-12 6061 4761 1712 12245 -59 1 8 50 July-12 6061 4778 1684 12288 0 17 -28 43 August-12 6061 4745 1732 12335 0 -33 47 47 September-12 6159 4735 1762 12405 99 -10 30 71 October-12 6194 4732 1787 12498 34 -3 25 92 November-12 6177 4814 1783 12534 -16 82 -3 36 December-12 6130 4856 1790 12570 -47 42 7 36 January-13 6107 4870 1852 12593 -23 14 62 23 February-13 6131 4886 1857 12654 24 16 6 61 March-13 6114 4948 1812 12695 -17 62 -45 41 April-13 6102 5030 1812 12735 -12 82 0 39 May-13 6040 5044 1718 12796 -62 14 -94 61 June-13 5985 5015 1731 12812 -55 -29 13 16 July-13 5984 4991 1651 12824 -1 -24 -80 12