1
Detection of air leakage into vacuum packages
using acoustic measurements and estimation of
defect size
This is a post-refereeing final draft. When citing,
please refer to the published version:
H. Koruk, K.Y. Sanliturk, Detection of air leakage
into vacuum packages using acoustic measurements
and estimation of defect size, Mechanical Systems
and Signal Processing. 114, 528-538, 2019.
2
Detection of air leakage into vacuum packages using acoustic
measurements and estimation of defect size
Hasan Koruka,+,*, Kenan Y. Sanliturkb,x
aMEF University, Mechanical Engineering Department, 34396 Istanbul, Turkey
bIstanbul Technical University, Mechanical Engineering Department, 34437 Istanbul, Turkey
+[email protected], x[email protected]
*Corresponding author. Tel.: +902123953654; fax: +902123953692.
Abstract
Air leakages in food and ingredient packages which are sealed in vacuum environments may cause a marked deterioration of the product, leading to a loss of functionality. Manufacturers of such products have very stringent but rather costly quality control procedures and there is a pressing need for developing more economical ways of automated quality control techniques to test the vacuum packages reliably. However, due to the fact that the defect size of a typical package with a leakage problem could be micro- or nano-scale, such faults are not detectable using conventional techniques. In this paper, the performance of a proposed acoustic method is assessed for the detection of air leakage in instant dry yeast packages sealed in a vacuum environment, which are typical of food and ingredients packaged under vacuum conditions. The investigation is carried out in both laboratory and in-situ environments. The acoustic pressure created by leaking air into the faulty packages is measured using a low-noise microphone in an acoustic chamber. Faulty packages are then identified using the changes in measured sound pressure levels within a certain frequency band. A mathematical model is also proposed to predict the pressure inside a yeast package with certain defect size as a function of time. The mathematical model is then used to determine the size of a defect causing the leakage, using the time required for the pressure inside a faulty yeast
3 the art measurement techniques, it is possible to detect packages with leakage problem if the
diameter of the defect is greater than a few tens of micrometres.
Keywords: Vacuum packaging; air leakage; fault detection; acoustic measurements; defect size. 1. Introduction
Removing air from packages just before the sealing operation, which is known as vacuum packaging, is widely used in the food sector [1-2] to protect and to extend the shelf life of food products. Air leakages in those food packages, may cause a marked deterioration of the product, leading to a loss of functionality [3]. Manufacturers of such products have very stringent but rather costly quality control procedures to avoid yet more costly returns from their customers. There is a pressing need for developing routine automated quality control techniques to test the vacuum packages reliably and cheaply. However, due to the fact that the defect size of a typical package with a leakage problem could be micro- or nano-scale without any gas flow out of a package in the case of vacuum packaging, such faults are not detectable using conventional quality control
techniques. Although the information about the fault sizes in a production line is quite valuable for optimising manufacturing processes, this information is not readily attainable via practical
measurement methods. Furthermore, to the best of authors’ knowledge, there is no available mathematical models for the prediction of air leakage into faulty vacuum packages containing ingredients.
There have been some studies for the detection of leakages in packages using the biotest [4] and ultrasonic imaging [5] techniques. However, these techniques are for evaluating the integrity of sample food packages and not suitable to detect the air leakages immediately after the packaging process at the end of the production line. Acoustic and vibration signals are also utilised for leak detection in some applications including leakages in pipes [6-10] which may cause huge economic losses. Both simulated and measured data are used in the literature to understand the mechanism of air leakage generation [11-12]. Furthermore, different signal processing techniques such as Short
4 Time Fourier transform (STFT), Wavelet transform (WT), and Hilbert Huang transforms (HHT) are exploited to extract valuable information from acoustic signals propagating from a leakage [13-16]. A survey of literature on this subject reveals that most of the relevant studies in the literature are directed towards detecting leakages in pipelines, hence there is a real need for a practical technique capable of detecting air leakages in packages sealed in vacuum environment. In this paper, the detection of air leakages into yeast packages using acoustic measurements in an acoustic chamber is explored and a mathematical model is presented to estimate the amount of possible air leakages in faulty packages.
The faulty packages behave like an externally pressurised mechanical system which emits acoustic signal while air leaks into the system from very small-sized defects. It should be remembered that the defect size of a typical package with a leakage problem could be micro- or even nano-scale and the fraction of faulty packages in a typical yeast packaging line is very small. Therefore, it is decided to explore the sound propagated from faulty packages with known
(artificially created) defect sizes in laboratory environment first. It is also aimed to develop a mathematical model for the prediction of the pressure inside a yeast package with a certain defect size as a function of time. Accordingly, the investigation in this paper is carried out using the following steps. (i) First, faulty packages with known defect sizes are artificially created and sound pressure generated by the leaking air into the package is measured in laboratory environment using a low-noise microphone and an acoustic chamber. (ii) The sound signals collected from packages with and without leakages are processed to detect the faulty packages. (iii) Then, a mathematical model based on sonic and subsonic flow is presented to predict the pressure inside a yeast package with certain defect sizes as a function of time. (iv) The mathematical model is used to establish a relationship between the time required for the pressure inside a faulty yeast package to reach to a threshold (detectable) level and the possible size of the defect causing the leakage. (v) Finally, in an attempt to detect the faulty packages, similar acoustic measurements are carried out in a factory environment at the end of the production line. The results of this investigation show that, using the
5 current state of the art measurement techniques, it is possible to detect packages with leakage
problem if the size of the defect is greater than a few tens of micrometres.
2. Test rig and measurement parameters
An acoustic chamber with interior dimensions of 300 mm x 450 mm x 500 mm is designed to measure the sound pressure generated by yeast packages with leakage problem. Although the details are not presented here for brevity, the acoustic chamber is designed to have high transmission loss level, compatible with the low noise microphone used in the measurements. Overall, the acoustic chamber has a few layers which are made of steel, lead and acoustic foam, with a total wall thickness of about 120 mm. The interior surface of the acoustic chamber is made of steel sheet to increase the reverberation effect inside the chamber. The transmission loss of the acoustic chamber is measured to be about 40 dB for the frequency range of interest (i.e., for 0.7 Hz – 12.8 kHz).
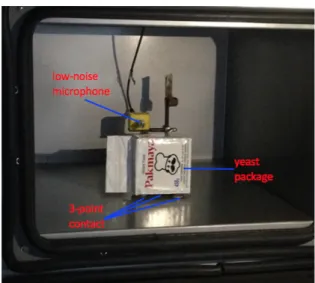
A low-noise microphone with a sensitivity of 1211.6 mV/Pa (Brüel & Kjær Type 4955) is used to measure the sound pressure originated from leaking air into the faulty yeast packages. A picture showing a sample package and the microphone inside the acoustic chamber is presented in Fig. 1. The yeast packages are placed inside the chamber using three contact points so as to minimise the possibility of unpredictable sound generation due to macro- or micro-slip friction contacts. A high-precision data acquisition system (Brüel & Kjær Type 3050 A 040) is used to collect microphone data. For the in-situ measurements, the specially designed acoustic chamber mentioned above is positioned inside a larger acoustic chamber with interior dimensions of about 2 m x 2 m x 2 m. After a large number of preliminary trial tests, adequate measurement parameters are determined to be as listed in Table 1.
6 Fig. 1. A sample yeast package with 3-point contact and a low-noise microphone inside an acoustic chamber.
Table 1. Measurement parameters.
Frequency span 0.7 Hz - 12.8 kHz
Frequency resolution 4 Hz
Overlap %66.67
Windowing function Hanning
Number of averages 150
Measurement period 12.67 s
3. Laboratory simulations
The preliminary study, presented in this section, is aimed to assess the performance of the proposed method in the case of known defect sizes in laboratory environment. For this purpose, a micro-sized hole with different diameters is created on individual yeast packages to simulate a faulty package. Then, immediately after the fault is created, the faulty package is inserted inside the acoustic chamber shown in Fig.1 and sound pressure measurements are made. Holes with specific diameters are created using some circular gauges (needles) with diameters of 450, 300, 200 and 150 µm. It should be stated that, using the tools available in these simulations, it was not possible to create a hole on a yeast package with a diameter less than 150 µm. Three sample packages are created for each fault diameter.
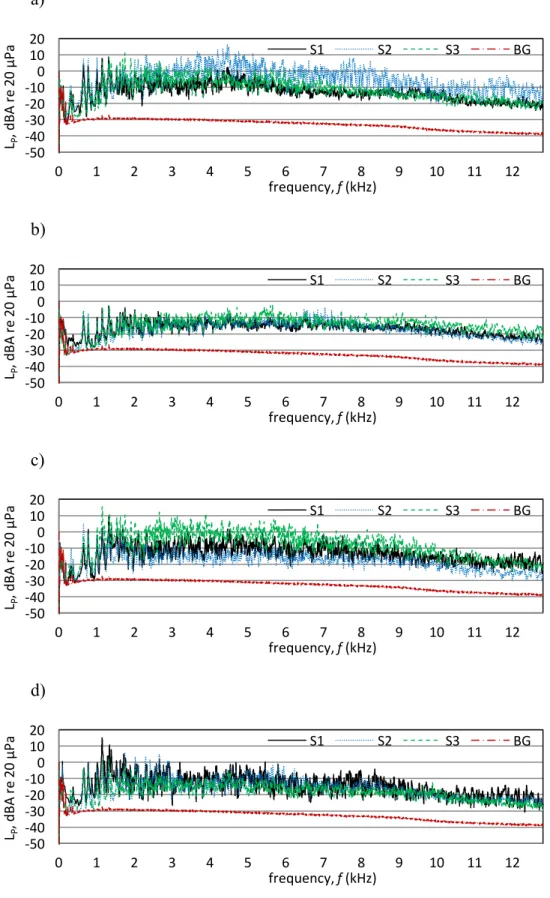
7 The measurements are performed using the parameters in Table 1. The collected time domain data is converted to frequency domain using FFT-Fast Fourier Transform. The sound pressure spectrums for the three samples (S1, S2, and S3) and the background noise (BG) for various defect diameters are presented in Fig. 2. It is seen that all the faulty packages generate sound pressure levels much higher than that of the BG noise over a wide frequency range, up to 12.8 kHz. The average background noise level (or the sound pressure level measured for a package with no fault) is determined to be Lp = -32.8 dBA. On the other hand, the average sound pressure levels generated
by the yeast packages with corresponding defect diameters of 450, 300, 200 and 150 µm are measured as Lp = -10.1, -16.3, -13.2 and -16.1 dBA, respectively. The most significant outcome of
these tests is the fact that the sound pressure levels generated by all the faulty packages are much higher than the background noise level. Another point worth noting in these results is that although the trends are similar, the sound pressure levels generated by the package samples with nominally identical fault size can exhibit some deviations from each other. One of the reasons for this is possibly due to not being able to create exactly the same faults with the same size manually using a gauge with circular cross section.
8 a)
b)
c)
d)
Fig. 2. Background noise and the sound pressure levels for the three packages with a defect diameter of (a) 450, (b) 300, (c) 200 and (d) 150 µm.
-‐50 -‐40 -‐30 -‐20 -‐100 10 20 0 1 2 3 4 5 6 7 8 9 10 11 12 LP , d BA re 2 0 µP a frequency, f (kHz) S1 S2 S3 BG -‐50 -‐40 -‐30 -‐20 -‐100 10 20 0 1 2 3 4 5 6 7 8 9 10 11 12 LP , d BA re 2 0 µP a frequency, f (kHz) S1 S2 S3 BG -‐50 -‐40 -‐30 -‐20 -‐100 10 20 0 1 2 3 4 5 6 7 8 9 10 11 12 LP , d BA re 2 0 µP a frequency, f (kHz) S1 S2 S3 BG -‐50 -‐40 -‐30 -‐20 -‐100 10 20 0 1 2 3 4 5 6 7 8 9 10 11 12 LP , d BA re 2 0 µP a frequency, f (kHz) S1 S2 S3 BG
9 After creating the artificial faults, the elapsed times required for faulty packages to ingest
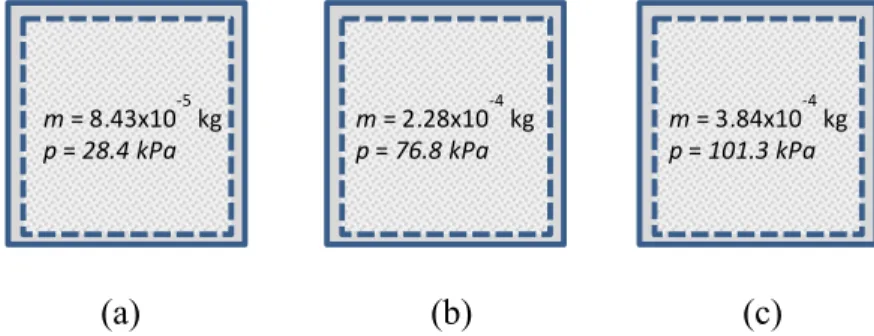
sufficient amount of air inside so that the internal pressure of the packages reaches a value at which they are considered softened is also determined experimentally. For this purpose, three conditions presented in Fig. 3 are first identified utilising the deal gas law given by 𝑝𝑉 = 𝑚𝑅𝑇 where 𝑅 = 287.1 J/kg-K is the gas constant and 𝑝, 𝑉 and 𝑇 represent the pressure, volume and temperature of the gas (air), respectively. It should be stated that the interior pressure for yeast packages just after vacuum packaging without any air leakage in this study is 𝑝 = 28.4 kPa. The atmospheric pressure and temperature are taken as 𝑝, = 101.3 kPa and 𝑇 = 293.2 K. The maximum amount of air volume at atmospheric pressure and temperature can possibly leak into a package is determined by injecting known amount air inside a package using a syringe and found to be 𝑉 = 250 ml. Then, the initial amount of air mass inside a package at 𝑝 = 28.4 kPa and 𝑉 = 250 ml is determined to be 𝑚 = 8.43x10⁻⁵ kg using the ideal gas law (Fig. 3a). The amount of air leakage necessary for a
package to be detected manually as faulty is also investigated. It is determined, experimentally, that about 120 ml of air at atmospheric pressure and temperature should leak into a package in order for that package to get softened enough so as to be identified as faulty by a human operator via manual touching. So, the total mass (the initial mass plus the mass of the injected 120 ml of air) of air and the pressure inside the package for this case are calculated to be 𝑚 = 2.28x10⁻⁴ kg and 𝑝 = 76.8 kPa
(Fig. 3b). The total mass of the air when the pressure inside a package is equal to ambient pressure is 𝑚 = 3.84x10⁻⁴ kg (Fig. 3c).
10
(a) (b) (c)
Fig. 3. Three states of a leaking package and the corresponding air mass inside a package: (a) pressure just after vacuum packaging, (b) pressure being equal to the threshold level at which a package is manually detected as faulty and (c) pressure being equal to ambient pressure.
The time period required for a faulty package to get soft (i.e., the internal pressure reaches 𝑝 = 76.8 kPa) is referred to as softening time in this paper. The values of the experimentally determined softening times for packages with different defect diameters are listed in Table 2. However, it must be stated here that the softening times listed in Table 2 are very likely to have significant levels of uncertainty, possibly plus/minus a few seconds, due to the fact that whether a package is softened or not is decided by subjective measures of an operator.
Table 2. The values of the experimentally determined softening times for packages with different defect diameters.
Defect Diameter (µm) 150 200 300 450
Softening Time (s) 120 80 40 10
The results obtained here for the yeast packages with defect dimeters in the order of hundreds of micrometres are thought to be quite promising, confirming that the faulty packages with
aforementioned defect sizes can be clearly identified and separated from packages without faults using acoustic measurements. However, the defect sizes in practice are expected to be much smaller than the simulated values here, resulting in the so-called softening times much longer than a few
m = 8.43x10-‐5 kg p = 28.4 kPa m = 2.28x10 -‐4 kg p = 76.8 kPa m = 3.84x10 -‐4 kg p = 101.3 kPa
11 minutes observed for the artificially damaged or pricked packages used in the tests so far. It is therefore necessary to assess the performance of the acoustic test methodology described here in actual manufacturing environments of these packages. However, before doing so, it is decided to establish a mathematical model for the theoretical prediction of the defect size for a given softening time. In what follows, a mathematical model for air flow/leak into a food package through an orifice is presented first. The tests carried out in a factory environment using the yeast packages just after the sealing operation in vacuum in a production line are described afterwards in Section 5.
4. Theoretical predictions
4.1 Theory
The experimental tests presented above provided some empirical data about the defect size and the time required for the pressure inside the package to approach to a threshold level at which a package is considered softened (faulty) in the case of laboratory simulations. However, in real applications, i.e., in the tests in factory environments, the only available information that can be collected is the elapsed time for the pressure inside a faulty package to reach to a threshold level. Although the information about the fault sizes in a production line is quite valuable for optimising manufacturing processes, this information is not readily attainable via practical measurement methods. This section aims to provide a theoretical means of indirectly estimating possible defect sizes using the so-called softening time.
In a vacuum environment, if the sealing operation is not 100% successful, the air starts to leak into the package as soon as the package is removed from vacuum chamber and put in an
environment at atmospheric pressure. There are some conventional methods to model the gas discharge through an orifice or nozzle from a pressurized container [17-18]. In our problem here, however, the flow is in reverse direction, i.e., instead of a discharge process, the flow is a filling process of air into a package as illustrated in Fig. 4. The gas release process (for both discharge and filling) is a transient phenomenon and the mass flow rate depend on many parameters including the
12 upstream and downstream pressures and temperatures of the gas. However, in certain cases, this process can be simplified into the classical models and, in general, the flow is identified as the critical (choked) or sub-critical (non-choked) flow based on the pressure ratio p/p0 where p and p0
represent pressures downstream and upstream of an orifice in the literature [18-19]. When the pressure ratio is higher than a critical value given in Eq. (1) below, the flow is identified as choked sonic flow, resulting in maximum mass flow rate [17].
31∗ 4 = 5 678 9 9:; (1) Here p* is known as the critical pressure. The mass flow rate for sonic conditions is expressed as follows in the literature [17-20]:
𝑚< = =34 >4𝑐@ 6 A 1 + 6C8 5 CE 9:;9D; (2) where A is the cross-sectional area of the orifice (defect), 𝑝, and 𝑇, are pressure and temperature upstream of the orifice, respectively, R is the gas constant, and Cd is discharge coefficient
representing the effect of flow non-uniformity on mass flow rate. Discharge coefficient is defined as the ratio of the actual mass flow rate to the one-dimensional isentropic mass flow rate [18, 20].
The mass flow rate for sonic case (i.e., for 𝑝 ≤ p∗) is determined using Eq. (2) and then the mass
accumulated in the package is determined as:
𝑚 𝑡 = 𝑚, + ,J𝑚I𝑑𝑡 for 𝑡 ≤ t∗ (3)
where 𝑚, is the initial mass inside the package at t = 0 and 𝑡∗ represents the time when 𝑝 = 𝑝∗.
Since 𝑚I is constant for the choked flow, the time 𝑡∗ for 𝑝 = p∗ can be determined by:
𝑡∗ =M 3N3∗ CM4
MO (4)
13
Fig. 4. The schematic showing the filling of air into a package.
Different from sonic case, the mass flow rate during discharge of a gas from a container for subsonic case (i.e., for 𝑝 > p∗) depend on both interior and exterior pressures and it is given in the
literature [18-19] as: 𝑚II 𝑝 = =34 6A>4𝐶@ 56E 6C8 3 34 E 9 1 − 3 34 9:; 9 (5)
In this paper, Eq. (5) is used to calculate the mass flow rate during the filling process of air into a package for subsonic conditions. Accordingly, the mass accumulated during the filling/leaking process of air into a package is obtained as the sum of the initial mass, mass accumulated during the choked flow and the mass accumulated during the subsonic flow:
𝑚 𝑡 = 𝑚, + 𝑚It∗+ 𝑚 II J
S∗ 𝑑𝑡 for 𝑡 > t∗ (6)
As can be seen from Eq. (5), the calculation of 𝑚II requires both interior and ambient pressures. This required performing the integration in Eq. (6) using small time increments. The steps carried out to establish the time dependent mass flow rate and pressure inside a faulty package can be summarised as: (i) determine the mass flow rate at a given/known internal pressure using Eq. (2) or Eq. (5); (ii) calculate the total accumulated mass via Eq. (6); and (iii) determine the resulting pressure using the ideal gas law.
hole with a dimeter d
control volume Food (yeast)
particles Air inside a package with mass m, pressure p, density 𝜌 and volume V
Ambient pressure p0 and
ambient temperature T0
14 In what follows, the mathematical model presented above is used to predict the mass flow rate and the pressure inside a yeast package with certain defect sizes as a function of time. In addition, the theoretical model is validated using experimental data.
4.2 Results
The critical pressure ratio and the critical pressure are determined according to Eq. (1) as 𝑝∗ 𝑝
, = 0.528 and 𝑝∗ = 53.5 kPa using 𝛾 = 1.4 for air, the air mass inside a package at critical
pressure is calculated using the ideal gas law as 𝑚 𝑝 = p∗ = 15,9x10CZ kg. Using Eq. (4), the
elapsed times for the internal pressure to reach to the critical pressure, i.e., 𝑝 = p∗ = 53.5 kPa, are
determined as 𝑡∗ = 17.68, 9.95, 4.42 and 1.96 s corresponding to defect diameters of 150, 200, 300
and 450 𝜇m, respectively. The mass flow rate as a function of time for different defect diameters using 𝐶@ = 1 is presented in Fig. 5. The mass flow rates for individual defect sizes are constant for
sonic conditions and decrease as a function of time for subsonic conditions as expected. The interior pressure as a function of time for different defect diameters using 𝐶@ = 1 is presented in Fig. 6. It is clear that the time to reach a specific pressure decreases dramatically as defect diameter increases.
Fig. 5. The mass flow rate as a function of time for different defect diameters (-.- 150 µm, --- 200 µm, … 300 µm and — 450 µm). 0,E+00 5,E-‐06 1,E-‐05 2,E-‐05 2,E-‐05 3,E-‐05 3,E-‐05 4,E-‐05 4,E-‐05 0 5 10 15 20 25 30 35 40 45 50 55 60 65 70 75 ma ss fl ow ra te (k g/ s) time (s)
15 Fig. 6. The pressure inside the package as a function of time for different defect diameters (-.- 150 µm, --- 200 µm, … 300 µm and — 450 µm).
Results in Fig. 6 shows that the elapsed time for the pressure inside a faulty package to reach to the aforementioned threshold level (i.e., 76.8 kPa) at which the package is considered softened is shorter than the empirical softening time presented in Table 1. Significantly shorter values for the predicted elapsed times are actually expected, due to the fact that the air flow is not actually through an ideal orifice. The packages studied in this paper contain yeast particles hence, in addition to the classical resistance of the orifice itself to the flow, the yeast particles on the downstream side provide additional resistance against air flow. The discharge coefficient Cd is used to tune the
theoretical mass flow rates in the literature [18, 20]. Considering the measured elapsed time for the pressure inside a faulty package to reach the threshold level, the value of Cd is determined to be
about 0.25 in order to bring the theoretical predictions closer to the actual values. After using the appropriate value of Cd, the predicted pressure inside the package as a function of time for different
defect diameters is presented in Fig. 7. The experimental results obtained using artificially created defects with known defect sizes are also included in Fig. 7 as individual markers. It is seen that a good correlation is obtained between the experimental data and the predictions when the proposed model is used. 0,E+00 2,E+04 4,E+04 6,E+04 8,E+04 1,E+05 1,E+05 0 5 10 15 20 25 30 35 40 45 50 55 60 65 70 75 pr es sur e (P a) time (s)
16 Fig. 7. The pressure inside the package as a function of time obtained for the tuned value of
discharge coefficient and different defect diameters (Prediction: -.- 150 µm, --- 200 µm, … 300 µm and — 450 µm; Experiments: 150 µm, ◊ 200 µm, ∆ 300 µm and O 450 µm).
Results in Fig. 7 shows that the predictions match very well with the empirical data and this makes it possible to indirectly estimate the defect size if the so-called softening time is known. This approach is used to estimate the effective defect size (approximated via effective hole diameter) for a faulty package with a specific softening time in the next section where the results of in-situ measurements are presented.
5. In-situ measurements
It should be stated here that the fraction of faulty packages in a typical yeast packaging line is very small; typically less than 0.1%. Nevertheless, all packages are routinely checked prior to shipment to detect and discard such packages, thus increasing production costs. However, for the purposes of this study, it is necessary to ensure that there will be a sufficient number of defective packages in order to be able to make reliable performance assessment of the acoustic measurement procedure proposed here. Well over one thousand packages were tested acoustically first, and checked manually afterwards.
0,E+00 2,E+04 4,E+04 6,E+04 8,E+04 1,E+05 1,E+05 0 25 50 75 100 125 150 175 200 225 250 275 300 pr es sur e (P a) time (s)
17 For in-situ measurements, the acoustic chambers are placed in a manufacturing line and the acoustic measurements are carried out on individual samples inside the acoustic chambers. It is worth stating that the tests are not performed for all the packages produced in a production line. Instead, a sample is taken from the production line, acoustic pressure measurement is carried out and then another sample is taken from the production line to do the same. After the acoustic measurements are performed, the tested yeast packages are stored and periodically controlled manually, so as to find out whether they are actually faulty or not. The results of these manual tests revealed that one of the yeast packages was defected, which became soft 35 minutes after the sealing operation in vacuum while none of the other yeast packages became soft within 12 hours.
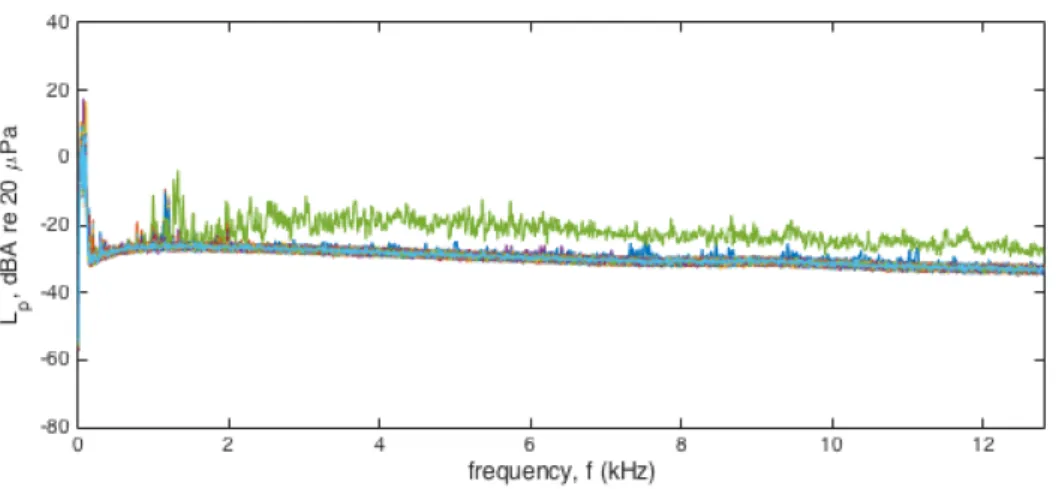
The measured sound pressure spectra for the tested yeast packages are presented in Fig. 8. The results undoubtedly show that one of the signals belonging to the faulty package is very different from others. In Fig. 9, the spectra of the pressure signals of three packages, one of which belongs the faulty one, are compared with the average spectrum obtained by averaging all the measured spectrums. In these comparisons, the spectrums are filtered to remove small oscillations in the spectrums so as to highlight the differences between the spectrums of faulty and healthy packages. It is seen that the spectrum of a package in Fig. 9(a) is almost the same as the average spectrum, and the spectrum for a package in Fig. 9(b) is slightly different than the average one. However, the spectrum for the package in Fig. 9(c), which belongs to the faulty package (softened 35 minutes after the packaging process completed) is very different than the average spectrum, allowing one to identify the faulty package from acoustic signal with no doubt.
18 Fig. 8. The measured sound pressure spectra for tested yeast packages.
Fig. 9. Comparison of the sound pressure spectra of three packages (one of which is faulty) and the average spectrum (red dash line): (a) almost the same as the average, (b) slightly different than the average and (c) much different than the average (faulty package).
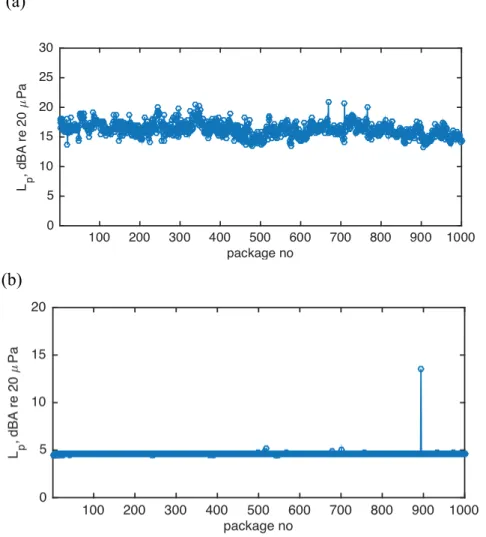
The total sound pressure levels for the individual packages within a frequency range 1 Hz - 12.8 kHz are plotted in Fig. 10a. Unfortunately, the total sound pressure levels of the individual packages
(a)
(b)
19 seem to be quite close to each other; hence, it is not possible to differentiate the faulty package using the total sound pressure levels. Inspection of the pressure spectra revealed however that acoustic signals contained higher levels of environmental noise at lower frequencies. Therefore, it is decided to supress or eliminate low frequency components of the acoustic signal and focus on the sound propagated from yeast packages between 2 kHz to 12 kHz. After this operation, the total sound pressure level corresponding to the frequency range from 2 kHz to 12.8 kHz is plotted again in Fig. 10b. The results now show very clearly again that the acoustic signal of one of the packages is very different than the others, and the package being different from others is the one which became soft 35 minutes after the packaging process. It is seen that the sound pressure level of the faulty package is very noticeably higher than the average sound pressure.
(a)
(b)
Fig. 10. The total sound pressure level for individual yeast packages: a) 1 Hz – 12.8 kHz and b) 2 kHz – 12.8 kHz.
20 As in the laboratory simulations, it is seen that the faulty package creates high-frequency sounds (i.e., from 2 kHz to 12.8 kHz), and filtering low frequency component provides easy detection of the faulty packages. This result has practical implications in the sense that it is a very challenging task to block low-frequency noise (i.e., < 1-2 kHz) in a factory environment.
It is important to state here that there were about a dozen yeast packages which were manually identified as faulty (became soft) more than 12 hours after the sealing or manufacturing operation. However, the measured acoustic signals yield no indication of these packages being defected. These results show that the current methodology is not capable of detecting the majority of the faulty packages which may have extremely small effective defect sizes. This situation also demands for additional research on this topic, including the assessment of the applicability of various
techniques using different advanced signal processing methods such as STFT and WT [6-10, 13-14].
Finally, the theoretical approach presented in Section 4 is used to estimate the effective defect size (approximated via effective hole diameter) for a faulty package with a softening time of 35 minutes, yielding the fault diameter to be about 38.6 µm. The calculated interior pressure as a function of time for this defect diameter is presented in Fig. 11. The effective defect size for a faulty package with a softening time of 12 hours, on the other hand, is predicted to be about 8.5 µm. The results show that a yeast package with a defect diameter of a few micrometres is predicted to have a softening time of more than 12 hours and the proposed acoustic method using the current state of art hardware is unable to detect faulty packages with such small size defects.
21 Fig. 11. The change of the pressure inside the package with a defect diameter of 38.6 µm.
6. Conclusions
Detection of air leakage into vacuum yeast packages is investigated in this study using laboratory and in-situ acoustic measurements. Faulty packages are identified using sound pressure
measurements in an acoustic chamber. A mathematical model is proposed to simulate air leakage of a package. Overall, the performance of a proposed acoustic method is assessed for the detection of air leakage in instant dry yeast packages sealed in a vacuum environment, which are typical of food and ingredients packaged under vacuum conditions. The main conclusions are:
§ Laboratory simulations show that yeast packages with a leakage diameter of
approximately 150 micrometres and larger can be easily identified using the acoustic measurements.
§ The mass flow rate and pressure change inside a yeast package can be predicted using a simplified mathematical model based on sonic and subsonic gas flows. The size of the defect using the experimentally measured time required for the pressure inside a faulty yeast package to reach to a threshold level causing the leakage can be predicted using the same mathematical model.
0,E+00 2,E+04 4,E+04 6,E+04 8,E+04 1,E+05 1,E+05 0 500 1000 1500 2000 2500 3000 3500 4000 4500 pr es sur e (P a) time (s)
22 § The in-situ measurements show that packages with softening period of about half an hour
after the sealing process in vacuum or packages with a leak diameter of a few tens of micrometres can, in principle, be detected using a low-noise microphone. The proposed method using the current state of the art hardware is unable to detect defects with a few micrometres in diameter.
§ The faulty packages propagate high-frequency sound (i.e., from 2 kHz to 12.8 kHz) hence filtering the low frequency components of the signal below 2 kHz noise is recommended for fault detection purposes.
To the best knowledge of the authors, this study is the first in the literature attempting to identify air leakages in packages sealed in vacuum environment using acoustic measurements and to model air leaking into vacuum packages. Although there are currently some limitations, the results are encouraging for real-life applications. It is believed that acoustic measurements can be exploited further for detection or identification of micro- and nano-sized defects for automated quality control purposes.
Acknowledgments
The authors acknowledge Pakmaya for sponsoring this study and providing the samples. We also greatly acknowledge Prof. Dr. Mehmet İmregun for all his support, guidance and recommendations during this work. Our special thanks are also to Mr. Yusuf Dönmez, Mr. Erdinç Tüller and Mr. Yalçın Özel of Pakmaya İzmit plant for their contributions in performing the experiments.
References
[1] G.L. Robertson, Food Packaging Principles and Practice, 3rd ed., Taylor & Francis/CRC Press, FL, 2013.
[2] C.E. Realini, B. Marcos, Active and intelligent packaging systems for a modern society, Meat Science, 98(3) (2014) 404-419.
23 [3] A. Tull, Food & Nutrition, Oxford University Press, Oxford, 1996.
[4] Y.S. Song, W.A. Hargraves, Postprocess contamination of flexible pouches challenged by in situ immersion biotest, Journal of Food Protection 61(12) (1998) 1644-1648.
[5] A. Ozguler, S.A. Morris, Jr. W. D. O'brien, Ultrasonic imaging of micro leaks and seal
contamination in flexible food packages by the pulse-echo technique, Journal of Food Science 63(4) (1998) 673-678.
[6] M.F. Ghazali, S.B.M. Beck, J.D. Shucksmith, J.B. Boxall, W.J. Staszewskic, Comparative study of instantaneous frequency based methods for leak detection in pipeline networks, Mechanical Systems and Signal Processing 29 (2012) 187-200.
[7] S. Li, Y. Wen, P. Li, J. Yang, X. Dong, Y. Mu, Leak location in gas pipelines using cross-time-frequency spectrum of leakage-induced acoustic vibrations, Journal of Sound and Vibration 333 (2014) 3889–3903.
[8] X. Yu, W. Liang, L. Zhang, H. Jin, J. Qui, Dual-tree complex wavelet transform and SVD based acoustic noise reduction and its application in leak detection for natural gas pipeline, Mechanical Systems and Signal Processing 72-73 (2016) 266-285.
[9] S.T.N. Nguyen, J. Gong, M.F. Lambert, A.C. Zecchin, A.R. Simpson, Least squares
deconvolution for leak detection with a pseudo random binary sequence excitation, Mechanical Systems and Signal Processing 99 (2018) 846-858.
[10] L. Meng, L. Yuxing, W. Wuchang, F. Juntao, Experimental study on leak detection and location for gas pipeline based on acoustic method, Journal of Loss Prevention in the Process Industries 25 (2012) 90-102.
[11] C. Liu, Y. Li, L. Meng, W. Wang, F. Zhao, J. Fu, Computational fluid dynamic simulation of pressure perturbations generation for gas pipelines leakage, Computers & Fluids, 119 (2015), 213-223.
[12] C. Liu, Y. Li, L. Meng, W. Wang, F. Zhang, Study on leak-acoustics generation mechanism for natural gas pipelines, Journal of Loss Prevention in the Process Industries, 32 (2014), 174-181.
24 [13] N.F. Adnan, M.F. Ghazali, M. Amin, A. Malik, A. Ariffin, Leak detection in MDPE gas
pipeline using dual-tree complex Wavelet transform, Australian Journal of Basic and Applied Sciences, 8(15) (2014), 356-360.
[14] N.F. Adnan, M.F. Ghazali, M.M. Amin and A.M.A. Hamat, Leak detection in gas pipeline by acoustic and signal processing – A review, IOP Conf. Series: Materials Science and Engineering 100 (2015) 012013.
[15] F. Wang, W. Lin, Z. Liu, S. Wu, X. Qiu, Pipeline leak detection by using time-domain statistical features, IEEE Sensors Journal 17(19) (2017), 6431 – 6442.
[16] J. Sun, Q. Xiao, J. Wen, F. Wang, Natural gas pipeline small leakage feature extraction and recognition based on LMD envelope spectrum entropy and SVM, Measurement 55 (2014) 434–443. [17] H. Daneshyar, One-Dimensional Compressible Flow, Pergamon Press, Oxford, 1976.
[18] M.J. Zucrow, J.D. Hoffman, Gas Dynamic Volume I, John Wiley & Sons, New York, 1976. [19] L.X. Jia, L. Wang, Equations for gas releasing process from pressurized vessels
in ODH evaluation, AIP Conf. Proc. 613 (2002) 1792-1798.
[20] S.D. Morris, Discharge coefficients for choked gas—liquid flow through nozzles and orifices and applications to safety devices, Journal of Loss Prevention in the Process Industries 3(3) (1990) 303-310.