PHOSPHOLIPID FATTY ACID COMPOSITION OF RAT, RABBIT, HUMAN
AND DOG PLASMA
SIÇAN, TAVŞAN, iNSAN VE KÖPEK PLAZMA FOSFOLIPİDLERİNİN YAĞ
ASİDİ KOMPOZiSYONU
Bilgehan DOĞRU PEKİNER
Ankara University, Faculty of Pharmacy, Department of Biochemistry,
06100, Tandoğan-Ankara, TURKEY.
ABSTRACT
The purpose of this study was to investigate and compare the fatty acids of plasma phospholipids
in rat, rabbit, human and dog. The prominent fatty acids of phospholipids in the species were Ci^.o, C18o,
C/s:i, Ci8:2 and C20;4. Fatty acids generally decreased in the following order: SFA (Saturated fatty
acids)>MUFA (monounsaturated fatty acid)>PUFA (polyunsaturated fatty acid) with little exceptions.
PUFA was higher in PE (phosphatidyl ethanolamine) and PC (phosphatidyl choline) and PUFA>MUFA
in rabbit and human plasma, whereas PUFA was higher in PC and PS in dog and in PI, PC and SPH in
rat. Cis:i was higher than the other MUFA.. Among PUFA C18:2 was higher and arachidonate (C20:4) was
lower in rabbit compared to other species. Cl8:2 was major PUFA and C2o:4 was the second one mainly
in PC and PE and followed by PS (phosphatidyl serine), PI (phosphatidyl inositol) and SPH
(sphingomyelin) in all of the species. Others (C20:2,Ci8:3, C2o:3 and C20:s) were less than % 0.1 in dog and
also present in very small amounts in rat. These PUFA were present in PE and PC in rabbit and as well
as in the other phospholipids in human. LCPUFAs (long chain polyunsaturated fatty acids )were not
present in dog and rat had small amouts ofC22:4 in PC
Key Words: plasma phospholipid fatty acids, species.
ÖZET
Çalışmanın amacı rat, tavşan, insan ve kopek gibi farklı türlerde plazma fosfolipidlerinin yağ
asitlerini tayin etmek ve kiyaslamaktır. Türlerin fosfolipid yağ asitleri başlıca C/e.o, C/8:0, C!8[], Ci8:2 ve
(~<2o-4 dir.
Fosfolipid yağ asidi bir kaç istisna dışında genellikle şu sekilde azalmaktadır: SFA (doymuş yağ
asidi)>MUFA (tekli doymamış yağ asidi)>PUFA (çoklu doymamış yağ asidi). PUFA PE (fosfatidil
etanolamin) ve PC (fosfatidil kolin) de yüksek düzeydedir ve tavşan ve insan plazmasında PUFA yüzdesi
MUFA ya göre fazladır. Öte yandan PUFA köpekde PC ve PS(fosfatidil serin) de ve ratda ise PI
(fosfatidil inozitol), PC ve SPH (sfmgomiyelin) de yüksek bulunmuştur. Cl8:l diğer MUFA ye kiyasla
fazlaydı. PUFA içinde Ci8:2 tavşanda diğer türlerle kıyaslanıldığında yüksek ve C20:4 ise düşüktü. Cl8:2
major PUFA olup C20:4 bunu takip etti. Buyağ asitleri bütün türlerde başlıca PC ve PE de ve müteakiben
PS, PI ve SPH de konsantre olmustu, Diğer PUFA (Ci8:3, C20:2, C20.-3 ve C20:s) köpekde 0.1 % den azdı ve
ratda da cok küçük miktarlardaydı. Bu PUFA tavşanda PE ve PC de ve aynı zamanda insanlarda diğer
fosfolipidlerde bulundu. Köpekde LCPUFA (uzun zincirli çoklu doymamış yağ asitleri) yokdu ve rat PC
de C22:6 çok azdı.
in PI and PC (0.7 %). Ci
S:2 was the major PUFA in plasma phospholipids, being highest in PC
(28 %) and SPH (25 %) and 12 - 15 % in the others. The percentage of C,
8:3
was 0.5 - 1.7 %
being highest in PI. One of the other main PUFA's was C20.4 - It was found to be higher in PC
(14 %), 1 - 4 % in the other phospholipids and not present in SPH. C22:6 was only present in PC
(0.7 %).
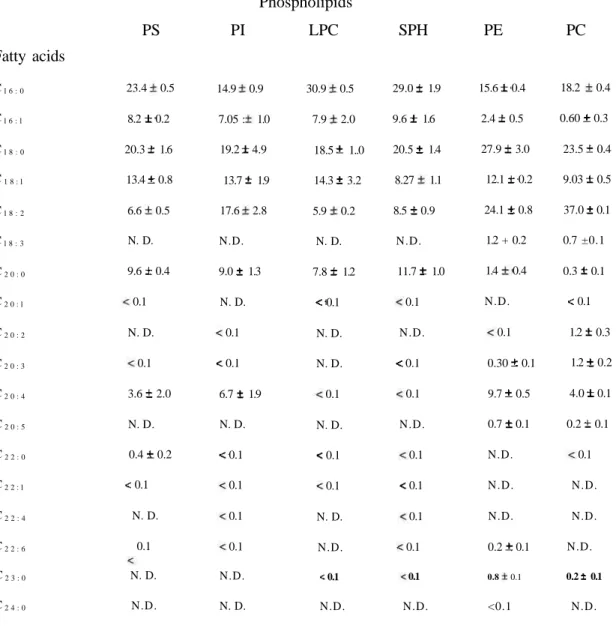
Table 1. Fatty acid composition of phospholipids of rabbit plasma
Phospholipids
PS PI LPC SPH PE PC
Values are percentages of total.
N.D.: Not detected.
Each value represents the mean ± S.E.M. of three individuals.
Fatty acids
Cl 6 : 0
Cl 6 : l
Cl 8 : 0
C1 8 : l
Cl 8 : 2
Cl 8 : 3
C2 0 : 0
C2 0 : l
C2 0 : 2
C2 0 : 3
C2 0 : 4
C2 0 : 5
C2 2 : 0
C2 2 : l
C2 2 : 4
C2 2 : 6
C2 3 : 0
C2 4 : 0
23.4 0.5
8.2 0.2
20.3 1.6
13.4 0.8
6.6 0.5
N. D.
9.6 0.4
0.1
N. D.
0.1
3.6 2.0
N. D.
0.4 0.2
0.1
N. D.
0.1
N. D.
N.D.
14.9 0.9
7.05 : 1.0
19.2 4.9
13.7 1.9
17.6 2.8
N.D.
9.0 1.3
N. D.
0.1
0.1
6.7 1.9
N. D.
0.1
0.1
0.1
0.1
N.D.
N. D.
30.9 0.5
7.9 2.0
18.5 1..0
14.3 3.2
5.9 0.2
N. D.
7.8 1.2
0.1
N. D.
N. D.
0.1
N. D.
0.1
0.1
N. D.
N.D.
0.1
N.D.
29.0 1.9
9.6 1.6
20.5 1.4
8.27 1.1
8.5 0.9
N.D.
11.7 1.0
0.1
N.D.
0.1
0.1
N.D.
0.1
0.1
0.1
0.1
0.1
N.D.
15.6 0.4
2.4 0.5
27.9 3.0
12.1 0.2
24.1 0.8
1.2 + 0.2
1.4 0.4
N.D.
0.1
0.30 0.1
9.7 0.5
0.7 0.1
N.D.
N.D.
N.D.
0.2 0.1
0.8 0.1
<0.1
18.2 0.4
0.60 0.3
23.5 0.4
9.03 0.5
37.0 0.1
0.7 ±0.1
0.3 0.1
0.1
1.2 0.3
1.2 0.2
4.0 0.1
0.2 0.1
0.1
N.D.
N.D.
N.D.
0.2 0.1
N.D.
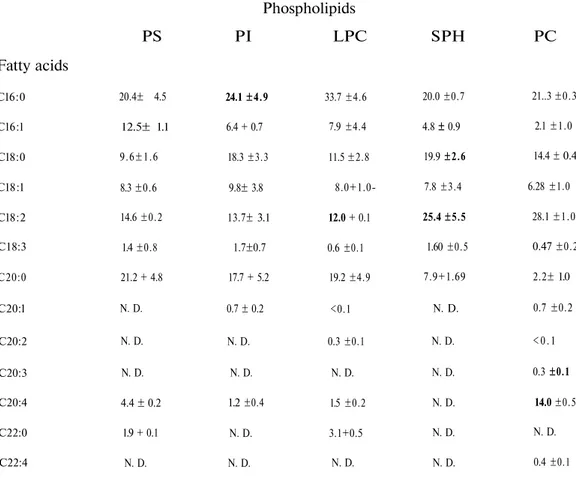
Table 2. Fatty acid composition of phospholipids of rat plasma
Phospholipids
PS PI LPC SPH PC
Values are percentages of total.
N.D.: Not detected.
Each value represents the mean ± S.E.M. of three individuals.
Fatty acids
Cl6:0
Cl6:l
Cl8:0
Cl8:l
Cl8:2
C18:3
C20:0
C20:l
C20:2
C20:3
C20:4
C22:0
C22:4
20.4± 4.5
12.5± 1.1
9.6±1.6
8.3 ±0.6
14.6 ±0.2
1.4 ±0.8
21.2 + 4.8
N. D.
N. D.
N. D.
4.4 ± 0.2
1.9 + 0.1
N. D.
24.1 ±4.9
6.4 + 0.7
18.3 ±3.3
9.8± 3.8
13.7± 3.1
1.7±0.7
17.7 + 5.2
0.7 ± 0.2
N. D.
N. D.
1.2 ±0.4
N. D.
N. D.
33.7 ±4.6
7.9 ±4.4
11.5 ±2.8
8.0+1.0-12.0 + 0.1
0.6 ±0.1
19.2 ±4.9
<0.1
0.3 ±0.1
N. D.
1.5 ±0.2
3.1+0.5
N. D.
20.0 ±0.7
4.8 ± 0.9
19.9 ±2.6
7.8 ±3.4
25.4 ±5.5
1.60 ±0.5
7.9+1.69
N. D.
N. D.
N. D.
N. D.
N. D.
N. D.
21..3 ±0.3
2.1 ±1.0
14.4 ± 0.4
6.28 ±1.0
28.1 ±1.0
0.47 ±0.2
2.2± 1.0
0.7 ±0.2
< 0 . 1
0.3 ±0.1
14.0 ±0.5
N. D.
0.4 ±0.1
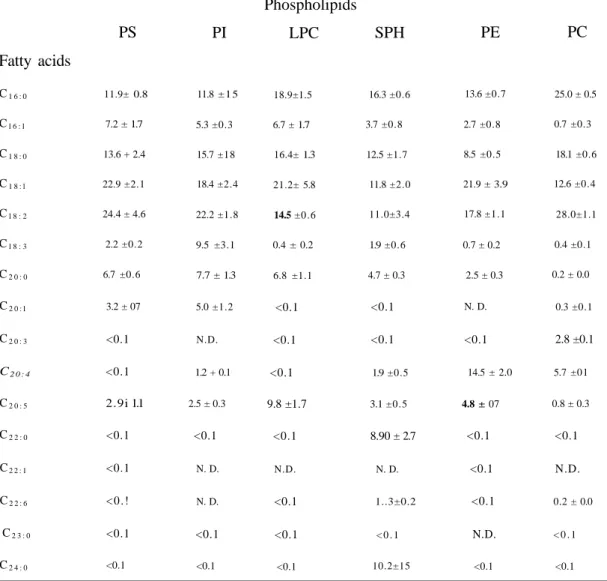
Table 3. Fatty acid composition of phospholipids of human plasma
Values are percentages of total.
N.D.: Not detected.
Each legend represents the mean ± S.E.M. of three individuals.
Fatty acids
C1 6 : 0
Cl 6 : l
C1 8 : 0
C1 8 : l
Cl 8 : 2
Cl 8 : 3
C2 0 : 0
C2 0 : l
C2 0 : 3
C2 0 : 4
C2 0 : 5
C2 2 : 0
C2 2 : 1
C2 2 : 6
C2 3 : 0
C2 4 : 0
PS
11.9± 0.8
7.2 ± 1.7
13.6 + 2.4
22.9 ±2.1
24.4 ± 4.6
2.2 ±0.2
6.7 ±0.6
3.2 ± 07
<0.1
<0.1
2.9i 1.1
<0.1
<0.1
< 0 . !
<0.1
<0.1
PI
11.8 ± 1 5
5.3 ±0.3
15.7 ±18
18.4 ±2.4
22.2 ±1.8
9.5 ±3.1
7.7 ± 1.3
5.0 ±1.2
N.D.
1.2 + 0.1
2.5 ± 0.3
<0.1
N. D.
N. D.
<0.1
<0.1
Phospholipids
LPC
18.9±1.5
6.7 ± 1.7
16.4± 1.3
21.2± 5.8
14.5 ±0.6
0.4 ± 0.2
6.8 ±1.1
<0.1
<0.1
<0.1
9.8 ±1.7
<0.1
N.D.
<0.1
<0.1
<0.1
SPH
16.3 ±0.6
3.7 ±0.8
12.5 ±1.7
11.8 ±2.0
11.0±3.4
1.9 ±0.6
4.7 ± 0.3
<0.1
<0.1
1.9 ±0.5
3.1 ±0.5
8.90 ± 2.7
N. D.
1..3±0.2
< 0 . 1
10.2±15
PE
13.6 ±0.7
2.7 ±0.8
8.5 ±0.5
21.9 ± 3.9
17.8 ±1.1
0.7 ± 0.2
2.5 ± 0.3
N. D.
<0.1
14.5 ± 2.0
4.8 ± 07
<0.1
<0.1
<0.1
N.D.
<0.1
PC
25.0 ± 0.5
0.7 ±0.3
18.1 ±0.6
12.6 ±0.4
28.0±1.1
0.4 ±0.1
0.2 ± 0.0
0.3 ±0.1
2.8 ±0.1
5.7 ±01
0.8 ± 0.3
<0.1
N.D.
0.2 ± 0.0
< 0 . 1
<0.1
Fattv acids
C1 6 : 0
C6 : l
C1 8 : 0
C1 8 : l
C1 8 : 2
C2 0 : 0
C2 0 : l
C2 0 : 2
C2 0 : 3
C2 0 : 4
PS
22.8 ± 3.8
1.8±0.8
11.1 ±0.4
11.3 + 05
14.2 ±0.4
10.4 ±07
0.3 ±0.1
N. D
N. D.
6.9±18
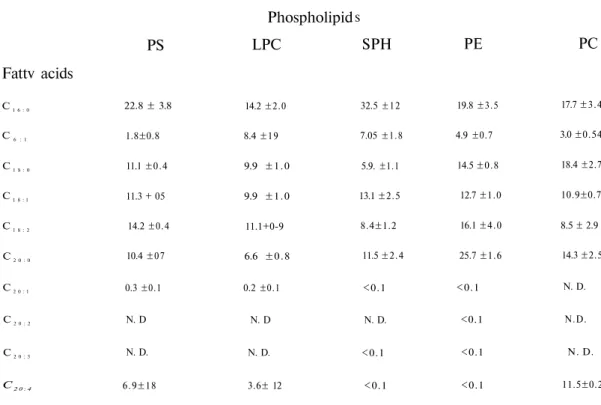
Phospholipid
LPC
14.2 ±2.0
8.4 ±19
9.9 ±1.0
9.9 ±1.0
11.1+0-9
6.6 ±0.8
0.2 ±0.1
N. D
N. D.
3.6± 12
S
SPH
32.5 ±12
7.05 ±1.8
5.9. ±1.1
13.1 ±2.5
8.4±1.2
11.5 ±2.4
<0.1
N. D.
<0.1
<0.1
PE
19.8 ±3.5
4.9 ±0.7
14.5 ±0.8
12.7 ±1.0
16.1 ±4.0
25.7 ±1.6
<0.1
<0.1
<0.1
<0.1
PC
17.7 ±3.4
3.0 ±0.54
18.4 ±2.7
10.9±0.7
8.5 ± 2.9
14.3 ±2.5
N. D.
N.D.
N. D.
11.5±0.2
Table 4. Fatty acid composition of phospholipids of dog plasma
Values are percentages of total.
N.D.: Not detected.