Received by the editors: September 12, 2018; Accepted: November 01, 2018.
Key word and phrases: Visual analysis, social media, image features, refugees, Turkey.
© 2018 Ankara University Communications Faculty of Sciences University of Ankara Series A2-A3: Physical Sciences and Engineering
ACTIVITIES IN TURKEY
ABDULLAH BULBUL and SALAH HAJ ISMAIL
Abstract. The population of refugees in Turkey is significantly growing since 2014 and it has already exceeded three millions. This situation urges to study their conditions and issues as well as their opinions. In this study, we propose a method to analyze the dataset collected from social media accounts of refugees in Turkey in a textual and visual manner. Firstly, we acquire social media activities of refugees, and then we make textual analysis for which the results are presented using word clouds. Finally, for the most significant words obtained from the textual analysis, we perform a visual analysis to find out the most representative image or a group of images shared in social networks. The association between textual and visual results enhances their perceptibility and help decreasing the ambiguity of inferences over analysis results. We experimented with different scenarios and suggested several methods to enhance computational and qualitative results.
1. Introduction
Millions of Syrian refugees were forced to leave their country due to seven years of war in Syria. According to official statistics [1], 3.5 million of them live, study, and work in Turkey. Fostering the mutual understanding and dialogue between the hosting and the guest communities will contribute to both communities in various aspects such as social, economic, and educative ones. Today, social media is considered as one of the main platforms where people express their feelings, opinions and needs with a possible effect on real communities. It is regarded as one of the accelerators of the Arab spring and its usage have accompanied majority of the events [2]. Thus, having a dataset of refugees’ activities in Turkey, and developing methods to analyse it effectively, have the potential to facilitate a number of useful future studies.
“A picture is worth ten thousand words”, as the historical Arab philosopher “Alnafri” said [3]. This famous sentence states the significant power of images on communication and comprehension. Nevertheless, most of the social network analyses are based on textual information, in which case, it becomes difficult to understand the underlying meaning of the results out of their context. Accompanying the results with additional cognitive elements, such as auditory or visual items, potentially decreases their ambiguity.
Moreover, some languages, Arabic for instance, leads to less comprehensible results because of the difficulty in stemming words correctly and the absence of accents and movements in the digital text [4], i.e., same textual representation may have totally different meanings. Since this paper deals with analysis of refugee’s activity on Social Media and the big majority of refugees in Turkey communicate in Arabic [1], a visual demonstration of the analysis is essential to decrease the aforementioned ambiguity.
In addition, to enhance the perception of analysis results, in this paper, we propose a method to summarize the refugees’ perspective in Turkey by choosing an image or group of images out of the shared multimedia in specific time margin related to a specific word or topic. The images are selected automatically so that the most representative ones are gathered and shown while also avoiding unnecessary repetition among the set of selected images.
This graphical presentation could enable a better understanding of refugees’ social media activity for a better planning in future interventions in Turkey; the country which is hosting highest number of refugees in the world today [5].
2. Related Works
People share enormous amounts of data on social media, which led to numerous studies in the last decade. These studies cover, on the first hand, a wide range of aspects according to availability of various kinds of data, e.g., textual [6, 7], locational [8], and visual [9], etc.; on the other hand, it deals with a rich variety of applications and topics.
One of the most popular topics is arguably elections. During this time, social media produces numerous comments and news concerning candidates’ statements. Quite a few studies take place on literature in order to predict the elections in terms of forecasting the results [10, 11, 12] and understand how posts reflect the political sentiment in society [13, 14]. A recent study by Kutlu et al. [15] analyse 108M tweets posted in the two months leading to the Turkish presidential election to understand the opinions of the opposing and supporting groups. On the other hand, this popularity of social media data being analysed to predict elections or similar concepts and the easiness of proposed methods in relevant articles to announce the
challenges and hopes of refugees. As an example of refugees’ related work, the study in [17] explores the ideas of users towards refugees by means of collected tweets including #refugeesnotwelcome hashtag. The work in [18] also exploits tweets including same hashtag to understand the portrayal of male Syrian refugees on social media.
Another group of studies try to infer public opinions about specific topics through social media. For instance, Darwish et al. [19] and Magdy et al. [20] investigate islamophobic behaviour in social media after several incidents.
Most of the aforementioned studies rely on textual analysis. In addition to textual data, multimedia content existing in social media is also valuable for performing analysis and there are studies in that category [21]. Snavely et al. [9] proposed a method for exploring large amounts of photographs, which possibly can be acquired from social media. Another study tries to calculate 3D visual popularity from social media images by estimating the visual space covered by the images [22]. Sharma et al. [23] performs image summarization using SIFT features and topic modelling. This study is mainly aimed to summarize hundreds of photos taken by a single user.
3. Used Method
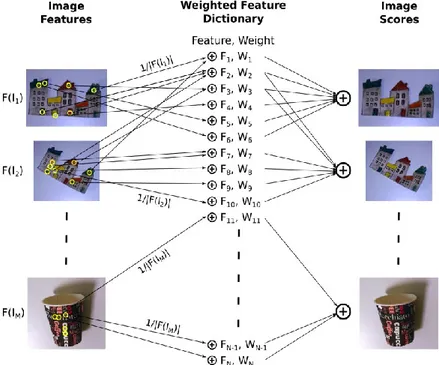
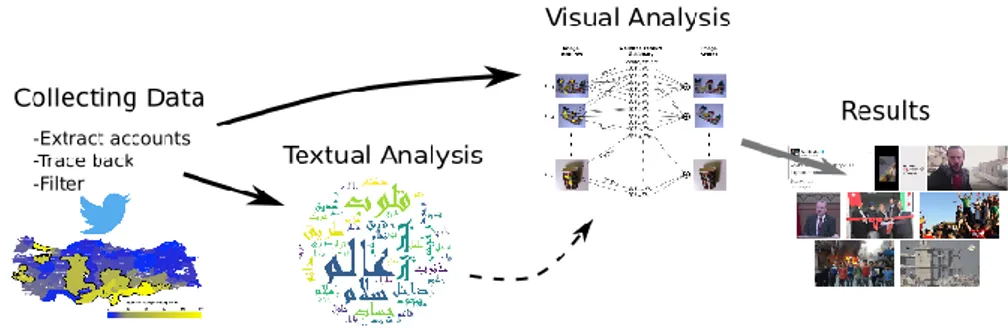
Our overall process, as shown in Figure 1, is divided into three main stages. Firstly, we need to collect social media data gathered from refugee owned accounts. In the second step, we perform a textual analysis to determine the trending topics for different domains of interest. The resulting words require further disambiguation for which we also employ a visual analysis step. In that step, we look for the mostly shared visual features accompanying the trending topics. The whole process can be regarded as a visual summarization and demonstration of social media activity in the interested domain.
Figure 1. Overview of the system
A. Collecting relevant data
Refugees in Turkey, uses several globally known social media platforms including Facebook, Twitter, Instagram, etc. Out of these platforms, we have opted for Twitter because of its compact message style consisting of only 280 characters (previously 140) and its aforementioned role on social events in the Arab Spring.
To retrieve information from refugee related accounts, we analyse public Twitter activity using its API1. Applying the method used in [24] consists of the following
sub steps: Firstly, we try to figure out a method to define the accounts of refugees in Turkey. Secondly, we trace back those chosen users’ accounts, collecting the tweets. Finally, we filter out the irrelevant and unreliable data.
- Determining the accounts. To determine the refugee owned accounts we check the accounts associated with Arabic language, since most refugees (95% [5]) have Arabic as their mother tongue and refugees are forming 90% of the registered foreigners in Turkey. Thus, we assume that Twitter accounts in Turkey, which use Arabic as the main language, are probably of refugees. Since the majority of the refugees are from Syria, we check the number of Syrian refugees registered in each Turkish city. Figure 2 shows the distribution of Syrian refugees in Turkey.
1 https://developer.twitter.com/en/docs
Figure 2. Distribution of Syrian refugees in Turkish cities generated according to the statistics in [25].
The image is generated according to the statistics in [25] using a logarithmic colour code. The bold border shows the regions chosen in our study, which host the majority of Syrian refugees. The cities in these regions accommodate 90% of them while they only have 48% of the total Turkish population. Table 1 shows the number of refugees in chosen cities and the ratio of refugees to the city populations.
Table 1. MAIN CITIES HOSTING REFUGEES
City N.Refugs Ratio City N.Refugs Ratio
Adana 150790 6.85% Ankara 73198 1.37% Bursa 106000 3.68% Gaziantep 329670 16.70% Hatay 384024 24.69% İstanbul 479555 3.24% Izmir 108306 2.58% Kahramanmaraş 90100 8.11% Kayseri 59938 4.34% Kilis 124000 95.15% Konya 73445 3.40% Mardin 94340 11.85% Mersin 146931 8.28% Osmaniye 43773 8.38% Şanlıurfa 420532 21.67% Total 2685669 6.28%
Twitter API allows searching for recent (seven days) tweets according to keywords, location, and used language. To avoid a biased collection of data, we do not provide any keywords. We search for Arabic tweets in specific locations wherein refugees are accommodated intensely.
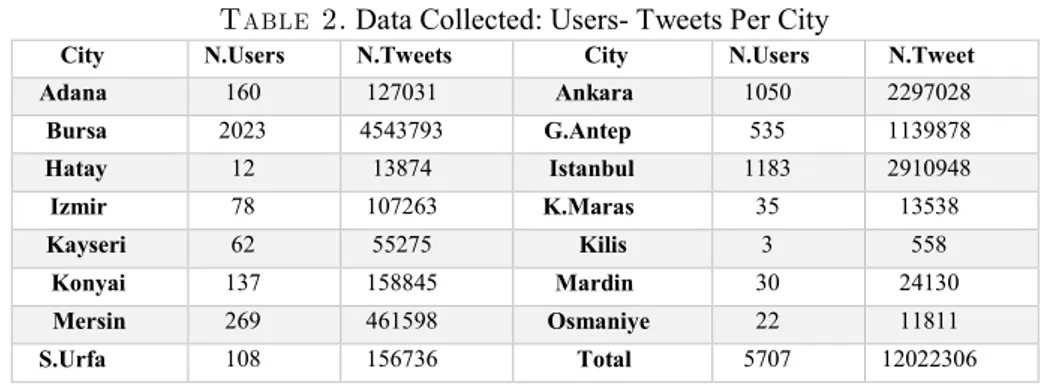
We collected 1000 tweets per region. Later, we extracted the individual user IDs posting these tweets. As one account can post multiple tweets, we have less amount of user accounts then the number of tweets. As a result, we collected 5707 Twitter users who were active recently. Table 2 shows the number of discovered users in each region. We have to mention that we can repeat this procedure anytime to collect
more accounts, which were not discovered because of their inactivity in the previous searching time. Moreover, it is possible to include more regions.
Table 2. Data Collected: Users- Tweets Per City
City N.Users N.Tweets City N.Users N.Tweet
Adana 160 127031 Ankara 1050 2297028 Bursa 2023 4543793 G.Antep 535 1139878 Hatay 12 13874 Istanbul 1183 2910948 Izmir 78 107263 K.Maras 35 13538 Kayseri 62 55275 Kilis 3 558 Konyai 137 158845 Mardin 30 24130 Mersin 269 461598 Osmaniye 22 11811 S.Urfa 108 156736 Total 5707 12022306
Collecting tweets data. Twitter API permits accessing up to last 3200 tweets (including retweets) from a single user. Therefore, we gathered tweets of each user we extracted in the previous step until the limit is reached or there are no more tweets from that user. In one query, it is possible to access only 200 tweets; thus, we run multiple queries to collect the maximum possible number of tweets. Using this procedure, we formed a dataset with the tweets until January 2018 and the oldest tweets acquired goes back to the year 2008. Table 2 includes the number of tweets collected from each city.
Data filtering. Only tweets up to the end of 2017 were analysed, since in 2018, millions of tweets (3,678,739) were retrieved in less than 20 days. Thus, we excluded the tweets from 2018; which are unreliable, due to the fact that tweeting 3200 tweets in those days means more than 160 tweets per day, implying that these tweets are neither coming from a real user, nor expressing an individual user opinion. Among the traced accounts, there are ones, which do not belong to individual users, but to press or companies for instance. These accounts mostly post with a very high frequency including a big ratio of retweets. This information helps differentiating the users we are interested in to analyse in this study. Moreover, we have excluded the Twitter accounts created or have all the activities after 2014, since these accounts are incapable to reflect the continuous change of refugees' conditions and needs. To analyse the development of refugee related issues and events, we focus more on the users for whom we have data that covers the years when refugees arrived to Turkey (See Figure3).
Figure 3. Number of Refugees in Turkey per year [1].
Table 3 shows the number of accounts with the date of their oldest tweets collected. With the aforementioned approach, out of 5707 accounts and 12 million tweets, we have refined the accounts into 633 and the tweets to almost 800 thousands, and classified these tweets into: tweets (435,378) and RT (336,753).
Table 3. Number Of Users With Their Oldest Known Activity
Year 2018 2017 2016 2015 2014 & before
N.Users 876 2997 815 397 633
B. Textual analysis
In this study, we are concerned on the direct opinions of refugees. Thus, we did not include retweets in our analysis. We find out the frequency of occurrence of each word in the combined text from all tweets. Since most of the conjunction and pronouns, etc. in Arabic have less than three letters, we discarded any word, which has less than three letters to select useful and meaningful words.
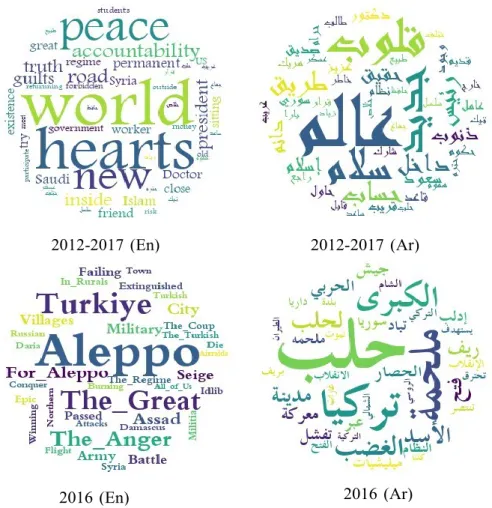
Conducting an analysis based on the direct count of words, misleadingly favours the commonly used words of daily life rather than the representative words that reflect a specific event or topic. To avoid highlighting such common words we use the following simple approach: subtracting the frequency of occurrence of a word in the whole period from the frequency of occurrence of the word in a specific period. This approach highlights the representative words in a domain of interest and suppresses the misleadingly high frequency of common words e.g., pronouns, conjunction, suffixes. Using the results, we have created the word clouds seen in Figure 4. The analysis shown is an example, which was conducted for the total tweets in Turkey in the whole period (2012 to 2017), and another example of a yearly-based analysis of 2016.
Figure 4. Generated word clouds for years 2012 to 2017. Same word clouds for 2016 presented: Original Arabic words (right), translation to English (left).
C. Visual analysis
As a result of the textual analysis step, we figured out the keywords reflecting the important events in a specific domain of interest. These keywords are still ambiguous out of their context; i.e., many of the words have multiple meanings or even with the same meaning, they may correspond to different events or issues [26]. High complexity of written Arabic language and abstracted use of language in order not to exceed the character limit on Twitter also increase the ambiguity level. Thus, to find out what is really meant by these keywords, associated media can be strongly helpful. Therefore, we also download images from tweets including a keyword in its specific time domain.
2012-2017 (En) 2012-2017 (Ar)
2016 (Ar) 2016 (En)
Figure 5. Calculating image scores.
Firstly, we extract SIFT features [27] of all images. To increase the performance, we limit the number of SIFT features extracted from each image to 50. Each feature is assigned a value of 1/|F(Ii)| where |F(Ii)| depicts the number of features in image i.
By accumulating all images, a dictionary of features is generated where each feature has a score according to the number of its occurrences among different images, i.e., if an image feature exists in many images it has a higher score.
After determining the scores of each feature, these scores are used to calculate the score of images such that an image will obtain a score equal to the sum of its all features’ scores. This approach prioritizes visual elements that are shared frequently. Note that, in this approach, the shared images do not have to be identical to be prioritized but they need to include similar visual features, e.g., two images of the same scene from different angles will both contribute to this scene’s score. At the end of this procedure, the image with the highest score can be selected as the
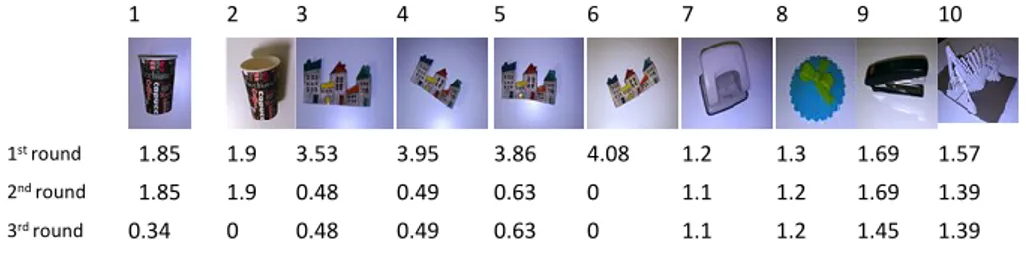
representative image for that keyword. Nevertheless, it is possible for a keyword to have multiple representative images. In such a case, we need to avoid selecting images with little difference. To achieve that we used a mechanism as follows: When the image with the highest score is selected, scores of all similar images will be lowered according to their similarity level. Specifically, when an image is selected, scores of all its visual features in the dictionary are set to zero and image scores are recalculated. Figure 6 shows this procedure with a set of images. These images are not obtained from social media; instead, authors have taken them only to explain the methodology.
1 2 3 4 5 6 7 8 9 10
1st round 1.85 1.9 3.53 3.95 3.86 4.08 1.2 1.3 1.69 1.57 2nd round 1.85 1.9 0.48 0.49 0.63 0 1.1 1.2 1.69 1.39 3rd round 0.34 0 0.48 0.49 0.63 0 1.1 1.2 1.45 1.39
Figure 6. Multiple image selection process.
For the example shown in Figure 6, image 6 is selected in the first round with its score of 4.08. Since there are four similar images (3rd to 6th images) in the whole set,
all of these similar images get a higher score compared to other images. In the second round, scores of all image features existing in image 6 become zero; consequently, the score of all these similar images decrease drastically resulting in selection of a completely different image, image 2, in the second round. Similarly, score of first and second images, which look like each other decrease in the third round. Finally, at each round, a completely different image is selected and repetition of images in the representative set is avoided.
4. Performance Analysis
The whole process to reach the results includes dataset generation, textual analysis and visual analysis steps as explained previously. The sub-steps to generate the dataset, i.e., identification of relevant accounts and gathering their tweets depend mostly on the Internet connection and Twitter’s service. In our case, tweets of approximately 200 users can be gathered in each hour so it took ~29 hours to download the timelines in all 5707 accounts. Although it took a considerable time to collect the dataset, this step is performed only once.
Textual analysis requires counting number of occurrences of each word. This can be achieved in O(n) time using a hash map, where n is the number of words in the whole text, by scanning all the data in the domain and increasing the count of each encountered word. This takes less than a minute for our dataset size. Therefore, the analysis performance is mainly dominated by the visual analysis step, which is
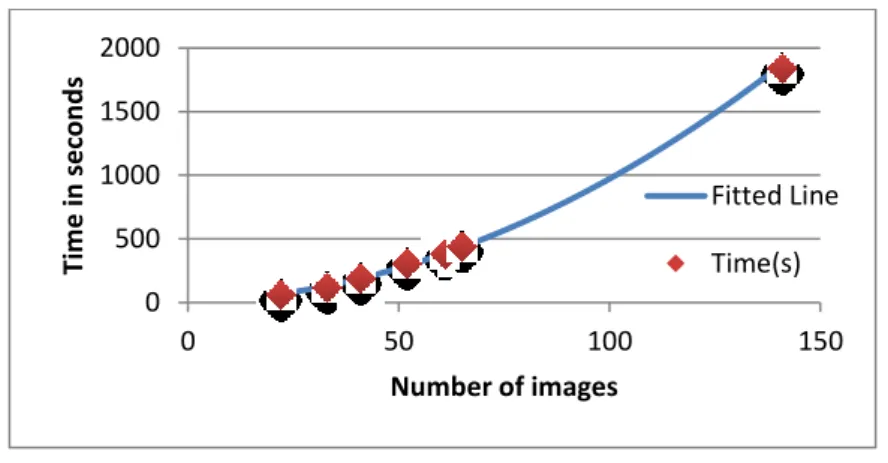
visual analysis for different sizes of data take the durations shown in Figure 7. For example, for 141 images it took ~30 minutes to execute visual analysis.
Figure 7. Experimented time requirements for visual analysis.
Considering the time requirements given in Figure 7, it would take impractically long hours. In the case of 1000 images in the domain of interest, it may take around 24 hours. Our implementation is only for research purposes and does not focus on performance issues; thus, it is possible to decrease the performance by using graphical processing units and a more optimized implementation. Even in that case, a method to decrease time requirement would be helpful for large input sets. Therefore, we propose two methods to increase performance.
Random down sampling the input set: Ideally, a fair down sampling would preserve the distribution of elements in the set. Therefore, if the domain is sufficiently large, when we randomly down sample the input set, the results are not expected to change significantly according to final set size. Therefore, one option is to decrease the input size by eliminating a proportion (α) of input images randomly. This option contains the risk of eliminating highly representative images. In addition, if the final set size is small, it may not have enough resolution to include original details.
Hierarchical analysis: In the random sampling method, we do not consider most of the input images. Using a hierarchical approach would enable considering all images; and still enhances performance. For such an approach, the input set is
0 500 1000 1500 2000 0 50 100 150 Ti m e in se co n d s Number of images Fitted Line Time(s)
divided to a number (m) of smaller sets. Since the running time of the algorithm is almost proportional to the square of the number of images in a set, combined time of processing smaller sets would be still much less than processing the whole set together. After processing each small subset, the images are sorted according to their scores and a proportion of them (γ), e.g. 25%, are considered for the next step of analysis in the hierarchy. According to the values γ, there occurs a trade-off between performance and accuracy. Although the highest scored images are preserved even with a small value of γ; in this case, similar images contributing to these images’ scores may be eliminated resulting in lower scores in the later evaluations.
Both of the proposed methods are experimented and the results are discussed in Section 5.
5. Results And Discussion
The approach applied in this study shows two kinds of analysis results. Firstly, the text analysis, which is presented in wordclouds seen in Figure 3 which are created to show the trends and most frequent words in the collected data set. These results remain ambiguous, partially because the language is Arabic, in which without writing the correct movements and accents, a word can have multiple meanings, which varies widely between unrelated meanings. Thus, second analysis of linked media is performed, to explain and define the correct meaning by associating these words to related images.
Choosing the most representative images is performed using a novel process, and the results of this analysis are shown in Figure 8. This analysis is performed over the significant words of 2016. The first row shows four automatically chosen images for word ’Aleppo’ out of 302 images in the dataset. Second row shows three images for word ’Turkiye’ out of 136 images and third row contains 2 images for word ’melhame’ out of 10 images.
The applied approach helps to clarify the meaning of the keywords in a specific domain. In our case, the most shared words by refugees in Turkey are presented, and the most related images are chosen, this combination eases the understanding of the most important issues the refugees cared about or considered to discuss through their social media accounts. For instance, reading the text ’Halep’ could mean milking or Aleppo (the Syrian city) and ’melhame’ could mean epic or butcher; by associating these words with images, the ambiguity is removed and the meanings are revealed so we can tell that the topics are Aleppo city and epic respectively.
Figure 8. Demonstration of visual analysis results for year 2016. Top row: images for Aleppo, middle: Turkiye, bottom: epic (’melhame’ in Arabic). Number of chosen images for each word also represents the word’s weight.
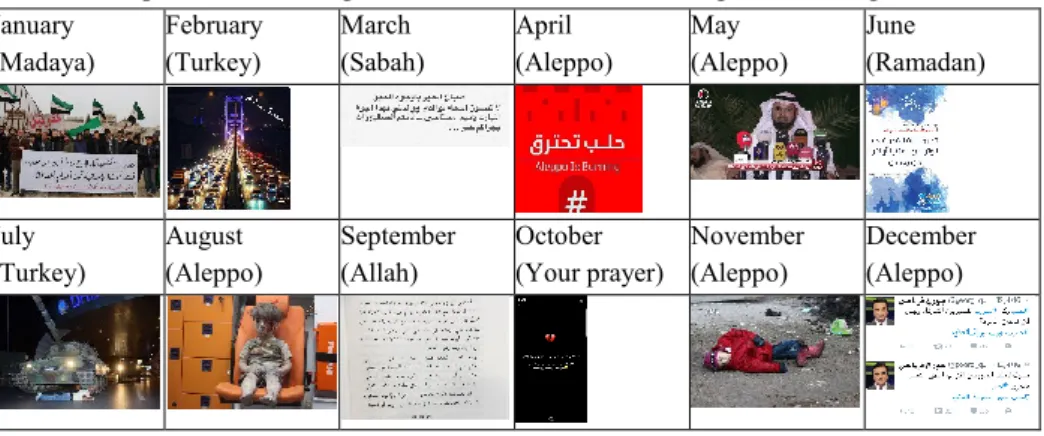
We have also conducted a monthly analysis for 2016. In this case, the images related to the most significant word in each month are gathered. To decrease analysis time, input sets are limited to 100 images for each month. Table 4 shows the images with the highest score for the most significant words, also indicated in the table, for each month. The results can be regarded as a one-year image calendar. As we see from the table, several images consist of text, which decrease visual information and disambiguation of the underlying meaning.
Table 4. Representative images of each month in 2016 using the most significant words January (Madaya) February (Turkey) March (Sabah) April (Aleppo) May (Aleppo) June (Ramadan) July (Turkey) August (Aleppo) September (Allah) October (Your prayer) November (Aleppo) December (Aleppo)
The case presented in Table 5 is similar to the one in Table 4, except that the visual analysis is performed using the same word, “Aleppo”, in each month. This case visually presents the change of people’s view of the same topic through a time period along with the milestone events related to this topic.
Table 5. Representative images of each month in 2016 using the same word (Aleppo).
January February March April May June
July August September October November December
Figure 9. The yearlong representative images.
As explained in Section 4, the visual analysis step may take significantly long time depending on the size of the input set and two possible methods to overcome this situation are proposed. To evaluate their performances we run our analysis over August 2016 with the word “Aleppo”. The entire set includes 282 images, running the visual analysis directly over the complete set takes ~2 hours in the previously indicated working environment. The most representative eight images from this set are presented at the top of Figure 10. We need to clarify that the number of selected images negligibly affects the running time, i.e., it takes extra few seconds only. Middle row of Figure 10 shows the results when the whole set is randomly down-sampled to 100 images. In this case, visual analysis takes approximately 16 minutes. Using the hierarchical analysis, the entire set of images is randomly divided to 4 sets of ~70 images. Then, by using γ as 0.25, the top 18 images from each set are combined for the final round (Figure 10-bottom row). The whole process takes 42 minutes. Both strategies save significant time, i.e., from 2 hours to 16 minutes and 42 minutes. As shown in Figure 10, the results are still acceptable. While some of the selected images are different, they still represent the events related to “Aleppo” on August 2016.
En ti re se t Do wn S am pled Hie ra rc hica l
Figure 10. ‘Aleppo’, August 2016: Visual analysis with three approaches.
An interesting procedure would be running visual analysis directly over the images without a preceding textual analysis. We tried this case over July 2016. All the images shared in that time period from the accounts in our dataset are collected without searching for a specific text. As the volume of the analysis is notably large, the images are divided to separate sets for each day and a two-level hierarchical analysis is applied. After a daily analysis, the results for each five consecutive days are combined with a 0.2 value of γ. Then, the resulting six sets are combined again with the same settings to form the final set of the month. Figure 11 presents the selected images to represent that month. As can be seen in the Figure, the selected images are not representative really of the events that are known for that month. People mostly share their opinions using textual representation possibly including visuals. Without the textual analysis step, the results are less reliable because individual and irrelevant images cause a visual noise affecting the visual analysis step. All images including text includes certain SIFT features extracted from the letters of the alphabet. Therefore, these features get a higher score even when the images including them are not related to each other. Having a collection of images without a focus may provide an advantage to images including text. To avoid this problem text present in images can be detected, and removed. In addition, when there is a textual analysis step most of the images are related to the given text, decreasing the noise to get better and more focused results.
Figure 11. Results of visual analysis applied over July 2016 without textual analysis step.
The proposed method utilizes SIFT features to determine the most popular visual elements. There are several alternatives to SIFT such as SURF or ORB features. All of these methods depend on corner like features, which are can be detected more robustly in manual artefacts rather than natural objects. Although the results are satisfactory, using different kinds of image features such as facial features or colour histograms may contribute to the qualitative performance of the system considering that the input set mostly contain humans rather than architectural elements. Experimenting with such approaches remains as future studies.
6. Conclusion
An approach to retrieve and analyse refugees’ issues in Turkey, is presented in this paper, using Twitter as a data source to define refugees accounts and trace their activities back in time is explained too. The data set gathered contains horizontal and vertical dimensions for a multilevel analysis, such as time, location, inference, opinion, sentiment, and politically oriented accounts. This provides wide potentials for deeper future analysis to better understanding the conditions of refugees, and to enhance the public plans for their integration. A comparison with Turkish newspapers’ headlines with tweets shared by refugees in Turkey in the same period indicates a partial correlation between the local focus and refugees issues of interest. Figure 12 shows samples from first pages of major Turkish newspapers in 2016 in different months. Comparing to Figure 4 the results of six months are coherent in both figures. A deeper future work can investigate the relation and level of adaptation between the topics and trends of refugees’ social networks with local issues and topics in their refuge countries, even that we should not expect a high level of correlation.
August (Aleppo) November(Aleppo) December (Aleppo) Figure 12. First pages samples of major Turkish newspapers in 2016 comparing in the same period of refugees social media activities.
To understand the issues and topics shared and discussed by refugees who are forced to leave and refuge in other countries, visual means are used to communicate and present these topics. Different methods to increase the computational performance and obtain better results are discussed. A potential future work is experimenting with different visual elements to enhance the qualitative performance and explore specific objects or topics; such as social and cultural identity, architectural heritage, etc. Another future work is to create image clouds similar to word clouds of the most trending topics, in order to be presented using this approach to choose the most representative images the refugees in Turkey has shared during their refuge years.
Acknowledgment: This paper is part of SMART project conducted in Ankara Yıldırım Beyazıt University. One of the authors, Abdullah Bülbül, is supported from TÜBİTAK BİDEB 2232 program (Project number: 117C010).
References
[1] 3rp:syria regional refugee response inter-agency information sharing portal. http://data.unhcr.org/syrianrefugees/country.php?id=224 (2018), accessed: 2018-01-19.
[2] Snavely, N., Seitz, S.M., Szeliski, R., Photo tourism: exploring photo collections in 3d, CM transactions on graphics (TOG), ACM (2006), vol. 25, 835–846.
[3] Alnafri, M., Positions and declarations, Aljamal Press, Bagdad, Iraq, PP. 164, 1996.
[4] Dahab, M.Y., Ibrahim, A., Al-Mutawa, R., A comparative study on Arabic stemmers, International Journal of Computer Applications, (2015) 125(8). [5] UNHCR: United nations refugee agency. http://www.unhcr.org/
figures-at-a-glance.html (2017), accessed: 2018-01-19.
[6] Paltoglou, G., Thelwall, M., Twitter, myspace, digg: Unsupervised sentiment analysis in social media, ACM Transactions on Intelligent Systems and Technology (TIST) (2012) 3(4), 66.
[7] Pang, B., Lee, L., et al., Opinion mining and sentiment analysis, Foundations and Trends R in Information Retrieval, (2008) 2(1–2), 1–135.
[8] Bulbul, A., Dahyot, R., Populating virtual cities using social media, Computer Animation and Virtual Worlds, (2017) 28(5).
[9] Snavely, N., Seitz, S.M., Szeliski, R., Photo tourism: exploring photo collections in 3d, ACM Transactions on Graphics (TOG), (2006), vol. 25, pp. 835–846.
[10] Sang, E.T.K., Bos, J., Predicting the 2011 Dutch senate election results with twitter, Proceedings of the workshop on semantic analysis in social media, Association for Computational Linguistics, (2012), 53–60.
[11] Burnap, P., Gibson, R., Sloan, L., Southern, R., Williams, M., 140 characters to victory?: Using twitter to predict the UK 2015 general election, Electoral Studies (2016), 41, 230–233.
[12] Mascaro, C., Agosto, D., Goggins, S.P., The method to the madness: The 2012 united states presidential election twitter corpus, Proceedings of the 7th 2016 International Conference on Social Media & Society, ACM (2016), p. 15.
[13] Tumasjan, A., Sprenger, T.O., Sandner, P.G., Welpe, I.M., Predicting elections with twitter: What 140 characters reveal about political sentiment, Icwsm, (2010), 10(1), 178–185.
[14] Darwish, K., Magdy, W., Zanouda, T., Trump vs. Hillary: What went viral during the 2016 us presidential election, International Conference on Social Informatics, Springer (2017), 143–161.
[15] Kutlu M, Darwish K, Elsayed T., Devam vs. Tamam: 2018 Turkish Elections, arXiv preprint arXiv:1807.06655. (2018)
[16] Gayo-Avello, D., ” i wanted to predict elections with twitter and all i got was this lousy paper”–a balanced survey on election prediction using twitter data. arXiv preprint arXiv:1204.6441 (2012)
[17] Kreis, R., # refugeesnotwelcome: Anti-refugee discourse on twitter, Discourse & Communication, (2017), 11(5), 498–514.
Science, (2017), 3(1).
[20] Magdy, W., Darwish, K., Abokhodair, N., Rahimi, A., Baldwin, T., # isisisnotislam or # deportallmuslims?: Predicting unspoken views, Proceedings of the 8th ACM Conference on Web Science, ACM, (2016), 95– 106.
[21] Schreck, T., Keim, D.,Visual analysis of social media data, Computer (2013) 46(5), 68–75.
[22] Bulbul, A., Dahyot, R.: Social media based 3d visual popularity, Comput. Graph. 63(C), 28–36 (Apr 2017), https://doi.org/10.1016/j.cag. 2017.01.005 [23] Sharma, V., Kumar, A., Agrawal, N., Singh, P., Kulshreshtha, R., Image
summarization using topic modelling. Signal and Image Processing Applications (ICSIPA), 2015 IEEE International Conference, (2015) 226– 231.
[24] Bulbul, A., Kaplan, C., Ismail, S.H., Social media based analysis of refugees in turkey. In: BroDyn18: Workshop on Analysis of Broad Dynamic Topics over Social Media, (2018), 35–40.
[25] Esnek, F., Basin ilan kurumu, hangi ilde ne kadar suriyeli var? iste il il liste. http://www.bik.gov.tr/ hangi-ilde-ne-kadar-suriyeli-var-iste-il-il-liste/ (2017), accessed: 2018-01-19.
[26] Bulbul, A., Ismail, S.H., A Visual Demonstration based on Social Media Analysis of Refuges in Turkey, International Conference on Theoretical and Applied Computer Science and Engineering, (2018), 1–5.
[27] Lowe, D.G., Distinctive image features from scale-invariant keypoints, International journal of computer vision, (2004), 60 (2), 91–110.
Current Address: ABDULLAH BULBUL: Ankara Yıldırım Beyazıt University, Computer Engineering Department, Ankara TURKEY
E-mail: [email protected]
Current Address: SALAH HAJ ISMAIL: Ankara Yıldırım Beyazıt University, Architecture Department, Ankara, TURKEY
E-mail: [email protected]
![Figure 2. Distribution of Syrian refugees in Turkish cities generated according to the statistics in [25]](https://thumb-eu.123doks.com/thumbv2/9libnet/3852330.35544/5.688.94.592.142.345/figure-distribution-syrian-refugees-turkish-generated-according-statistics.webp)
![Figure 3. Number of Refugees in Turkey per year [1].](https://thumb-eu.123doks.com/thumbv2/9libnet/3852330.35544/7.688.136.542.164.292/figure-number-refugees-turkey-year.webp)