ISTANBUL BILGI UNIVERSITY INSTITUTE OF GRADUATE SCIENCES
ELECTRICAL AND ELECTRONICS ENGINEERING MASTER’S DEGREE PROGRAM
APTAMER BASED BIOSENSOR DESIGN FOR GLUTEN DETECTION
GÖKAY SU YEŞILYURT 115815025
ASSIST. PROF. DR. ÖZGÜR GÜL
ISTANBUL 2019
ii
iii
ACKNOWLEDGEMENT
I would like to mention about my gratitude to whom make this thesis possible to complete.
Firstly, I would like to give my sincere gratitude to my advisor Asst. Prof. Dr. Özgür Gül and my co-advisor Asst. Prof. Dr. Y. Dağhan Gökdel. Throughout of my thesis, I am motivated and encouraged with their patience and guiding. Their guiding is not only aspect of project, they also lead me to my life plans and encourage me to relief my best. I would also thank again to Asst. Prof. Dr. Özgür Gül to encourage me to study at master degree without his support, it would not be possible to complete this project.
Being a part of Protein Engineering Lab make me feel lucky. I would like to thank all the members in Protein Engineering Lab. I am gratitude to have such laboratory team mates Ali Sinan Kara, Lara Naseri and İlayda Amanoğlu. I am thankful for their help and motivation.
Finally, I would like to express my appreciation to my family. I owe my parents Hilal Yeşilyurt and Gökhan Yeşilyurt so much for their tolerance, understandings and supports. I am grateful Nezih Sipahioglu for his continuous pertinacity to motivate and support me.
iv
ABSTRACT
A lot of people are suffering because of gluten intolerance or celiac disease which is caused by gluten. Additionally, there is a growing demand for the gluten-free diet as a part of healthy lifestyle. The only treatment for the celiac disease or gluten intolerance is to follow a strict gluten-free diet. As a result, there is an increasing need for the gluten detection for not only raw food but also for the processed food.
The goal of our study was to design an aptamer-based biosensor for the gluten detection. To achieve this goal, we have optimized sample preprocessing and compared the results with industry standard gluten from Prolamine Working Group (PWG). We have also, modified some aptamers that are already used in some scientific reports with biotin and tested their ability to recognize gluten using ELISA.
Finally, we have used lateral flow assay format to detect gluten using biotinylated aptamers on our homemade strips.
Therefore; we designed specific biosensor that has the potential to detect and quantify different sources of gluten. We choose aptamer as the biological recognition element because it is easy to produce, it is stable under different conditions and it is fast for the detection of proteins. Since aptamers are new generation of biosensor, which is called aptasensors, they will be well adapted to our conditions.
v
ÖZET
Birçok insan glüten kaynaklı olarak intolerans veya çölyak hastalığı çekmektedir. Bununla beraber, sağlıklı yaşam için de glüten içermeyen beslenme şekline giderek artan bir talep oluşmuştur. Çölyak hastalığının veya glüten intoleransının tek tedavisi, glüten içermeyen beslenme şekli olmaktadır. Bunların sonucunda, çiğ ve işlenmiş yiyeceklerde glüten tespiti ihtiyacı artmaktadır.
Bu çalışmamızın amacı, glüten tespiti için aptamer tabanlı bir biyosensör tasarımı yapmaktır. Bu amaca ulaşabilmek için, örneklerin ön işlemesini gerçekleştirdik ve bunu Prolamine Working Group (PWG)’tan elde ettiğimiz standart ile karşılaştırdık. Buna ek olarak bilimsel literatürde daha önce kullanılmış olan aptamerlere biotin ekleyerek bunların glüteni tespit etme özelliklerini ELİZA yöntemiyle test ettik.
Son olarak, yanal akımlı test (Lateral Flow Test) formatında kendi ürettiğimiz stripler üzerinde biotin işaretlenmiş aptamerleri test ettik.
Sonuç itibariyle, potansiyel olarak farklı kaynaklardan glüten varlığını tespit edebilecek ve miktarını ölçebilecek bir biyosensör tasarlamış olduk. Biyolojik tanıma elementi olarak, kolay üretilebilmesi, farklı koşullarda stabil olması ve hızlı sonuç vermesi sebebiyle aptamerleri tercih ettik. Aptamerler yeni jenerasyon biosensörler olduğu için, aptasensör olarak adlandırılmakta ve bizim koşullarımıza iyi adapte olmuştur.
TABLE OF CONTENTS
ACKNOWLEDGEMENT ... iii
ABSTRACT ... iv
ÖZET ... v
LIST OF FIGURES ... viii
LIST OF TABLES ... x LIST OF SYMBOLS/ABBREVIATION ... xi INTRODUCTION ... 1 1.1. BIOSENSORS ... 1 1.1.1. Historical background ... 2 1.2. TYPES OF BIOSENSORS ... 4
1.2.1. Analyte based classification ... 5
1.2.2. Biosensors – Detection Methods Detailed ... 10
1.3. BIOSENSORS – FORMAT ... 16
1.3.1. Microfluidics Format ... 16
1.3.2. Lateral Flow Assays ... 18
1.3.3. Paper – Based Biosensor ... 20
1.4. GLUTEN ... 26
1.4.1. Importance of Gluten Detection ... 29
1.4.2. How It Is Measured? ... 31
1.4.3. Celiac (coeliac) Disease ... 40
1.5. QUARTZ CRYSTAL MICROBALANCE ... 43
1.6. APTAMER ... 46
1.7. WHY WE USED APTAMERS ... 51
1.8. THE ASSURED CRITERIA ... 51
vii
MATERIALS AND METHODS ... 54
2.1 Materials ... 54
2.1.1 Chemicals ... 54
2.1.2 Aptamers ... 54
2.1.3 Enzymes and Substrates ... 54
2.1.4 Lateral Flow Assay Components ... 54
2.1.5 Buffers and Solutions ... 55
2.1.6 Equipment ... 56
2.1.7 Software ... 56
2.2 Methods ... 57
2.2.1 Gluten Extraction Methods ... 57
2.2.2 ELISA Method ... 58
2.2.3 Lateral Flow Assay Strip Production ... 59
2.2.4 Lateral Flow Test Procedure ... 60
RESULTS ... 62
3.1. OPTIMIZATION OF GLUTEN EXTRACTION RESULTS ... 62
3.2 ELISA RESULTS ... 68
3.3 STRIP RESULTS ... 69
DISCUSSION AND CONCLUSION ... 70
viii
LIST OF FIGURES
Figure 1.1 Schematic show of a biosensor [1] ... 2
Figure 1.2 Graphical representation of numbers between 2010 and 2018 of biosensors related studies [15] ... 3
Figure 1.3 Categorization of biosensor ... 4
Figure 1.4 Schematic illustration of first-, second-, and third-generation amperometric enzymatic biosensors ... 5
Figure 1.5 Scheme of direct and indirect electron transduction.[20]. ... 6
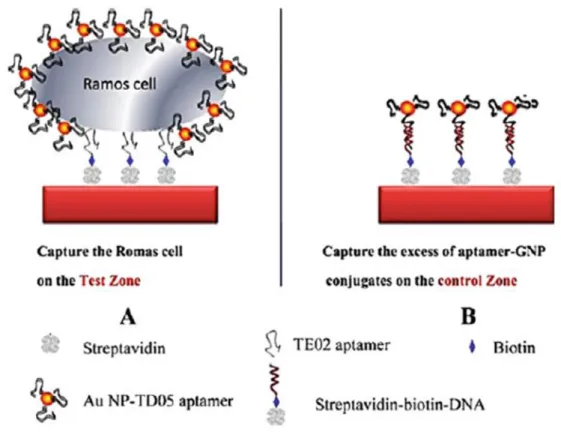
Figure 1.6 Scheme of the detection of Ramos cells on aptamer-nanoparticle strip biosensor (a) Capturing Au-NP-aptamer-Ramos cells on the test zone through specific aptamer-cell interactions (b) Capturing the excess of Au-NP aptamer on the control zone through aptamer-DNA hybridization reaction.[24]. ... 8
Figure 1.7 Schematic diagram of a conventional ion selective electrode [38]. ... 12
Figure 1.8 The scheme of three microfluidic systems. (a) Continuous; (b) Drop – based; and (c) Digital [62]. ... 17
Figure 1.9 Classification of lateral flow assay[63] ... 19
Figure 1.10 Typical configuration of a lateral flow immunoassay test strip[63]. ... 20
Figure 1.11 Paper-based sensors used in analytical capabilities overview ... 22
Figure 1.12 Classification of gluten proteins. Adapted from [94] ... 26
Figure 1.13 Factors affecting wheat dough rheological properties [94]. ... 27
Figure 1.14 Principles of ELISA. A: sandwich ELISA, B: competitive ELISA. For explanation of the different steps [105] ... 36
Figure 1.15 The 33-mer and its epitopes [120] ... 38
Figure 1.16 An illustration of 33-mer peptide on a-gliadin molecule [121]. ... 39
Figure 1.17 Basic working principles of a quartz crystal microbalance (QCM) sensor. .... 45
Figure 1.18 Schematic illustration of the QCM measurements [132]. ... 46
Figure 1.19 Scheme for the Systematic Evolution of Ligands by exponential (SELEX) enrichment process. ... 48
Figure 1.20 Aptamer-based assay formats ... 49
Figure 1.21 Sensitive aptasensors. (A) SPR-based aptasensor; (B) QCM-based aptasensor; (C) SAW-based aptasensor; and, (D) micromechanical cantilever-based aptasensor. ... 50
Figure 2.1 Dimensions of the lateral flow strips ... 59
ix
Figure 2.3 Gluten test design on lateral flow strip ... 60 Figure 2.4 Expected result of gluten testing in lateral flow strips. ... 61 Figure 3.1 SDS-PAGE analysis of Gluten extraction from oat with A and B procedures (A1, A2, A3, A4, B1). Omega gliadins are marked with red circle. ... 62 Figure 3.2 SDS-PAGE analysis of gluten extracts from PWG gliadin, wheat, rye, siyez, oat, bread and whole-wheat bread using extraction methods C and D. Omega gliadins are marked with red circle. ... 63 Figure 3.3 SDS-PAGE analysis of gluten extraction from wheat, rye, oat and siyez using extraction methods C and D. Omega gliadins are marked with red circle. ... 64 Figure 3.4 SDS-PAGE Gluten extraction from oat, siyez, bread, whole-wheat bread, wheat and rye using extraction methods C and D. Top right shows gluten dilution assay. ... 65 Figure 3.5 SDS-PAGE analysis of PWD gliadins and wheat gliadins Omega gliadins are marked with red circle. ... 66 Figure 3.6 Gluten Extraction for wheat and rye in C and D procedures. Omega gliadins are marked with red circle. ... 67 Figure 3.7 Gluten extraction using C and D methods on oat and siyez. Omega gliadins are marked with red circle. ... 67 Figure 3.8 Aptamer ELISA results. ... 68
x
LIST OF TABLES
Table 1.1 The development of biosensors during the period 1970–1992 [15]. ... 3
Table 1.2 The comparison between the three types of microfluidics [62]. ... 18
Table 1.3 Advantages and disadvantages of the main fabrication techniques for paper-based sensors [65]. ... 25
Table 1.4 Main fabrication techniques for paper-based sensors [65]. ... 25
Table 1.5 List of commercially available ELISA kits for gluten detection [105]. ... 37
Table 1.6 Immonologic difference between allerfy, celiac disease and non-celiac gluten sensitivity. ... 42
Table 1.7 ASSURED characteristics (WHO) and examples of target specifications for the evaluation of point-of-care devices [152]. ... 53
Table 2.1 Aptamers and their sequences[155][156]. ... 54
Table 2.2 Buffers and their contents. ... 58
xi
LIST OF SYMBOLS/ABBREVIATION
Tris-HCl Tris(hydroxymethyl) aminomethane hydrochloride
DTT Dithiothreitol
SDS Sodium Dodecyl Sulfate
PWG Prolamin Working Group
ELISA Enzyme-linked immunoabsorbent assay
SDS-PAGE Sodium dodecyl sulfate polyacrylamide gel electrophoresis
HRP Horse-Radish Peroxidase
PVC Poly Vinyl Chloride
TMB 3,3',5,5'-Tetramethylbenzidine
BCIP/NBT 5-bromo-4-chloro-3-indolyl-phosphate/nitro blue tetrazolium
1
INTRODUCTION
1.1. BIOSENSORS
The biosensor is an analytical device that transforms biological response into an interpretable signal. With the production of an interpretable signal, biosensors measure the concentration of an analyte in the reaction. Biosensors are used for biological applications. Those applications can be disease monitoring, drug discovery, and detection of pollutants etc. Figure 1.1; describes the typical form of biosensors and its components.
• Analyte: A substance of interest that needs detection. For instance, glucose is an ‘analyte’ in a biosensor designed to detect glucose.
• Bioreceptor: A molecule that specifically recognizes the analyte and comes from a biological source is known as a bioreceptor. Enzymes, cells, aptamers, deoxyribonucleic acid (DNA) and antibodies are some examples of bioreceptors. The process of signal generation (in the form of light, heat, pH, charge or mass change, etc.) upon interaction of the bioreceptor with the analyte is termed bio-recognition.
• Transducer: The transducer in biosensors is an element that interprets the signal generated from analyte-bioreceptor interaction and produces a measurable signal. Most transducers produce either optical or electrical signals that are usually proportional to the amount of analyte–bioreceptor interactions.
• Signal-processing: This is the part of a biosensor that processes the transduced signal and prepares it for display. It consists of complex electronic circuitry that performs signal conditioning such as amplification and conversion of signals from analogue into the digital form. The processed signals are then quantified by the display unit of the biosensor.
• Display: The display consists of a user interpretation system such as the liquid crystal display of a computer or a direct printer that generates numbers or curves understandable by the user. This part often consists of a combination of hardware and software that generates results of the biosensor in a user-friendly manner. The output signal on the display can be numeric, graphic, tabular or an image, depending on the requirements of the end user [1].
2
Figure 0.1 Schematic show of a biosensor [1].
1.1.1. Historical background
The history of biosensors starts in 1906, when M. Cremer[2,3] demonstrated that the concentration of an acid in a liquid is proportional to the electric potential that arises between parts of the fluid located on opposite sides of a glass membrane[3,4] The first “functional” biosensor was invented for oxygen detection by Leland C. Clark, in 1956. Scientists know Clark as the ‘father of biosensors’ and to this day his invention is known as the: “Clark electrode”.[5,6] He is also the inventor of the first glucose biosensor. Following Leland C. Clark the first potentiometric biosensor for detecting urea was discovered in 1969 by Guilbault and Montalvo, Jr[7]. In 1975 the first commercial biosensor was produced by Yellow Spring Instruments (YSI). Table 1.1 shows the history of biosensors. Ever since the development of the i-STAT sensor, remarkable progress has been achieved in the field of biosensors. The field is now a multidisciplinary area of research that bridges the principles of basic sciences (physics, chemistry and biology) with fundamentals of micro/Nano-technology, electronics and applicatory medicine. The database ‘Web of Science’ has indexed over 84000 reports on the topic of ‘biosensors’ from 2005 to 2015[8-15].
3
Table 0.1 The development of biosensors during the period 1970–1992 [15]. 1970 Discovery of ion-sensitive field-effect transistor (ISFET) by Bergveld
1975 Fibre-optic biosensor for carbon dioxide and oxygen detection by Lubbers and Opitz
1975 First commercial biosensor for glucose detection by YSI 1975 First microbe-based immunosensor by Suzuki et al. 1982 Fibre-optic biosensor for glucose detection by Schultz
1983 Surface plasmon resonance (SPR) immunosensor by Liedberg et al.
1984 First mediated amperometric biosensor: ferrocene used with glucose oxidase for glucose detection
1990 SPR-based biosensor by Pharmacia Biacore 1992 Handheld blood biosensor by i-STAT
Figure 1.2 shows the trends in the annual numbers of scientific articles covered by Scopus from 2010 to 2018 in the field of bioreceptor-based biosensors [15].
Figure 0.2 Graphical representation of numbers between 2010 and 2018 of biosensors related studies [15].
4 1.2. TYPES OF BIOSENSORS
Biosensors are generally based on components. They can used enzymes, antibodies, cells, DNA or RNA, and classified based on the components or they can classified by type of the transducers like electrochemical, mass based etc. also they can classified by the interactions between analytes and biological materials that used[15].
Figure 0.3 Categorization of biosensor[15].
Biosensors can be examined under five groups based on bioactive layer-transmission and detection methods. As it is seen in Figure 1.3, Bioreceptor groups are;
(a) Enzyme (b) Antibody (c) DNA (d) Cell based (e) Biomimetic
Transducer groups are as follows; (a) Bioluminescence biosensors
(b) Electrochemical biosensors including; amperometric, potentiometric, voltametric, voltamperometric and conductometric biosensors
(c) Optic based namely photometric, fluorometric (d) Piezoelectric based biosensors
5 (e) Calorimetric in other words thermistors [16, 17]. 1.2.1. Analyte based classification
1.2.1.1.Enzymes
Enzymes are frequently using for the development of biosensors. Enzymes are known as catalyzers and when they used in biosensors they catalyze the production which is specific for the desired molecules. 90 per cent of the biosensor market is composed of glucose biosensors, which are used for detecting glucose in blood samples [18].
Figure 0.4 Schematic illustration of first-, second-, and third-generation amperometric enzymatic biosensors. First generation is based on the electroactivity of the receptor
substrate or the product. Second generation is based on the use of artificial redox mediators. Third generation is based on the direct electron transfer between the
redox-active biomolecule and the electrode [19].
Variety of enzymes were used for biosensor construction, for example oxidoreductase enzymes were used for lactate, malate, ascorbate, amino acids, alcohol, cholesterol, glycerol, fructose and transferase can be utilized in biosensor assisted analysis of acetic acid, determination of xenobiotics such as captan or atrazine, hydrolase in sucrose, lyase in citric acid analysis, ligase in DNA point mutation detection, isomerase for 19-norandrostenedione, etc. There are many different factors that can affect the performance of the biosensor those
6
can be pH, temperature, density, etc. Also thickness of the enzyme layer can be a parameter [18].
1.2.1.2.Antibodies
Hundreds of amino acid sequences bind to each other and these different combinations produces different complex biomolecules known as antibodies. An antigen-specific antibody fits its unique antigen in a highly specific way. High antigen specificity makes antibodies a great bioreceptor molecule for biosensor development.
Figure 0.5 Scheme of direct and indirect electron transduction. a) Direct transduction: the electrons only generate a measurable current if the reaction takes place close to the surface. b) Indirect transduction: with the help of a mediator, that shuttles the electrons between the reaction site and the surface, much larger distances can be overcome. c) Enzyme bound via
7
conducting CNT. d) ELISA-like sandwich setup, where an enzyme labelled antibody binds to the detected antigen [20].
These unique properties of antibodies are crucial to their usefulness in immunosensors, where only the Specific analyte of interest, the antigen, fits into the antibody-binding site. There are two categorize for biomolecular interactions based on test format performed. The firs one is direct and the second one is indirect. Direct format is based on interaction between the immobilized target molecule and a ligand molecule or the immobilized ligand interacts with a target molecule directly. In indirect format, a mediator is used to shuttle the electrons between the reaction site and the surface [19, 20].
1.2.1.3.Nucleic acids
When DNA, RNA and peptide nucleic acid used in biosensors they have a strong base pair affinity and that is the reason of their high sensitivity and selectivity. Nucleic acids (NA) are used for biological recognition element in NA-based biosensors. DNA hybridization sensors are using synthetic oligodeoxyribonucleotides (ODNs) as probes. For immobilizing of ODNs to transducer surface, end-labels such as thiols, disulfides, amines, or biotin, are incorporated. A long flexible spacer is usually added by means of hydrocarbon linkers to provide sufficient accessibility for surface attachment. The electrochemical DNA biosensors, which rely on the conversion of the base-pair recognition event into a measurable electrical signal, are regarded to be suitable candidates for the rapid and inexpensive diagnosis of genetic diseases, the detection of pathogenic biological species of clinical interest, and for the compatibility with microfabrication technology. The complementarity of adeninethymine and cytosine-guanosine pairing in DNA forms the basis for the specificity of biorecognition in DNA biosensors. For the known sequence of bases in DNA molecule the complementary sequence, called a probe, can be synthesized and subsequently labelled with an optically detectable compound (e.g., a fluorescent label). The labelled probe will hybridize to its complementary sequence on the target molecule once the double-stranded DNA is unwound into single strands, then the probe is added, and finally the strands annealed. The formation of the duplex may be considered as evidence that the target has the expected nucleotide sequence. Electrochemical (EC) detection of the formation of a DNA
8
duplex, called hybridization event, is based on the EC signals due to NA electro activity, labelling of the target or the probe with covalently bound electroactive species (e.g., nanoparticles), or changes in various electrochemically detectable DNA properties related to changes in the DNA structure resulting from the hybridization step[21,22]. Aptamers, artificial single-stranded DNA or RNA oligonucleotides (typically <100mer) which are selected from randomized oligonucleotide libraries by SELEX (systematic evolution of ligands by exponential enrichment) are also used to specifically bind with various targets such as proteins, cells, viruses, bacteria, as well as small molecules such as organic dyes, metal ions, amino acids[23].
Figure 0.6 Scheme of the detection of Ramos cells on aptamer-nanoparticle strip biosensor (a) Capturing Au-NP-aptamer-Ramos cells on the test zone through specific aptamer-cell
interactions (b) Capturing the excess of Au-NP aptamer on the control zone through aptamer-DNA hybridization reaction.[24].
Basically, their notable and modifiable stability functions are led up to the development of a new biosensor generation. Aptamers are more resistant to degradation and denaturation unlikely monoclonal antibodies; moreover aptamers and monoclonal antibodies binding
9
affinities are identical. Furthermore, in case of rational design or molecular evolution techniques, binding affinity and properties can also be modified. For this purpose, many functional groups or tags that allow covalent, directed immobilization on biochips, resulting in highly ordered receptor layers are used. Aptamers can act as a chiral selector and therefore can distinguish chiral molecules and recognize a different epitope of a target molecule [25].
1.2.1.4.Whole Cells
These bioreactors are based on biological recognition by either a whole cell/microorganism or a particular cellular component that can specifically bind to a particular species. One of the great advantages resulting from use of whole cells as bioreceptors is low detection limit due to the limitation signal. A lot of biosensors developed with this kind of bioreceptor are based on their catalytic or pseudo catalytic properties. For instance, viable or non-viable microbial cells are using for microbial biosensors. Non-viable cells obtained after permeabilisation or whole cells containing periplasmic enzymes have been used as a cheaper alternative for enzymes. Viable cells utilize the respiratory and metabolic functions of the cell, thus the analyte may be monitored being either a substrate or an inhibitor of these processes [26]. The sensitivity of the cell-based biosensors (CBBs) for certain agonist can be deduced by the receptor-ligand combination constant. CBBs may be applied to analyze the effect of pharmaceutical compound on a given physiological system [27]. There are many complex obstacles when living cells were treated as the primary biosensor, including the selection, the culture and the maintenance of living cells. The coupling of living cells and the secondary sensor represents one of challenges [28]. On the other hand, cell-based biosensors can perform real-time bioassays dynamically and rapidly, and have numerous applications ranging from biomedicine to the environment, for example detection of pathogens and toxins.[29].
1.2.1.5.Biomimetic
The synthetic or artificial bioreceptors that mimic the function of a natural bioreceptors are called biomimetic biosensors. Biomimetic biosensors include aptamers in which they are used as bioreceptors.[30]. Firstly, aptamers were reported as artificial nucleic acid ligands in the early 1990s. Aptamers are chemically associated with nucleic acid probes, but they act
10
like antibodies and show amazing versatility according to other bio-recognition components. Aptamers can be contemplated to recognize amino acids, peptides, proteins and oligosaccharides, namely aptamers are synthetic strands of nucleic acids. An aptamer has very little advantages over antibody-based biosensor such as high binding efficiency, avoiding the use of animal, smaller and less complex, and etc. accordingly, the properties of nucleic acids such as structural pleomorphic and chemical simplicity which reduce assay efficiency and also increase the cost of production, are the common challenges facing the aptasensors. After that, some efforts were made to characterize and optimize the aptamer to overcome this limitation. Aptamer properties used successfully to optimize various bio-sensing formats include; small size, modification and immobilization versatility, high specificity, regeneration, or conformational change induced by target binding [31]. Aptamer based biosensor has been widely used in various application. Biomimetic sensor and aptasensor have recently made adequate progress for clinical practice [32].
1.2.2. Biosensors – Detection Methods Detailed
1.2.2.1.Electrochemical Biosensors
The basic principle of electrochemical biosensor class is that the chemical reactions between inactive biomolecule and target analyte produce or consume ions or electrons that affect the measurable electrical properties of the solution, such an electric current or potential [34].
A)Amperometric Biosensors
Amperometric biosensors are the most common biosensor class. In an enzyme-based amperometric biosensor, the measured signal is the current generated by the oxidation or reduction of the electroactive species at the working electrode (i.e., gold, carbon, platinum, etc.). When a constant potential is applied between the two electrodes, it is observed that the magnitude of the current produced on the surface of the working electrode is proportional to the concentration of analyte in the test solution after the substrate has been added. Enzyme-based amperometric biosensors have been extensively studied because of their advantages such as ease in robustness, miniaturization, and small sample volumes to work with highly complex matrices [35, 36].
11
B)Potentiometric Biosensors
In many enzyme reactions, the ion-selective electrode can be used to monitor these processes as it involves the release or absorption of hydrogen ions that cause the ionic concentration to change. In a potentiometric biosensor, the difference in potential (voltage) between the working electrode and the reference electrode measured under equilibrium conditions is considered signal to avoid interference with the reaction. The measured signals form a function of target analyte concentrations in a logarithmic manner, and are used for quantification. Potentiometric biosensor divided to tree categorizes which is Ion-selective electrode (ISE), enzyme field-effect transistor (EnFET) and light-addressable potentiometric sensor (LAPs) [30].
Electrode Types Used in Electrochemical Biosensors A. Ion Selective Electrodes
An ion-selective electrode converts the activity of a specific ion in a test solution into a voltage and generated voltage can be measured with pH / mV meter. The electrode is generally based on two components: (1) An ion specific membrane for specific ions in the analyte solution, and (2) reference electrode. After the ion transition, electrochemical balance is formed, and a potential difference occurs between the two phases (the reaction solution and the inner/measuring solution). Because of the membrane specificity, this potential difference is controlled only by the activities of a specific ion in these phases. Ion-selective electrodes divided to five main types, which are classify by the nature of the material used to build the electrode; these are: glass membrane electrode, solid-state membrane electrode, polymer membrane electrode, gas-permeable membrane electrode, enzyme electrode. Differences in membrane structure are properties that make an electrode selective for a particular ion. Gas-sensing electrodes and enzyme electrodes are the most commonly used electrodes in electrode biosensors between electrode types. Gas-sensing electrodes have gas-permeable membranes separating an enzyme reaction solution from an internal solution. When gas molecules diffuse across the gas-permeable membrane, they hydrolyze in the thin film of internal solution, leading to variations of some ion concentrations (generally H+), which results in a pH change that could be detected by a pH electrode. Therefore, the potential changes are directly related to the concentration of gas existing [37, 38].
12
Figure 0.7 Schematic diagram of a conventional ion selective electrode [38].
B. Enzyme Field-Effect Transistors
An EnFET sensor is constructed based on an ion-sensitive field-effect transistor (ISFET), which is built by separating the metal gate of a classical MOSFET (metal oxide semiconductor field-effect transistor) from the device, and reconstructing the gate in the form of a reference electrode inserted in an aqueous solution, which is separated with the gate oxide by an enzymatic membrane[38]. When such ISFETs are coupled with the immobilization of a thin enzyme membrane at the gate surface, they become EnFETs. The types of membranes were relatively similar to ion-selective electrode classification, stated in the previous section. The EnFET sensor originates from a pH-sensitive detector, in which the enzymatic catalytic activity is sensitive to the pH level [38, 39].
C. Light-Addressable Potentiometric Sensors (LAPS)
In LAPS, a modulated light from a light-emitting diode (LED) is used for semiconductor activation instead of applying an alternating current (AC) voltage. Under illumination, electron-hole pairs are generated on parts of the semiconductor surface. As a result, a photocurrent is produced and measured under a fixed bias voltage. The LAPS is a semiconductor-based chemical sensor which is built following the electrolyte–insulator
13
semiconductor (EISC) structure. PH-sensitive LAPS that uses LEDs in combination with silicon as semiconductor and SiO2/Al2O3 as pH sensitive insulator was developed to build an EISC-based sensor for the detection of urea, penicillin and glucose [39].
1.2.2.2.Conductometry
Enzymatic reactions often change the electrical conductivity of the electrolyte solution it includes changes in ionic concentration. The conductivity of this solution can be measured by means of a conductive biosensor by applying a potential difference between two parallel electrodes. As a result, ion mobility is increased due to the correct movement of negatively charged ions to the anode and to the cathode towards the positively charged ions. The conductivity of the electrolyte solution only depends on the ion concentration and mobility, so that measurement can be useful when there is no incoming or insignificant electrochemical reactions occur at the electrodes. In a similar manner to other electrochemical based biosensors, the principles and methods of enzyme immobilization on electrodes for an amperometric biosensor are suitable for conductometric transducers. For example, the electrode surface was immobilized, with the enzyme included inside an albumin gel film by the means of covalent attachment using glutaraldehyde [40]. Also, the enzyme was immobilized on an electrode surface by using the sol-gel entrapment method [41], covalent binding with a collagen membrane [42], electrochemical polymerization [43], or cross-linking with bovine serum albumin using glutaraldehyde [44].
1.2.2.3.Impedimetric Enzyme Based Biosensors
The impedance of the electrode in an electrochemical impedimetric biosensor is defined as and measurable change in the impedance value of the circuit.. Electrochemical impedance spectroscopy (EIS) is used to investigate changes in interface properties due to biodiversity events occurring on modified surfaces. The resulting impedance spectrum can then be used to determine the quantitative parameters of electrochemical processes. In enzyme-based biosensors, this impedance measurement technique is used less when in comparison to potentiometric and amperometric techniques, due to the time consumption of a full impedance spectrum record within a wide frequency range. In addition, in order to obtain a valid impedance spectrum in the EIS technique, various requirements such as linearity, stability and causality are met. Therefore, EIS techniques are commonly used as methods
14
that can be characterized for most of the enzyme-based impedimetric biosensors. Shervedani et al. developed an impedimetric biosensor for the determination of glucose based on EIS measurements [45].
1.2.2.4.Optical Transducer Based Biosensor
In recent years, the optical biosensors have undergone rapid advances and have been implemented in a number of key areas such as food safety, life science, environmental monitoring and medical diagnosis [46]. Medically, the optical transducer was established for both routine medical diagnostics and medical research applications [47]. The word “optrode” is a combination of the words “optical” and “electrode” is sometimes used to define optic based device [48]. This method of transduction has employed in many class of biosensor due to the many different types of spectroscopy such as absorption, fluorescence, phosphorescence, Raman, SERS, refraction and dispersion spectroscopy. These transduction methods are capable of measure different properties of analyte/target. Optical-based biosensor with no labeling, real-time and parallel detection [49]. Surface plasmon resonance or fluorescence integrated with optical fiber is the most popular method for biosensors that utilize optical transducers.. It is understood that the optical fiber based sensor is interested in research and used in biosensor studies [50]. This type of biosensor may be based on optical diffraction or electro chemiluminescence principle that a silicon wafer coated with a protein. Covalent then submitted to UV light through a photo veils bond, and antibodies remain idle in uncovered areas. At the point where the chopped wafer chips are incubated in an analyte, the antigen-counteracting agent bonds are formed in dynamic loci and a diffraction milling is performed. This grinding creates a break flag when illuminated by a light source. Optical biosensors consist of various optical sections and also from a light source to produce a light bar with shortcuts to specific features and make a determination that a balancing operator head this light is set next to a photo detector [51]. These biosensors measure both reactant What's more regular slant reactions. They measure an advance for fluorescence on the other hand on absorbance expedited toward the outcomes created toward reactant reactions. On the other hand, they measure those movements provoked in the inborn optical properties of the biosensor surface in view of stacking on it for dielectric particles[51].
15
Piezoelectricity is discovered in 1880 by the Curie brothers [52]. Piezoelectric structures create a gem of a combustion characteristic recurrence which can be used to generate a signal [53].Consequently, in piezoelectric biosensor the transducer is made of piezoelectric material (e.g., quartz) and the biosensing material that secured on the piezoelectric material which vibrate at the basic repeat. The recurrence is controlled by the outer electrical flag which delivers a specific estimation of current, when the objective analyte is presented to the detecting material the connection/response will cause the recurrence move which will create changes in current perusing that can be examined to the mass of the analyte of intrigue. There are two essential sorts of piezoelectric sensors: mass wave (BW) and surface acoustic wave (SAW). In any case, writing indicates piezoelectric sensors are not getting much consideration and second rate contrasted with electrochemical and optical based biosensing. Bulk waves gemstone quartz microbalance and surface acoustic wave transducer, a very basic level for the piezoelectric effect. The unique properties of piezoelectric material are used in this sort of detecting. Quartz is the most customarily used piezoelectric since it is unassuming, can be taken care of to yield single valuable stone and can withstand creation, warm and mechanical weight; regardless, there is report that lithium niobate and lithium tantalate can also be used[54-56]. An existing questionnaire has shown that this strategy is exceptionally interesting when coordinated with Microelectromechanical frameworks (MEMS) for the application of biosensing. In addition, the inspection indicates that such a transmission is suitable for touching, compact and continuous biosensitivity [57]. The most common type of piezoelectric biosensor is quartz crystal microbalance (QCM), which is able to determine nanograms of material. The sensor consists of a thin wafer of quartz-sensing crystal plated with metallic electrodes on either sides of the crystal by means of vapor deposition. When an AC voltage is applied across the crystal-induced piezoelectric effect causes the release of the resonance frequency. Any adsorption of molecules to the surface of the oscillating crystal will cause its frequency to decrease. By measuring this frequency change, the amount of mass per unit area deposited on the surface can be determined with great precision (down to a few billionths of a gram). In an enzyme-based QCM biosensor, the resonance frequency decreases upon the adsorption of the enzymatic product onto the sensor surface. The frequency change (ΔF) is proportional to the mass (Δm) of the adsorbed molecules per unit area. A QCM-based piezoelectric biosensor was developed for urea detection by immobilizing urease onto Nano porous alumina membranes by the means of physical adsorption and cross-linking. Piezoelectric sensors have been attractive, due to their
16
simplicity, real-time measurement, high sensitivity, and cost-effectiveness. However, the major drawbacks of these devices are the interference from atmospheric humidity, and the difficulty in applying for the determination of the material in solution [58].
1.2.2.6.Calorimetric (thermometric)
Calorimetric biosensors are created by immobilization of biomolecules on temperature sensors. When the analyte is in contact with the biological component, the reaction temperature becomes proportional to the analyte concentration which in turn is measured. The total heat produced or absorbed is proportional to the total number of molecules in the molar enthalpy of the reaction. Temperature measurement is made by means of a thermistor, and this enzyme is called to devices such as thermistors. Thermal biosensors do not require frequent recalibration and are insensitive to the optical and electrochemical properties of the sample [59]. Calorimetric biosensors are used in analysis of food, cosmetics, pharmaceuticals [60, 61].
1.3. BIOSENSORS – FORMAT
1.3.1. Microfluidics Format
Many microfluidic devices have been advanced for different chemical and biological applications. Conventional microfluidic systems are based on the continuous flow regimes in micron – sized channels. These microchannels are produced via using soft – lithography methods [62].
17
Figure 0.8 The scheme of three microfluidic systems. (a) Continuous; (b) Drop – based; and (c) Digital [62].
To reduce the sample consumption, and also create isolated reaction sites, droplet-based microfluidic systems have been developed. The first generation of the droplet-based microfluidic systems utilized the continuous stream of two or more fluid mainly intersected at a T – junction to create discrete droplets which are isolated from each other using an immiscible fluid. To further reduce the volume of consumption in the early 2000s, Digital microfluidic (DMF) called droplet based microfluidic system was introduced. DMF systems form droplets on an electrostatic – actuated electrode array rather than having continuous droplets flow through the micro channels. The most widely used operating mechanism array of droplets using an electric field based on modifying the interfacial properties of the dielectric fluid (EWOD) makes electrolysis technique. EWOD technique provides higher localization compared to the other technique. In addition, low power consumption and scalability. This unique feature of these systems makes them a very viable option to apply additional sensing modules. In particular, in recent years, these systems of multiple samples on the same chip are used for numerous applications bio sensing for allowing the parallel
18
processing with high efficiency. Table 1.2 summarizes the operating and actuation methods, advantages and disadvantages of the three different types of microfluidics [62].
Table 0.2 The comparison between the three types of microfluidics [62].
1.3.2. Lateral Flow Assays
The lateral flow assay (LFA) is a paper-based platform for the detection and quantification of analytes in complex mixtures, where the sample is placed on a test device and the results are displayed within 5-30 minutes. Low development costs and ease of production of LFAs have resulted in the expansion of its applications to multiple fields in which rapid tests are required. LFA – based tests are widely used in hospitals, physician’s offices and clinical laboratories for the qualitative and quantitative detection of specific antigens and antibodies, as well as products of gene amplification. A variety of biological samples can be tested using LFAs, including urine, saliva, sweat, serum, plasma, whole blood and other fluids. Further industries in which LFA-based tests are employed include veterinary medicine, quality control, product safety in food production, and environmental health and safety. In these areas of utilization, rapid tests are used to screen for animal diseases, pathogens, chemicals, toxins and water pollutants, among others [63].
19
Figure 0.9 Classification of lateral flow assay[63].
In recent years, with multiple test lines to be perceived as allowing fast and simultaneous multi – analyte present in the sample has been an increasing demand for multiple diagnostic tests for point of care. This type of analysis (potential as a single LFA), laboratory investigations or persons trained in chemical analysis performed should be easy to use. LFAs are very good candidates as they are cheap to produce, easy to use and, importantly, widely accepted by users and regulatory authorities. As the pathway for the development and introduction of novel technologies to the clinical diagnostics market requires hundreds of millions of dollars and decades of work, the improvement and further development of already established LFA technologies is a favorable alternative. This process has the potential to produce devices that may become powerful tools for new challenging applications such as early cancer detection. Moreover, because of the long shelf life and the fact that refrigeration is not required for their storage, LFA are very well adapted for use in developing countries, small ambulatory care settings, remote regions and battlefields. Depending on the elements of recognition used, LFAs can be categorized into different types (Figure 1.9) [63].
20
Figure 0.10 Typical configuration of a lateral flow immunoassay test strip[63].
The principle behind the LFA is simple: a liquid sample (or its extract) containing the analyte of interest moves without the assistance of external forces (capillary action) through various zones of polymeric strips, on which molecules that can interact with the analyte are attached. A typical lateral flow test strip (presented in Figure 1.10) consists of overlapping membranes that are mounted on a backing card for better stability and handling [63].
1.3.3. Paper – Based Biosensor
Biomarkers such as reagents and environmental analytes provide fast, simple, accurate and cost-effective detection which is an important need in biochemical research. For example, methods currently utilized in immunological assays (e.g., enzyme-linked immunosorbent assay {ELISA}) for the detection of biomarkers in bodily fluids (e.g., blood, urine, serum) provide sensitive and reliable results. Likewise, Spectrophotometric methods and environmental reagents (e.g., heavy metal ions in industrial waste water) is used for quantitatively analyzing traditional ELISA, also provides consistent and accurate results. However, sophisticated and lengthy procedures for conducting experiments and evaluate the results highly trained staff requirements and the need for large amounts of reagent and sample, these analytical tools to prevent its use in resource poor environments [64]. Therefore, unskilled users to easily identify analytes and unmet resources for the development of simple and low-cost detection system to provide the ability to assess the results in restricted environment there is a need. Paper-based diagnosis of diseases in
21
applications of biosensors, monitoring of health conditions, environmental agents or exposure to sunlight, detection of pathogens (e.g., bacteria, fungi), and controlling food safety and quality water [65]. Low cost paper-based microfluidic approaches enables the production of flexible and portable diagnostic platform [66]. This simple technology, microfluidic channels to form hydrophobic materials in hydrophilic by modeling paper is used as paper substrates. To test a biological substance (e.g., blood, urine, saliva, sweat, tear) or an environmental reagent (e.g., heavy metal ion, hydrogen sulfide gas) that contains an analyte of interest, the sample is applied to the device and wicked to a detection zone by capillary action without the need to use an external pump[65,67]. Analyte detection from the sample is facilitated by a chemical reaction which induces a change in color, electrochemical properties and light absorption or emission. Among these methods, the most frequently used detection approach is based on colorimetric change. In this method, results can be simply evaluated by formation of a color product generated by ligand-analyte binding (e.g., antibody-antigen) which can be quantified using low-cost benchtop scanners, single-lens reflex cameras, or cellphones [68]. The main advantages of paper include; (i) high surface to volume ratio, (ii) adsorption properties, (iii) capillary action, (iv) compatibility with biological samples, (v) chemical functional groups for immobilization of proteins and antibodies and (vi) straightforward sterilization[65]. Paper also allows for easy disposal via incineration. Furthermore, the ability to store and transport reagents within the paper matrix eliminates the need for users to handle chemical solutions. In addition, paper is lightweight and accessible globally [69]. Finally, paper-based microfluidic devices can be easily fabricated at low-cost using practical fabrication techniques such as wax printing [70]. Paper-based dipstick assays, lateral flow and vertical flow immunoassay test is conducted as a routine for the rapid detection of target analytes. Simple dipstick techniques were initially utilized to quantify the glucose in urine in 1956[71, 72]. Dipstick technique, although convenient and easy to interpret, the main disadvantage of a long analysis times and contained mistakes. Therefore, a variety of lateral flow devices to achieve better performance parameters have been developed in the 1980s. These devices are mostly used for pregnancy tests [73]. Over time, lateral flow assays, screening of blood clots, the detection of samples in pesticides and food and drink has become standard platforms for other applications such as the detection of pathogens (such as Pseudomonas aeruginosa,
22
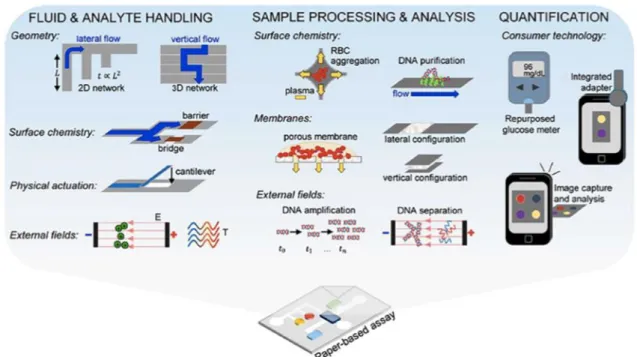
Figure 0.11 Paper-based sensors used in analytical capabilities overview. Processing strategies and the analyte fluid sample processing and analysis and experiments with paper-based processing strategy and the analyte fluid, sample processing and analysis,
quantification [65].
The lateral flow configuration, fluid is pulled horizontally towards a sample detection zone; the fluid flow is directed vertically through the vertical flow immunoassay. Although the direction of fluid flow is the most apparent difference between these two assay formats, vertical flow provides detection more rapidly (as short as 5 min) with a higher detection sensitivity in nanograms per mL. Moreover, Hook’s effect (a phenomenon that is caused by the presence of excess amount of antibodies preventing agglutination), which can lead to inaccurate results in lateral flow assays, is also eliminated in the vertical flow configuration [74]. Thus, more recent studies use vertical flow assays for detection of analytes. For example, Rivas et al. fabricated a paper-based vertical-flow device to analyze microarrays of DNA for detection of N. meningitides [75]. Despite promising Paper-based devices and applications of the sensors, the sensitivity of multiple analytes at the same time, there are some limitations on the accuracy and detection. Recently, paper-based sensors are manufactured by molding to eliminate these drawbacks. In addition to colorimetric technique, chemiluminescence, electroluminescence, other approaches such as fluorescence and electrochemical detection is used to monitor analyte. The analytical approach was
23
applied to the paper-based microfluidic platform; however, the cost of these techniques can also exhibit drawbacks associated with the simplicity and precision [76].
1.3.3.1.Paper Types
Depending on the fabrication method and sensor applications have different types of paper used in paper-based sensor. The most commonly used due to its superior wicking ability of material and paper of Whatman brand chromatography [65]. This particular type of paper has medium retention and flow rate owing to its thickness (180 μm) and pore size (11 μm). Other types of paper such as the Whatman filter paper No. 4, was used due to its larger pore size of 20–25 μm and higher retention rate [77]. More recently, filter paper has been used in paper-based sensors, which is also manufactured by Whatman (Maidstone, United Kingdom). This type of paper has been used for its relatively uniform thickness and wicking properties as well as superior adsorption and retention of reagents compared to the similar types of paper[78]. Biosensors for different physical and / or chemical properties may be subject to other paper categories were examined depending on the target application. Nitrocellulose membranes have been used due to their chemical functional groups that enable covalent immobilization of biomolecules. Nitrocellulose allows for charge-charge interactions, weak hydrogen bonds, and van der Waals interactions with protein-based substrates [65]. As a result of their high protein-binding abilities, these membranes are commonly used in ELISA and gold nanoparticle-based assays [79]. These membranes have also been used, since it prevents the diffusion and infiltration of the samples through the membrane, which leads to a higher degree, and then holding the reaction for a longer period of time allows the sensor. The nitrocellulose membranes are smooth and have a uniform pore size of 0.45 pm. These membranes can be modified by heating the wax after printing, but the nitrocellulose membrane is slower compared to the filter paper permeated wax [77]. In addition to this type of paper it is used in paper of bioactive biosensor. Bioactive paper is replaced by some paper matrix biomolecules. Without modification, only the cationic molecules absorb the wet cellulose fibers forming the paper. In addition, when proteins adsorbed on cellulose, the rate and extent of this process was not effective in comparison to other hydrophilic surfaces [80]; therefore, the cellulose fibers must be modified to absorb biomolecules. This is done by activating the surface of the paper (for example, aldehydes, amides) and then can be covalently conjugated with biomolecules. Furthermore, bioactive paper-based device, supported by paper, the piezoelectric of the enzymes within the
24
biocompatible sol-gel silica layers were produced by inkjet printing [81]. The vaccine also copolymerization of cellulose filter paper glycityls methacrylate, point and gold nanoparticles have been shown to allow ELISA-based test for the immobilization of biomolecules permitted [82]. Glossy paper, were examined at the same time as a viable option for paper-based sensors. Bright paper is composed of inorganic fillers blended from cellulose fibers and paper matrix. Arena et al. used glossy paper in order to develop a flexible paper-based sensing device for detection of ethanol [83]. This special type of paper is used instead of filter paper, because it is easier to change the surface properties of the glossy paper. Common paper of different types in the production of paper-based sensors has been used successfully. A wearable device, folding and was selected to be flexible conventional printing paper intended [84]. The paper was subjected to printing wax and carbon black ink was then spread across the surface of the paper. Additionally, the paper towel was used as a surface for the printing of carbon black modified electrode [85]. Paper towel has also been used as wicking layer for a biosensor produced from filter paper. Paper towel is cheaper than filter paper and possesses a high porosity, which makes it a viable material for analysis of a wide range of analytes [65].
1.3.3.2.Printing and Fabrication Methods
Production method used to produce the biosensor can affect and simplicity of application. There are numerous approaches available that involve chemical modification or physical deposition onto the paper, both of which alter the material characteristics of the cellulose matrix. The approaches that will be covered in this review are wax printing, photolithography, inkjet printing, laser cutting, polydimethyl–siloxane (PDMS), hot embossing, hydrophobic salinization, and the use of origami and kirigami–based approaches. Main fabrication techniques, several advantages and disadvantages of each procedure are listed in Table 1.3 and Table 1.4[65].
25
Table 0.3 Advantages and disadvantages of the main fabrication techniques for paper-based sensors [65].
26 1.4. GLUTEN
Wheat flour is unique among edible grains, because wheat flour, which can be made into a paste with rheological properties, has a protein complex called "gluten"[86]. Gluten on the rheological properties not only for the production of bread, but also just wheat, vid., Noodles, pasta, mobile breads, pastries, cookies and needs within the broader food coverage that can be made from other products is heard[87]. In practice, the "gluten" as used herein, refers to proteins. Gluten determines the water absorption capacity of dough stickiness, viscosity and elasticity of wheat and plays a key role in determining the unique cooking quality [88]. Gluten, oligo- or monomer, with inter-chain disulfide bonds and contains hundreds protein component linked polymer [89].
Figure 0.12 Classification of gluten proteins. Adapted from [94].
One approach to apply effectively the wheat gluten in the food industry, functional properties (such as solubility, emulsification and film forming properties) improve or hypoallergenic infant diet and nutrition therapy intensively for preparing hydrolyzed proteins are widely used in the enzymatic hydrolysis used[91]. However, it has been reported that there were few researchers in antioxidant peptide wheat gluten hydrolysate [91, 92]. The native gluten protein had a high antioxidant capacity of 74.39 mmol Trolox/kg [93]. Gluten, wheat dough when the starch granules and washed to remove water-soluble components can be defined as the rubber mass. Durum average, contained much higher amounts than in the wet milling wheat gluten. Wet gluten ranged from 17.35 to 29.65 per cent and 20.00 to 32.20 per cent in bread and durum genotypes, respectively [94].
27
Depending on the thoroughness of washing, the dry solid contain 75–85 per cent protein and 5–10 per cent lipids; most of the remainder is starch and nonstarch carbohydrates [88, 91]. Gluten, which is present as monomers or inter-chain disulfide linkages and hundreds of oligo protein component linked polymer. Traditionally, gluten protein can be roughly divided into equal fractions: monomeric gliadins and the polymeric glutamines [94]. According to the alternative classification, wheat gluten can be separated into three large groups: Sulphur-rich (Mw of ~50 kDa; α-, β-, γ-gliadins and B- and C-LMW glutenins), Sulphur-poor (Mw ~50 kDa; ω-gliadins and D-LMW glutenins) and high molecular weight (Mw ~100kD; HMW glutenins) proteins. Glutenins and gliadins are recognized as the major wheat storage proteins, constituting about 60-90 per cent of the total grain proteins [94, 95] and they tend to be rich in asparagine, glutamine, arginine or proline but very low in nutritionally important amino acids lysine, tryptophan and methionine [96]. Cysteine, although belonging to minor amino acid of the protein gluten (≈ 2 per cent), is extremely important for the gluten structure and functionality [97].
28
Most of the system generates an intra-chain disulfide bonds between the protein and proteins in the intra-chain disulphide bonds. Dough during development, it can be activated by disulfide bonds, disulfide exchange reactions [98]. Wheat gluten, as the most complex protein, had a high concentration of disulfide bonds (45.37 nmol/mg) [99]. Additional covalent bonds formed during break making are tyrosine–tyrosine crosslinks between gluten proteins and tyrosine–dehydroferulic acid crosslinks between gluten proteins and arabinoxylans. The covalent structure of the gluten network is superimposed by non-covalent bonds (hydrogen bonds, ionic bonds, hydrophobic bonds). Although hydrogen bonds are individually weak, they create stability to the dough when large numbers of bonds are established during the dough development [100]. Hydrophobic and ionic bonds, although present in very small quantities, the interactions between the biopolymers resulting in bread dough to increase dough stability play an important role [101]. The glutenin to gliadin ratio clearly affects the mechanical properties of gluten dough. Expanding gliadin content, is lower than the elongation resistance, extensibility has to be higher. Based on measurements on glutens reconstituted at various glutenin/gliadin ratios, they found that at the constant protein content the main factor determining the rheological behavior of hydrated gluten is the glutenin to gliadin ratio. The effect of gluten proteins on wheat dough rheological properties and bread-making quality is shown in Figure 1.13 [102].
Celiac disease (CD) is a genetic, autoimmune disorder that occurs in reaction to the ingestion of gluten. To develop celiac disease a person must inherit the genetic predisposition, be consuming gluten, and have the disease activated. Activation triggers include stress, trauma (surgeries, etc.) and possibly viral infections and other environmental factors. While approximately 33% of the general population has the genetic predisposition for CD, only about 1% will develop the condition. The reaction to gluten causes inflammation and villous atrophy or flattening of the cells lining the small intestine, which can lead to malabsorption of nutrients and related health issues. There are over 200 identified symptoms of CD, which include those listed above as well as anemia, behavioral changes, stunted growth and infertility. Dermatitis herpetiformis is celiac disease that manifests as a skin rash, and affects approximately 10% of individuals with CD. The rate of CD is higher among relatives of those who are diagnosed, but anyone with the genetic predisposition can develop celiac disease at any age. The majority of individuals with celiac disease are still
29
undiagnosed. At this time the only treatment for celiac disease is to maintain a gluten-free diet for life.
Non-Celiac Gluten Sensitivity (NCGS), also referred to as gluten sensitivity (GS) or non-celiac wheat sensitivity (NCWS), is not well defined. It is not an immunoglobulin E (IgE) (as with wheat allergy, see below) nor autoimmune reaction (as with CD, see above). NCGS may have an innate immune component, but this has not been firmly established. There are no tests or biomarkers to identify GS. Since GS is not well understood it is still not clear whether other components of gluten-containing grains may be involved in causing symptoms, at least in some cases. In order for gluten sensitivity to be diagnosed, it is first necessary to rule out CD, wheat allergy, and other possible causes of symptoms. Then, if improvement is seen when following a gluten-free diet, gluten sensitivity may be diagnosed. Wheat allergy is an immune reaction to any of the hundreds of proteins in wheat. When a person has a wheat allergy, one type of white blood cells, called B-cells, send out immunoglobulin E (IgE) antibodies to “attack” the wheat. At the same time, local tissues in the body send out natural chemical messengers to alert the rest of the body that there is a problem. This reaction happens very fast (within minutes to a few hours) and can involve a range of symptoms from nausea, abdominal pain, itching, swelling of the lips and tongue, to trouble breathing, or anaphylaxis (a life-threatening reaction). A person with a wheat allergy must avoid eating any form of wheat, but does not have trouble tolerating gluten from non-wheat sources. (It is possible for a person to be both allergic to non-wheat and have CD or NCGS.) In the United States, wheat is one of the eight most common foods to which people are allergic. Children who are allergic to wheat may outgrow the allergy, but adults with an allergy to wheat usually have it for life. The only treatment is a wheat-free diet.
1.4.1. Importance of Gluten Detection
1.4.1.1.International Legislation - Codex Alimentarius
Grains that contain gluten (ie, wheat, rye, barley, oats, sourced or hybridized strains and their products) as one of the ingredients and components known to cause hypersensitivity should always be indicated on the label of pre-packaged foods [103]. Cereal, as well as contain gluten, the standard 10 mg / kg or greater than concentration of the main food allergens shellfish, eggs, fish, peanuts, soybeans, milk, includes tree nuts and sulfites. More specific
30
legislation regarding gluten-free products, in 2008, the latest revised gluten is defined in the Codex Standard for Foods for Special Diet Used in retaining the People. [104]. This standard defines that “gluten-free foods are dietary foods consisting of or made from one or more ingredients which do not contain wheat (i.e., all Triticum species, such as durum wheat, spelt, and kamut), rye, barley, oats or their crossbred varieties, and the gluten level does not exceed 20 mg/kg in total, based on the food as sold or distributed to the consumer.” Alternatively, consisting of cereal foods containing gluten, specially processed to remove gluten, so that the level 20 mg / kg does not pass. Regarding Oats, national arrangements can be made, because the majority of uninfected people who are not gluten intolerance can tolerate oats are accepted. In subsidiary definitions “gluten is defined as a protein fraction from wheat, rye, barley, oats or their crossbred varieties and derivatives thereof, to which some persons are intolerant and that is insoluble in water and 0.5 M NaCl”. “Prolamins are defined as the fraction from gluten that can be extracted by 40e70 per cent of ethanol” and the “prolamin content of gluten is generally taken as 50 per cent”. The decision on whether or not to use the term “gluten-free” on the label lies with each manufacturer and the product is only subject to the respective regulatory framework if a voluntary gluten-free claim is made [105].
1.4.1.2.European Union Regulations
Definitions, thresholds, and labelling currently specified in the European Commission Regulation (EC) No 41/2009 of 21 January 2009 are equivalent to those in Codex Standard 118-1979 (2008) [104,106]. The new Regulation of the European Parliament and of the Council (EU) (2013), No 609/2013 ‘on food intended for infants and young children, food for special medical purposes, and total diet replacement for weight control’ to be implemented from 20 July 2016 will repeal EC No 41/2009 [107]. As stated in article 41 of No 609/ 2013, the rules on the use of the statement “gluten-free” are to be regulated under Regulation of the European Parliament and of the Council (EU) (2011), No 1169/2011 ‘on the provision of food information to consumers’ [108]. The EU 1169/2011, which entered into force on 13 December 2014, aims to provide a high level of consumer protection by setting requirements for food information and labeling of prepackaged and unpackaged foods. In accordance with this regulation, it will be necessary to indicate that any component or processing aid listed in Annex II will cause allergies or intolerances to be used in food
31
preparation and still in altered form in the finished product. The substances listed in Annex II include gluten, that is, wheat, rye, barley, oats, sliced, kamut or their hybridized strains and products derived there from. The rules on the use of /2011 gluten-free lu in 41/2009 / EC will be transferred to EU No 1169/2011 to provide at least the same level of protection for persons with gluten intolerance currently provided. It should also be noted that CD patients are sufficiently aware of the difference between a specially processed food to reduce gluten content and other foods derived from naturally only gluten-free content [105].
1.4.2. How It Is Measured?
1.4.2.1.Legislation Regarding Gluten Measuring
Codex Standard 118-1979 (2008) specifies the general requirements for gluten analysis and sampling methods. The quantitative determination of gluten in foods and components in an immunological method or providing at least the same sensitivity and specificity should be based on another method. The antibody used by cereal protein fractions that are toxic to people are intolerant to gluten must react and should not cross-react with other components. The methods should be approved and calibrated according to an approved reference material (RM), if any. The limit of detection according to the technology must be suitable and 10 mg gluten / kg or less should be. The qualitative analysis that indicates the presence of gluten shall be based on relevant methods (e.g., ELISA-based methods, DNA methods). More specifically, Enzyme Linked Immunoassay R5 Mendez Method is expressed in a type I method for determining gluten. A type I method, also called defining method, is defined as “a method which determines a value that can only be arrived at in terms of the method per se and serves by definition as the only method for establishing the accepted value of the item measured”. However, in February 2015, the American Association of Cereal Chemists International (AACCI) successfully proposed changes to Codex Standard 234-1999 (2014) on ‘Recommended Methods on Analysis and Sampling’. Because of the recent developments in method development and validation, two immunological tests will be determined as type I methods. The first is based on the R5 monoclonal antibody (mAb) and recommended for gluten analysis in maize matrices and the second is based on the G12 mAb and recommended for rice matrices. Both methods fulfil the requirements for gluten analysis, but effects of matrices on recovery should be taken into account when using these methods
![Figure 0.1 Schematic show of a biosensor [1].](https://thumb-eu.123doks.com/thumbv2/9libnet/4245842.67250/13.892.169.805.144.504/figure-schematic-biosensor.webp)
![Table 0.1 The development of biosensors during the period 1970–1992 [15]. 1970 Discovery of ion-sensitive field-effect transistor (ISFET) by Bergveld](https://thumb-eu.123doks.com/thumbv2/9libnet/4245842.67250/14.892.147.813.163.532/table-development-biosensors-period-discovery-sensitive-transistor-bergveld.webp)
![Figure 0.7 Schematic diagram of a conventional ion selective electrode [38].](https://thumb-eu.123doks.com/thumbv2/9libnet/4245842.67250/23.892.238.735.163.459/figure-schematic-diagram-conventional-ion-selective-electrode.webp)
![Figure 0.8 The scheme of three microfluidic systems. (a) Continuous; (b) Drop – based; and (c) Digital [62]](https://thumb-eu.123doks.com/thumbv2/9libnet/4245842.67250/28.892.169.786.165.556/figure-scheme-microfluidic-systems-continuous-drop-based-digital.webp)
![Figure 0.9 Classification of lateral flow assay[63].](https://thumb-eu.123doks.com/thumbv2/9libnet/4245842.67250/30.892.161.803.178.381/figure-classification-of-lateral-flow-assay.webp)
![Table 0.4 Main fabrication techniques for paper-based sensors [65].](https://thumb-eu.123doks.com/thumbv2/9libnet/4245842.67250/36.892.153.808.497.1159/table-main-fabrication-techniques-for-paper-based-sensors.webp)
![Figure 0.12 Classification of gluten proteins. Adapted from [94].](https://thumb-eu.123doks.com/thumbv2/9libnet/4245842.67250/37.892.163.797.524.755/figure-classification-gluten-proteins-adapted.webp)
![Figure 0.14 Principles of ELISA. A: sandwich ELISA, B: competitive ELISA. For explanation of the different steps [105]](https://thumb-eu.123doks.com/thumbv2/9libnet/4245842.67250/47.892.150.809.145.642/figure-principles-elisa-sandwich-elisa-competitive-explanation-different.webp)
