T.C.
ISTANBUL AYDIN UNIVERSITY
INSTITUTE OF SOCIAL SCIENCES
FINANCIAL ASSESSMENT OF COMPANY MERGERS THE
EXAMPLE OF TURKEY
Master Thesis
Farahnaz Musa
Department of Business
Business Administration Program
Thesis Advisor:
Assistant Prof. Dr. Zelha ALTINKAYA
T.C.
ISTANBUL AYDIN UNIVERSITY
INSTITUTE OF SOCIAL SCIENCES
FINANCIAL ASSESSMENT OF COMPANY MERGERS THE
EXAMPLE OF TURKEY
Master Thesis
Farahnaz Musa
(Y1112.130023)
Department of Business
Business Administration Program
Thesis Advisor: Assistant Prof. Dr. Zelha ALTINKAYA
iii FOREWORD
The aim of this study is to measure the effect of company mergers. The purpose of companies is to make a profit that enables them to protect their assets, to minimize the potential hazards to their assets in other words the risk, to maximize the growth rate,to maintain their independence and to meet the financial needs required by growth at least partly. This purpose can be described as maximizing the company's market value in the most general sense.
Modern industries have been more likely to grow and develop especially since the end of last century. The size of companies can be measured by various indicators such as growth rates, the amount of equity, the sales volume, the production value, the number of employees, the amount of assets (investments) and profit. Surely, every scale has a particular importance and meaning based on its intended purpose. The company's business volume and hence its investment amount comprising constant and working values can be argued to be more useful scales to measure the size and growth rate of company.
The significance of company mergers cannot be ignored in such a competitive environment. However, it is a fact that company mergers have not only advantages but also disadvantages as in each field. In this respect, the underlying point of our study is evident. How do company mergers make progress in a competitive environment and what contributes to this progress?
Starting my research with the status of company mergers in the overall economy will help us to see where company mergers stand in the overall economy. Therefore, it will be more appropriate to start with the historical picture of company mergers. After that, we will focus on the merger of Turkish companies following the development of international companies.
I owe Assistant Prof. Dr. Zelha Altinkaya, my dear teacher who helped me to understand that my research was not for notes but to learn, a debt of gratitude for her help, support, patience and knowledge.
ix TABLE OF CONTENT Page FOREWORD ...III TABLE OF CONTENT... IX ABBREVIATIONS ... XII ÖZET ... XV ABSTRACT ... XVI 1. INTRODUCTION ... 1
2. MERGERS AND ACQUISITION ... 3
3.THEORIES AND MAJOR CAUSES OF COMPANY MERGERS... 6
3.1.Oligopolistic Reaction to Foreign Direct Investment Theory ... 6
3.1.2. The Ownership, Location and Internalization Model ... 7
3.1.2.1 The ―O‖ advantages: ... 7
3.1.2.2 The ―L‖ Advantage from Location: ... 7
3.1.2.3 ―I‖ from Internalization: ... 7
3.2. Major Causes of Company Mergers ... 9
3.2.1 Tax Advantage ...10
3.2.1.1. Shareholder Taxation ...10
3.2.1.2. Corporate Taxation ...10
3.2.1.3. Tax Losses and Credits ...10
3.2.2. Globalisation Drivers ...10
3.2.3. Capacity Reduction ...11
3.2.4. Reduced Competition ...11
3.2.5. Psychological Causes ...11
3.3. Company Mergers in the World Economy ...11
3.3.1. The First Merger Wave (1897-1904) ...15
3.3.2. The Second Merger Wave (1916-1929) ...16
3.3.3. The Third Merger Wave (1965-1969) ...17
3.3.4. The Fourth Merger Wave (1981-1989) ...18
3.3.5. The Fifth Merger Wave (1992-2002) ...19
3.3.6. The Sixth Merger Wave (2003 and later) ...21
3.4. Benchmarking of Big World BankMergers ...22
3.4.1. Chase Bank ...22
3.5. Company Mergers in Turkey ...25
3.5.1. Mergers in Turkey in 2002 ...27 3.5.2. Mergers in Turkey in 2003 ...28 3.5.3. Mergers in Turkey in 2004 ...29 3.5.4. Mergers in Turkey in 2005 ...30 3.5.5. Mergers in Turkey in 2006 ...31 3.5.6. Mergers in Turkey in 2007 ...33 3.5.7. Mergers in Turkey in 2008 -2014 ...34
3.6. Comparing World and Turkey Mergers ...40
4.MERGER PROCESS AND FINANCIAL EVALUATION OF MERGERS ...44
4.1. Planning Mergers ...44
4.1.1. Size ...44
x
4.1.3. Efficiency ...45
4.1.4. Ensuring Stability in Revenues ...45
4.1.5. Effective Control ...45
4.1.6. Assessment of Strengths and Weaknesses ...45
4.2. Searching and Selecting the Candidate Companies for the Merger .46 4.3. Analysis of The Merger Terms ...47
4.3.1. Quantitative Factors Influencing the Merger Terms ...47
4.3.1.1. Future Revenues and Growth Rate of the Companies ...47
4.3.1.2. Distributed Dividend ...48
4.3.1.3. Market Price of the Shares ...48
4.3.1.4. Book Value of the Merging Company ...49
4.3.1.5. Liquidation Value of the Company to Merge with ...49
4.3.1.6. Net Working (Business) Capital of Company to Merge with .49 4.3.1.7. Pledging Company Assets as Security ...50
4.3.2. Qualitative Factors Influencing Merger Terms ...50
4.4. Financial Assesment and Methods Used ...51
4.4.1. The book Value ...51
4.4.2. The Market Value ...52
4.4.3. The Going Concern Value ...53
4.4.4. The Liquidation Value ...53
4.4.5. The Actual Value ...54
4.5. Financing Mergers ...54
4.5.1. Cash Offer ...55
4.5.2. Share-for-Share ...56
4.5.3. Payment by Notes Payables ...57
4.5.4. Payment by Shares of the Third Parties ...57
4.6. Completing Process and Integration ...57
4.7. Discouraging Mergers ...58
4.7.1. Golden Parachute ...58
4.7.2. White Knight ...59
4.7.3. Crown Jewels Lock Up ...59
4.7.4. Pac-Man Defense ...59
4.7.5. Making Changes in the Articles of Incorporation ...59
4.7.6. Greenmail ...60
4.7.7. Poison Pills ...60
4.8.Success at Mergers ...61
4.8.1.Balance in Power of Companies to Merge ...61
4.8.2. Previous Performance analysis in Companies to Merge ...62
4.8.3. Assessment of the Management of Company to Merge ...62
4.8.4. Investigation of Personnel and Organizational Issues of Company to Merge ...62
4.8.5. Investigation of Assets of Company to Merge...63
4.8.6. Arranging Merger Meetings Meticulously ...63
4.8.7. Estimation of Financial Burdens of the Merger ...63
4.9. Rational Merger Policy ...64
4.9.1. Compatibility of Companies with Each Other ...64
4.9.2. Allocation of Responsibilities and Authority in the Company ...64
4.9.3. Determination of Dividends Policy ...64
4.9.4. Common Goals and Understanding ...64
4.9.5. Realization of the Problems in the Beginning and Taking Early Measures ...65
4.10. Causes of Merger Failure ...65
4.10.1. Vision ...65
4.10.2. Leadership ...65
xi
4.10.4. Early Gains ...66
4.10.5. Cultural Differences ...66
4.10.6. Communication ...67
4.10.7. Risk Management ...67
4.10.8. Foreign Direct Investment ...67
5.ASSESSMENT OF COMPANY MERGERS IN TURKEY ...69
5.1. Methodology ...69
5.1.1. Purpose ...69
5.1.2. Significance ...70
5.1.3. Research Question ...70
5.2. Grundig –Arcelik Merger ...70
5.3. Migros –Tansas Merger ...73
5.4. Yapı Kredi –Kocbank Merger ...74
5.5. Deniz bank- Sberbank Merger ...78
5.5.1.Test of Hypothesis on Positive Effects of Mergers and Acquisitions of Banking Industry in Turkey ...84
6. CONCLUSION AND RECOMMENDATIONS ...86
REFERENCES ...88
xii ABBREVIATIONS
BNP : Banque Nationale de Paris
BRSA : Banking Regulation and Supervision Agency
CIB : Corporate and Investment Banking
CTX : Corporate Tax Law
DCF : Discounted Cash Flow
EBITDA : Earnings Before İnterest, Taxes, Depreciation, And Amortization
ENI : Ente Nazionale Idrocarburi
EU : European Union
INC : Incorporated
KKR : Turkey to Kravis Roberts's
KPMG : Klynveld Peat Marwick Goerdeler
OECD : Organisation for Economic Co-operation and Development
OMV : Österreichische Mineralölverwaltung
POAS : Petrol Ofisi Anonim Sirketi
POS : Point Of Sales
SDIF : Saving Deposit and Insurance Fund
S.A. : Sociedad Anonima
TCDD : Türkiye Cumhuriyeti Devlet Demiryolları
TME : Trader Media East
TUPRAS : Türkiye Petrol Rafinerileri Anonim Sirketi
TPG : Texas Pacific Group
USA : The United States of America
UNCTAD : United Nations Conference On Trade And Development
xiii LIST OF TABLES
Page
Table 3.1: Volume of Mergers Worldwide and Across Continents ...14
Table 3.2: The Number of Merger between 1897 and 1904 ...15
Table 3.3: Types of Mergers between 1895 and 1904 ...16
Table 3.4: Distribution of the Number of Mergers between 1926 and 1968 ...18
Table 3.5: Ten Important Acquisitions between 1981 and 1989 ...19
Table 3.6:Some Significant Mergers between 1997 and 1998 ...20
Table 3.7: Financial highlights of Chase bank 2013 ...23
Table 3.8: Income of Santander Bank between 2010-2014/ Million ...24
Table 3.9: Number of Transactions (2002) ...28
Table 3.10: Industrial Distribution of Target Companies Based on Number and Value of Transactions ...28
Table 3.11 : Acquiring Countries' Shares in Merger and Acquisition Activities in Turkey Based on the Value and Number (2004) ...30
Table 3.12: Top Ten Transactions in Turkey in 2005 ...31
Table 3.13: Top Ten Transactions in Turkey in 2006 / Million $ ...32
Table 3.14: Top Ten Transactions in Turkey in 2007 / Million $ ...34
Table 3.15: Top Ten Transactions in Turkey in 2008/ Millions $ ...36
Table 3.16: 2014’s Biggest Announced Mergers and Acquisitions/ $ Billion ...39
Table 3.17: Turkish Banks - Ranked by Total Assets by 2014/ USD $ Million ...40
Table 3.18: World Banks - Ranked by Total Assets, as of December 31, 2014 ...41
Table 3.19: Foreign Invesments to Turkey ...42
Table 5.1: Arçelik-Grundig Before, the Values of Market Multiples / TL ...70
Table 5.2: Arçelik-Grundig After the Merger, DCF Value Index ...71
Table 5.3.: Migros' Status After and Before the Merger ...73
Table 5.4:Participation Status of YapıKredi-Koc Finans ...75
Table 5.5:Yapı Kredi Bank Financiall Ratio before and after merger ...77
Table 5.6: Denizbank and Sberbank Merger ...83
xiv LIST OF FIGURES
Page
Figure 3.1: Statistical information of mergers that occured across the world between
the years of 1985-2011 in terms of their number and value ...13
Figure 3.2: Announced Mergers and Acquisitions: Europe, 1995-2015 ...21
Figure 3.3: Foreign Invesments to Turkey ...42
Figure 5.1:Arçelik-Grundig before Merger, The Values of Market Multiples ...71
Figure 5.2: Arçelik-Grundig after the Merger, DCF Value Index ...72
Figure 5.3: Migros' Status After and Before the Merger ...74
Figure 5.4: Participation Status of YapıKredi-Koç Finans ...75
Figure 5.5:Yapıkredi Stock Prices before and after merging …….……… 77
Figure 5.6: Denizbank and Sberbank Merger ...83
xv
ġĠRKET BĠRLEġMELERĠNĠN FĠNANSAL DEĞERLENDĠRMESĠ TÜRKĠYE ÖRNEĞĠ
ÖZET
Değişen dünyamızda etki alanı en büyük gelişmelerden biri olan globalleşme, şirketleri değişen pazar ve rekabet şartlarına uyum gösterebilmek için yeni çözümler geliştirmek mecburiyetinde kalmışlardır. Birleşme, işletmelerin çözüm arayışları neticesi gündeme gelmiş ve özellikle son senelerde yaygınlık kazanmaya başlamış gelişmelerden biri olmaktadır.
Birleşmeler ve satın almalar finansta yeni bir kavram değildir. Geçen yüzyıl boyunca çok sıklıkla görülmüşlerdir. Firmalar, değer yaratmak amacıyla birleşme ve satın alma yapmaktadırlar. Değer yaratmak birleşmelerin ve satın almaların en önemli yapılma nedenidir. Bu çalışmada Türkiye’de birleşme ve satın almalar Grundig-Arçelik, Yapı Kredi-Koçbank, Denizbank- Sberbank ve Migros-Tansaş kapsamında incelenmiştir. Araştırma sonuçlarına göre şirket birleşmelerinin çoğu finansal sektörde, gıda ve içecek sektöründe görülmüştür. Türkiye’de şirket birleşmelerinin çoğunluğu yabancı şirketlerle yapılmıştır. Ülkenin ana sanayi dallarını oluşturan ve bunlara bağlı kuruluşların yabancı yatırımcılar için cazip olduğu tespit edilmiştir. Anahtar Kelimeler: şirket birleşmeleri, şirket satın almaları, Türkiye’de birleşme ve satınalmalar, Türkiye’de banka birleşmeleri
xvi
FINANCIAL ASSESSMENT OF COMPANY MERGERS THE EXAMPLE OF TURKEY
ABSTRACT
In changing environment of today's world, globalization has been one of the biggest developments. Therefore, companies have had to create new solutions in order to adapt to changing market and competitive conditions. Merging has become a recent issue as a result of companies' search for a solution. Merging has been one of the most common developments especially in recent years.
Mergers and acquisitions are not new concepts in the field of finance. They have been seen very often over the last century. Companies resort to engage in activities of merger and acquisitions in order to create value. Creating value is the most important reason for mergers and acquisitions. In this study, mergers and acquisitions in Turkey were examined with Grundig-Arcelik, Yapı Kredi-Kocbank, Denizbank-Sberbank and Migros-Tansas. According to a study, most of these mergers were seen especially in financial services and food and beverage sectors. It is seen that a great deal of mergers and acquisitions in Turkey have been performed by foreign buyers. Holdings having a corner on the country's main industries and their affiliated companies are seen to be more attractive to foreign investors.
Keywords: company mergers, purchase of company, mergers and acquisitions in Turkey, bank mergers in Turkey
1 1. INTRODUCTION
Changing with 1980 liberalization policies, enforcing policies followed by the membership of Customs Union, Turkish economy became very attractive economy for foreign direct investors. The number of foreign direct investment in Turkey increased considerably due to the change of profile of the busiess where offered opportunities in the areas of merger and acquisition, franchising and real estate for foreign companies and private investors. After 2002, weak FDI inflows, showed an incremental increase and reached a record level of 22 billion USD in 2007. However, due to global crisis and slowing down of Turkish economy, foreign direct investment decreased to 12 billion USD in 2014. However, it is still very popular subject. Especially, mergers in financial service companiesare one of the most popular sectors for foreign direct investments.
Companies competitive both in national and international market are the ones that achieved a certain size. Merging with other companies is a way of achieving competitive optimal firm size. Indeed, the number of mergers has been increasing rapidly not only within national but also in international dimensions. Mergers performed frequently after the economic policies implemented in 1980 boosted the importance of the issue. In Turkey, mergers can be used as an essential tool to increase the effectiveness and rationality of companies. In addition, companies in difficulty might see merging as a useful method to get rid of this situation. Analyzing Finance performance of the mergers is the main objective of this study.
Today's world economy hinders activities of non-competitive companies with inadequate distribution channels, old and inadequate technology and lacking of a sense of modern management from being effective and profitable. Companies have to concentrate on some activities such as technological investment, cost reduction measures, many research and development activities in order to survive under these new competitive conditions posed by the phenomenon of globalization. Companies must be big enough so that they can continue to operate in the new competitive conditions. This situation makes companies to collaborate with other companies, establish strategic partnerships and tend to resort mergers in more advanced stage.
2
In this thesis, the effects of mergers will be assessed with the specific example of banking industry in Turkey. So, the question will be as follows:
Do companies merging have a more advantageous structure following the merger compared to its financial status before the merger?
This question in this thesis examines the effects of participating in merger and acquisition. After, literature review on the outcomes of the mergers and acquistions in different sectors and all over the world will be analysed specific case of banking industry.To be able to assess the financial performance, the financial ratio analysis will be used.The quantitative research methodology will cover analysis of the financial statements of the company and comparing the results of with previoıus and latest values of the target company and purchasing company. In addition will be analysed revenue, gross profit margin, return on euqity, return on asset.
Two cases were chosen in this study and analyzed for a more clear understanding; the M&A activity between Yapıkredi Kocbank and the M&A activity between Russian based Syber Bank and Turkish based Denizbank. The findings entails that both companies are on a sound performance before the merger and acquisition activity The study consists of three parts to achieve this purpose.
In the first part of the study, definition, causes of mergers and mergers in Turkey also in the world were investigated in detail.
In the second part of the study, the financial evaluation and the process of merging were mentioned.In addition included the reasons for failure of mergers.
In the last part of the study,the mergers and acquisitions in Turkey were investigated in Grundig-Arcelik,YapıKredi-Kocbank,Denizbank-Sberbank and Migros-Tansas.
3 2. MERGERS AND ACQUISITION
The terms `mergers', and `acquisitions' are often used interchangeably. However, there are differences. While merger means unification of two entities into one, acquisition involves one entity buying out another and absorbing the same. There are several advantages in M&A — cost cutting, efficient use of resources, acquisition of competence or capability, tax advantage and avoidance of competition are a few(Kusum, 2014:62).
Merging generally results from a mutual agreement. Merging takes place under relatively equal conditions. Equal condition refers to neither fifty-fifty partnership nor going halves in the shares. A big and rich company can form a new company with a small business having high abilities by getting 90-10% of shares under relatively equal conditions. Equality is not the equality in share, but it is the relative equality in "right" "agreed on and accepted by the parties.
In theory, the parties are expected to compromise on technical and legal requirements of merging activities after discussing about them. The parties are believed to come together after discussing a range of issues. The negotiation process is not experienced in a friendly environment in some cases. However, the merging processes beginning in a hostile environment sometimes ended in a friendly manner as a result of intense negotiations. On the other hand, it cannot be said that every merger process finishes friendly. The parties' desire to be more powerful and dominant on the agreement is shown as the reason of hostile environment (Geppert and Kamerschen, 2008:331).
Companies' decision to merge is firstly discussed in the management authorities. After the management authorities make a decision to merge, shareholders are requested to vote. The first agreement is made by managers (Surroca, Tribò and Waddock, 2010:464).
Mergers have 3 forms: Horizontal Vertical Mix
4
Horizontal integration is a strategy where a company creates or acquires production units producing either complementary or competitive to their output. If a company acquires company rival to itself in the same industry cause a monopoly (Sahin and Yilmaz, 2010:78). Another example is the management of a group of products which are alike, yet at different price points, complexities, and qualities. This strategy may reduce competition and increase market share by using economies of scale. Horizontal integration is orthogonal to vertical integration, where companies integrate multiple stages of production of a small number of production units.
Vertical mergers resulting from expansion of the company forward to the last consumer or back to the source of raw material enable the company to have more control over acquisitions and distribution. Disadvantageous aspect of vertical mergers is expansion into markets having the same stages of development and the same periodic fluctuations.
Mixed mergers emerge when two companies that work for unrelated businesses with each other merge. These mergers provide some benefits, too. In mixed mergers, even though benefiting from economies of scale is rare, savings in some areas like production overheads, accounting and office services can be achieved (Cartwright and Schoenberg, 2006).
Growing is an important factor that companies must achieve to prove their success and carry on. Several reasons for why the companies that have to grow prefer to merge have been mentioned in the literature. The number and importance of these reasons can vary depending on countries' socio-economic conditions, the characteristics of the company, the environmental characteristics and the time period (Berger, et al, 2004: 335).
Merging is a tool for companies to grow. Therefore, the motivations of companies to grow are similar to the reasons for merging. Growth enables the company to develop before its competitors and helps to fight against the difficulties encountered and survive challenges. The main factor prompting the companies to grow is economy. In addition, psychological factors related to business owners and managers such as dynamism and creativity also play an important role in growth (Burksaitiene, 2010: 33).
Financial synergy can be defined as the increase in the value of the company as a result of the improvement in the financial structure of company or companies established after the merger and acquisition. This synergy can be summarized under three interdependent variables which are reduction of financial risk, increase
5
in the profitability of equity by benefitting from financial leverage and decline in the company's capital costs due to the improvement of financial structure. The decline in the capital costs can be attributed to the capability of the company established after the merger and acquisition of getting cheaper credit due to improvement in its financial position, management effectiveness and profitability and partners' acceptance of less productivity due to the increasing trust.
It is believed that the reduction of financial risk within the scope of the improvement of the company's financial structure would handle the problem of cash need in some periods by making regular cash flows of two companies if the periodic cash flows of the companies are exposed to seasonal fluctuations and these fluctuations change based on the different seasons. In addition, the improvement in the economic and financial structure of the company established after acquisition and merger can reduce the financial risk. When a company with more financial power acquired another company with a lower value of financial aspects, the resulting increase in the value can be observed thanks to resolving the financial stress of the financially weak company. Mergers and acquisitions can act as financial leverage (Yeldan, 2008: 1).
6
3.THEORĠES AND MAJOR CAUSES OF COMPANY MERGERS
3.1.Oligopolistic Reaction to Foreign Direct Investment Theory
Oligopolistic reaction theory describes the choice of a firm to contribute investment abroad that raises firms' motivations to put resources into the same nation (Knickerbocker, 1973). The analyses of industrial organizations shows that firms’ actions are strategic complements when an increase in the action of one firm raises the marginal profitability of an increase in the action for another firm.
The Oligopolistic Reaction theory is based on market imperfections. The key important factors firms consider in choosing locations for setting up new plants are:
- Expansion by accession to the host nation's business sector - Using copious variables accessible in that nation
- Put resources into a nation to match a competitors' action (Head et al, 2002)
Organizations imitates the others conduct in general. After, internationalization of contenders they follow by policies to have their vital favorable position. Specifically, in oligopolistic market structure, firms in an industry have a tendency to take after location decision.
After extensively gathering data of over 200 companies and analyzing them, Knickerbocker (1973) put forward oligopolistic response is exemplified by a its portion of the world's commercial ventures. Inside of the oligopoly commercial enterprises, firms are couple of enough in number to perceive the effect of their activities on their opponents and the other way around (Gwynne, 1956). Knickerbocker's concluded that oligopolistic response remains constant just when instability exists about expenses in the host nation. Head and the others also contributed to the analyses Knickerbocker stating that oligopolistic firm will set up a unit in an outside nation once one or a greater amount of its opponents invest there (Head et al, 2002).
7
3.1.2. The Ownership, Location and Internalization Model
In discussing the ―Ownership, Location and Internalization― (OLI) model, the theory of eclectic paradigm of Dunning was anchor on three mix of different theories to explain foreign direct investment (Dunning,2002:vol1).This theory put into considerations the advantages generated by ownership, location and the international environment. The theory focuses on explaining the purpose and the motivational power of FDI and how resource allocation and the organizational structures of the firm are interconnected. Also, it analyzes the market advantages by taking care of firms’ needs on both national and international perspective.
3.1.2.1 The “O” advantages:
The ―O― represent the Ownership advantage that explain the intangible assets of firm possess transferred by either by low cost or higher income. Corporations must possess certain characteristics to be able to enter to foreign market successfully. Monopoly power would arise due to ownership of natural limited resources, patents, trademarks; technology or knowledge. Knowledge covers all forms of innovation.
3.1.2.2 The “L” Advantage from Location:
The bases of location theory focus on location advantage like to the distance to raw materials sources, transport network, labor and market enhances FDI flow. The basic advantages accruing from location in a particular market are divided into three categories as stated:
1. Quantitative and qualitative advantage on cost of factors of production, transportation or telecommunications, market size.
2. Political advantagesoffered by government policies affecting FDI flows 3. Social advantages: covers distance between the home and home
countries, cultural diversity, attitude towards strangers etc.
As the economic environment capacity for both local and international community open up to the globe, large corporations are the coordinating economic relations much more better than national economies.
3.1.2.3 “I” from Internalization:
Internalization provides advantge to firm to be more profitable by carrying out transactions within the firm rather than external markets. The higher cross-border
8
market Internalization benefits is the more the firm will aspire to engage in foreign production.
OLI parameters may be different from company to company and reflect the economic, political, social characteristics of the host country. The objectives and strategies of the firms will depend on the challenges and opportunities offered by different types of countries (Penrose,1995:3).The acquisition can be much more irresistible if the organization being purchased likewise is an extreme contender holding a huge piece of the overall industry in an oligopoly market sort (Penrose,1995:1-3) A traditional organic growth argument depends on excessive management capacity, whereas a merger already includes the management capacity necessary to handle the acquired resources (Penrose,1995:1-3).The remaining companies that can be bought gets smaller. Acquiring many small firms instead of one large firm requires more management capacity, and hence acquisitions will ultimately no longer be an effective growth method (Penrose,1995:1-3).
Since merging is a tool for growing, the motives of the companies to grow are also valid for merging. Many reasons for why the companies that have to grow choose to merge have been mentioned in the literature. The number and importance of these reasons vary based on socio-economic conditions of the country and company's characteristics (Schoop, 2013:8).
In fact, motivators of companies to merge can be summarized in one aim. This is company's belief that it can increase the present value if it merges with another company. The same motivation is also valid for the other company that is merged with.
A successful merger can meet this expectation only if the formula V (A+B) > V (A) + V (B) is achieved.
In this formula,
V (A) refers to merged company A's market value and
V (B) stands for merged company B's market value. This is a synergy effect and it is expressed as "the whole is more than the sum of individual parts" (Sahin and Yılmaz, 2008:68). In other words, the economic power gained with merging is greater than the sum of economic entities of each merged company. A larger value than production, investment and marketing power of each company arises.
9
Although a wide variety of causes of merging exists, some significant ones are explained below.
Easier accession to technology and products, an extended customer portfolio, an extended customer base, an strenghtened market share and a stronger financial position are offered as an advantage by the mergers. Merging can be considered as an effective, pragmatic solution to the companies for accessing to technologies and new markets. The result was a broader spectrum of IC design tools delivered to the market quickly. There were also substantial cost savings to both companies due to the elimination of duplicate development efforts. Another benefit of mergers is access to an expanded installed base of customers. This not only provides an opportunity for sales of existing products to a larger group of customers, but also provides a greater base for future product sales. In addition, consolidated companies can own a greater share of market, which gives them a substantial competitive advantage. SCS' acquisition of Caeco (Santa Clara, CA) illustrates this gain. Mergers and acquisitions also benefit companies wanting to reposition themselves in the market. By adding capabilities to their product offerings, companies can rapidly expand their market coverage and modify their market position. The stakes are high Successfully merging, consolidating or acquiring organizations takes thoughtful, time-consuming consideration, but the results are well worth the effort because the consequences of a failed merger, like those of a failed marriage, can be brutal. Valuable employees will leave, there will be confusion in the market about what the new company is doing, customers will be dissatisfied and, ultimately, the bottom line will be affected. The company is synchronized and employees are motivated. The organization has gone beyond merger issues and is looking forward to common goals. This isn't the time to become complacent, however, because there's still work to be done to ensure continued success (Hammock.2010:83)
3.2. Major Causes of Company Mergers
Companies have a reason to merge: the joining or merging of the two companies creates additional value which called as an "Syenergy" value. Synergy value can take three forms:
1. Revenues: By combining the two companies, we will realize higher revenues than if the two companies operate separately.
10
2. Expenses: By combining the two companies, we will realize lower expenses than if the two companies operate separately.
3. Cost of Capital: By combining the two companies, merger enjoy a lower overall cost of capital and production. Cost savings often come from the elimination of some services, such as human resources, accounting, information technology, etc
(Maat H. Evans,2000:2-3)
3.2.1 Tax Advantage
Tax benefits can accrue due to mergers and acquisition at both the corporate and the shareholder levels. This would be managed by the government policies.
3.2.1.1. Shareholder Taxation
When the shareholders sell their shares as part of a merger or acquisition, they would receive different types of management. Such payments would be taxable or nontaxable. If they are taxable, then the shareholders must pay capital gains taxes on their gain over basis. If they are not taxable, then shareholders need pay no taxes until they sell the shares in the acquiring company. This is a net gain to shareholders in comparison to the case before merger. In general, shareholders prefers to sell their shares in the new company.
3.2.1.2. Corporate Taxation
At the corporate level, the tax treatment depends on the choice of the acquiring firm to be absorbed into the parent with its tax attributes or first being liquidated and then received in the form of its component assets.
3.2.1.3. Tax Losses and Credits
A company incurs a tax loss in the current year would have two options: if it had sufficient taxable income in the three previous tax years to offset the current loss, it may carry the loss back to the earlier years and obtain an immediate refund. If it does not have enough recent income to do this for all of its current loss, it must carry the rest of the loss forward ( Alan J Auerbach,1987:71-75)
Turkish legislation also offers similar advantages to the mergers.
3.2.2. Globalisation Drivers
Increasing globalisation encourage mergers since the developments information technologies led to removal of the geographical separation between individual
11
companies both within the same countries and across international boundaries. In the U.K. several large high street banks have been successfully acquired by a major Australian bank (Alexader Roberts,2012:6). In Turkish banking industry, the increasing number of acquisition has been considered as an important as well as the other industries.
3.2.3. Capacity Reduction
In some cases it may be desirable for a company to merge with or acquire a competitor in order to secure a greater degree of control over total sector output. The company may offer opportunity to maintain more of its own production facilities and employees within the new company at the expense of company B (Alexader Roberts,2012:7)
3.2.4. Reduced Competition
Horizontal mergers reduce competition to prevent unwanted effects. One of effects of a reduction of competition is an increase in prices. Causing X-inefficiency in the firms is considered as another effect. Reduced competition may exercise reduced product diversity and innovation. Many of the managers may not be efficient on decision making due to their beliefs and prejudices and not on facts and reasoning ( Lars-Hendrik, 2006:18)
3.2.5. Psychological Causes
Managers at mergers and acquisition hope will solve problems such as improving department of the company, as well as its overall business. It is often thought that M&As might also convert the company’s image, especially when a new corporate name is chosen. M&As can be helpful in being a distraction from the real problems that the company experiences (Ulrich,2007:9)
3.3. Company Mergers in the World Economy
As mergers movement occurred, not only the economy grew considerably, but also significant developments emerged in the business environment. The first commercial mergers and acquisitions were experienced in the second half of the 1800s by railway companies in the USA. Four major merger waves took place in different periods until 1990s. Present days and 1990s are named as the fifth merger wave in which operation number, value of mergers and acquisitions reached very
12
large amounts with the effect of globalization, and there are cross- border mega-mergers (Sahin and Yılmaz, 2008:69).
Throughout historical developments of mergers in the world from the first wave of intensive number of mergers in 1800s until today, domestic and cross-border mergers in the USA have had an important role in terms of the operation number and monetary amount. In the EU and other developed countries, it was observed that mergers and acquisitions reached significant amounts after 1960s. A considerable increase in the number and monetary amounts of internal and external mergers and acquisitions has been recorded especially after the establishment of the EU. In developing countries, the number of mergers and acquisitions increased notably after 1980s when foreign investments in these countries increased. More than 10,000 mergers and acquisitions took place in the EU in 1998. The number of mergers and acquisitions increased to 12,800 in 1999. While the UK got the largest share in mergers and acquisitions in the Union, France, Germany and the Netherlands followed this country (Ilarslan and Asıkoglu, 2012:62).
After 1980s, cross-border mergers and acquisitions have gained more importance than domestic mergers as industrial structure has been reshaping at the international level in parallel with the rapid development of international economic integration. Particularly 1990s became a period of hundreds of cross-border mergers and acquisitions expressed with billion dollars. It can be said due to this feature of 1990s that the mergers after and before 1990s differ structurally (Gaughan, 2007:30).
The USA is seen at the forefront at the geographical distribution of the global mergers and acquisitions. According to data collected in 2013, 44% of total number of mergers and acquisitions took place in the USA
13
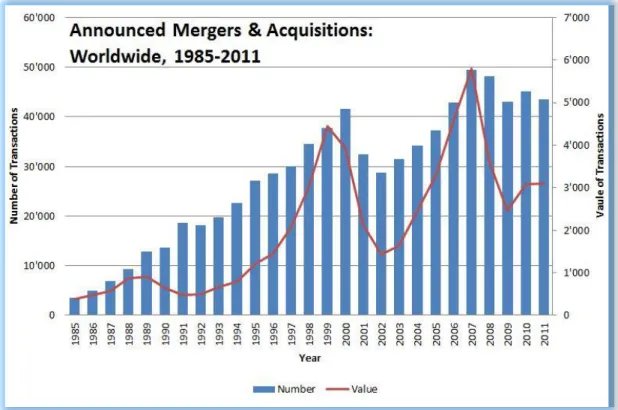
Figure 3.1: Statistical information of mergers that occured across the world between the years of 1985-2011 in terms of their number and value
The number of mergers across the world increases day by day. The chart above indicates the statistical data related to the mergers that occurred across the world between the years of 1985-2011 in terms of their number and value
First mergers were seen in the USA in 1980s. A certain population of mergers was observed until the early 1900s. When it is viewed in the context of the world economy, a remarkable number of merger activities were seen from the 1940s to the 1970s. By the 1970s, the increase in the number of mergers stopped with the control of mergers with antitrust laws (Mehra, 2013: 54).
The merger activities were seen in the United States earlier. Then, their number increased gradually in European countries. Thus, they have become widespread at the international level. Worldwide recognized companies have got into a partnership and created big companies. This has affected markets internationally and revealed the importance of the merger. The considerable numbers of company mergers were seen in Anglo-Saxon countries in 1980s but they have not been in great demand in countries like France, Germany and Japan. Social structure of these countries and differences in their economic systems have made it quite difficult for the companies to merge internationally. For example, the German Central Bank objected and prevented the partnership of Italian tire manufacturer Pirelli with German company
14
Continental. However, an increase in the number of mergers has been seen in Japan since 1988. In today's world, great advantages provided by the mergers has increased the number of merger activities. The merger and acquisition activities that took place during 2013 has increased by 20% compared to the year 2012. Transaction value reached US $ 2.4 trillion (Baltagi, 2013: 115-117).
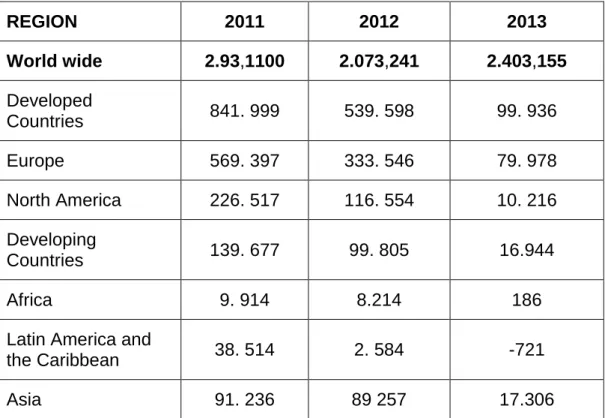
Table 3.1: Volume of Mergers Worldwide and Across Continents
REGION
2011
2012
2013
World wide
2.93,1100
2.073,241
2.403,155
Developed
Countries
841. 999
539. 598
99. 936
Europe
569. 397
333. 546
79. 978
North America
226. 517
116. 554
10. 216
Developing
Countries
139. 677
99. 805
16.944
Africa
9. 914
8.214
186
Latin America and
the Caribbean
38. 514
2. 584
-721
Asia
91. 236
89 257
17.306
Banking sector in the USA has experienced a continuous process of bank mergers with an annual average of 600 bank merger since the early 1980s. The biggest merger in US history is the merger of America Online (AOL) with the Cable-TV company Time Warner. US Federal Communications Commission (FCC) gave approval for the merger of AOL, the world's biggest internet service provider, with Time Warner, which valued at $ 160 billion. The big computer company Hewlett Packard offered $ 25 billion stock to acquire Compaq Computer. Two big computer companies are expected to merge so that they can survive the conditions that have been more difficult to overcome because of the decline in sales and price-cutting competition (Baker, 2013: 88).
The USA maintains its leadership position of mergers in the world. The financial value of the companies that merged in 2013 increased by 68% compared to 2012 and reached 984 billion dollars.
15
The number of merging companies in Europe increased by 45% in the first quarter of 2012 compared to previous years. The total value of mergers in Europe in over months was 341.42 billion. Besides, 3714 large and small companies merged in Europe, except for big companies. Analysts predict that the number of mergers in Europe will increase rapidly and these mergers will take place mostly in technology, telecommunications, pharmaceuticals and financial sector (Gupta, 2013: 62).
Today, great extent of mergers have been experienced in the United Kingdom. The biggest merger of Europe was the merger of British pharmaceutical company Glaxo-Wellcome with Smithkline Beechan, valued at 76 billion dollars. British company BP Amoco acquired the company American Atlantic Richfield in return for 27.6 billion dollars. The British company Vodafone took over American telecommunications company Airtouch in return for 56 billion (Halkos and Tzeremes, 2013: 24).
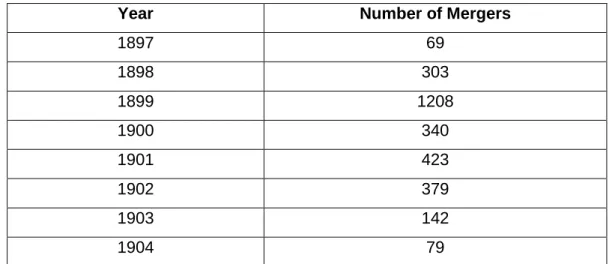
3.3.1. The First Merger Wave (1897-1904)
The first merger wave that occurred after the crisis in 1883. It raised between 1898 and 1902 and ended in 1904 (Gaugan 2007:6). The following table shows the number of mergers between 1897 and 1904:
Table 3.2: The Number of Merger between 1897 and 1904
Year Number of Mergers
1897 69 1898 303 1899 1208 1900 340 1901 423 1902 379 1903 142 1904 79
Raw metal, food products, petroleum products, chemicals, marine equipment, fabricated metal, machinery; coal industries experienced the greatest number of merger activities. Approximately two-thirds of total mergers in this period were concentrated in these industries (Gaughan, 2007:31). Some of today's industrial giants such as DuPont, Standard Oil, General Electric, Eastman Kodak, American Tobacco, and Navistar International (called International Harvester before 1986) appeared during the first merger wave. Horizontal mergers occurred extensively in this period (see Table 3).
16
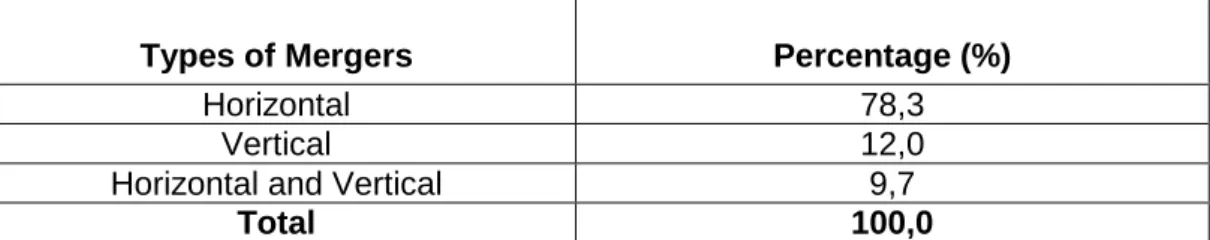
Table 3.3: Types of Mergers between 1895 and 1904
Types of Mergers Percentage (%)
Horizontal 78,3
Vertical 12,0
Horizontal and Vertical 9,7
Total 100,0
This merger movement caused major changes in economic infrastructure and production technology. Completion of the transcontinental railway system, the advent of electricity and increased use of coal took place in this period. Completed railway system enabled the development of national economic market. Thus, merger activities played a role in the transformation of regional firms operating in a particular area into the national companies (Aharon et al, 2010:462).
This period was mainly characterized as a period of mergers with the aim to reduce competition and create trust. Merged companies in the first wave aimed to become the monopoly power by eliminating competition, and thus dominate the market (Monoldorov, 2006:3). In the first wave, a significant level of concentration in the U.S. industry was seen. The number of some industries like steel industry significantly decreased. In fact, only one single company could survive in some sectors. Even the Sherman Antitrust Act introduced in 1890 could not stop intense activities in this period (Gaughan, 2007:32-33).
Financial factors were much more influential than legal restriction on the end of the first merger wave. The first factor was that the shipbuilding sector went bankrupt in the early 1900s due to financial problems. The second and most important factor was stock market collapse in 1904, and subsequently banking panic that caused the closure of many banks in 1907. These events led to the establishment of the Central American Banking System. As a result of downward trend in stock market and weak banking system, financial instruments supporting mergers disappeared. The first merger wave ended for these reasons (Gaughan, 2007:36).
3.3.2. The Second Merger Wave (1916-1929)
The second wave of mergers began after the World War 1. The antitrust environment was stricter during this period of merger waves. This led to an oligopolistic structure rather than a monopolistic structure. Horizontal and vertical mergers were dominated in this period. The American economy continued to change and evolve during this second wave. Many famous companies that have
17
been still operating such as General Motors, IBM, and John Deerev were formed during this period (Gaughan, 2007:36).
4,600 mergers took place between 1926 and 1930. On the other hand, 12,000 companies were shut down over 11 years, from 1919 to 1930. Most of mergers in this period occurred in base metals, petroleum products, food products, chemicals and logistics equipment industries.
Investment banks mediated in merger activities both during the first and second merger waves. When mergers contradicted with the policy of investment banks, they were vetoed by banks. Investment banks had a large proportion of capital needed by mergers and acquisitions. These banks pursue a policy against competitive environment (Gaughan, 2007:36).
The second merger wave came to the end with "Black Thursday" on October 29, 1929. The "Black Thursday" had been the most significant decline in the stock market until October of 1987. The number of mergers reduced remarkably after the decline. Companies were not like to grow anymore. They only want to pay their debt and protect liquidity ratios (Gaughan, 2007:39).
3.3.3. The Third Merger Wave (1965-1969)
The third wave was a period of significant mergers and acquisitions movements with the support of rapidly growing economy. The number of mergers reached its peak during the three years period, between 1967 and 1969 (Weston, Mitchell and Mulherin, 2004:203). The distinctive feature of this period is that small and medium-sized companies became a target of small companies, whereas small companies had been incorporated into large companies in previous mergers.
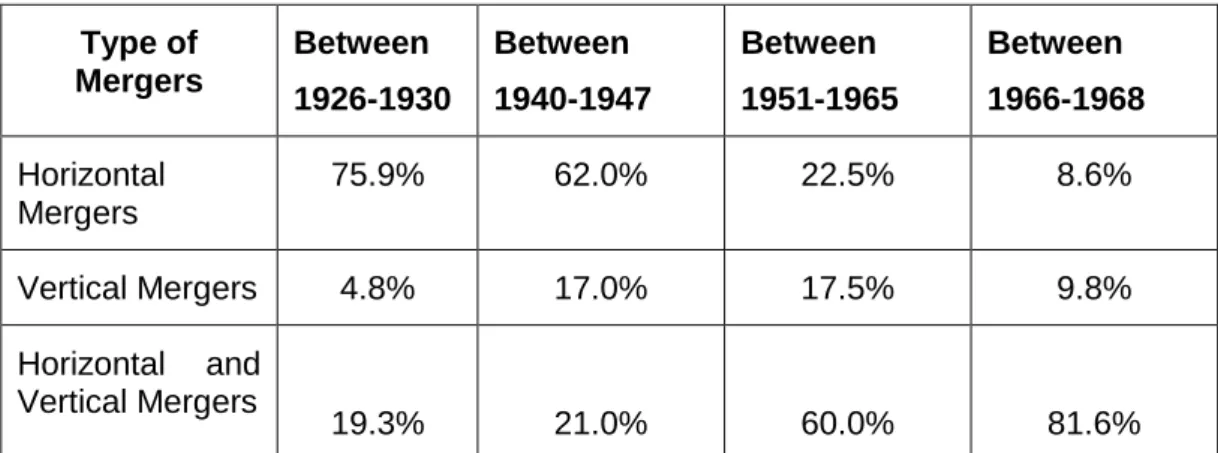
Celler-Kefauver agreement became a new regulation in addition to the antitrust laws of 1950s and 1960s during this period. Thus, horizontal and vertical mergers lost importance gradually. Mixed mergers resulting from diversifying activities of companies appeared. As can be seen in Table 4, these mergers left their marks on this period. While the proportion of mergers for product extension was 60% of overall number of mixed mergers, the portion of market extension was insignificant. On the other hand, pure mixed mergers had a share of around 23% (Kruse, 2007:162).
18
Table 3.4: Distribution of the Number of Mergers between 1926 and 1968
Type of Mergers Between 1926-1930 Between 1940-1947 Between 1951-1965 Between 1966-1968 Horizontal Mergers 75.9% 62.0% 22.5% 8.6% Vertical Mergers 4.8% 17.0% 17.5% 9.8% Horizontal and Vertical Mergers 19.3% 21.0% 60.0% 81.6%
Intense antitrust practices in the early 1960s were broken after Richard M. Nixon was elected by the late 1960s. The reason for this was that four judges appointed to Supreme Court by Nixon supported Nixon's opinion advocating a freer market structure. The Supreme Court adopted a vision of large, international market instead of a narrower and even regional definition of market (Gaughan, 2007:42).
3.3.4. The Fourth Merger Wave (1981-1989)
The downward trend in mergers and acquisitions from 1970s until 1980 was reversed in 1981. Increased foreign competition, rapid technological advances and high cost of R&D activities were the factors that increased the number of mergers during this period. The role of hostile takeovers was one of the determining factors that distinguish this wave from other three waves. The portion of hostile takeovers in total value of acquisitions is high (Gaughan, 2007:46).
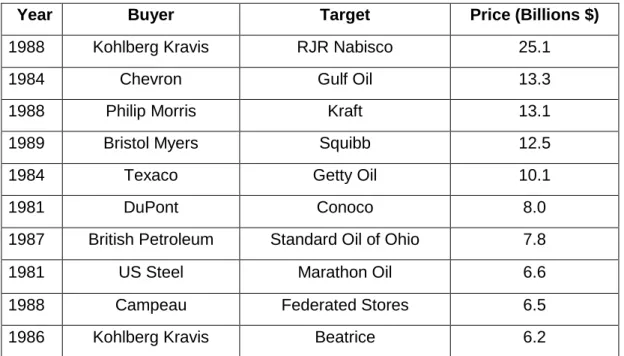
Another distinctive feature and determinant of this wave was the size of mergers and the size of target companies chosen to merge with. Some of the biggest companies became target of acquisitions during 1980s (Alexandridis, 2010:1676). Therefore, this period is called the era of mega-mergers. The total dollar value paid on acquisitions rose during this decade. The average size of mergers also increased significantly. Unlike 1960s, 1980s became a period of multi-billion dollar mergers and acquisitions. Leading mega mergers in the fourth wave are shown in Table 5 (Gaughan, 2007:56).
19
Table 3.5: Ten Important Acquisitions between 1981 and 1989
The number of mergers and acquisitions was more in certain industries. For example, the oil industry experienced more merger actions. 21.6% of mergers and acquisitions experienced between 1981 and 1985 took place in the oil and gas industries. In addition to these, most of mergers and acquisitions were seen in service industries like banks, finance, insurance and health care service (Kovacich and Halibozek, 2003:22).
3.3.5. The Fifth Merger Wave (1992-2002)
The recession emerged in the U.S. economy by the end of 1980s caused reduction in the number of mergers and acquisitions. However, it began to increase again in 1992. The merger wave has still been experienced since it started again in 1990s. It is the last wave (Brealey and Stewart, 2008:289)
The number of mergers that had been observed commonly in the USA started to rise in the Europe and Japan during the second half of 1990s (see Table 6).
Year Buyer Target Price (Billions $)
1988 Kohlberg Kravis RJR Nabisco 25.1
1984 Chevron Gulf Oil 13.3
1988 Philip Morris Kraft 13.1
1989 Bristol Myers Squibb 12.5
1984 Texaco Getty Oil 10.1
1981 DuPont Conoco 8.0
1987 British Petroleum Standard Oil of Ohio 7.8
1981 US Steel Marathon Oil 6.6
1988 Campeau Federated Stores 6.5
20
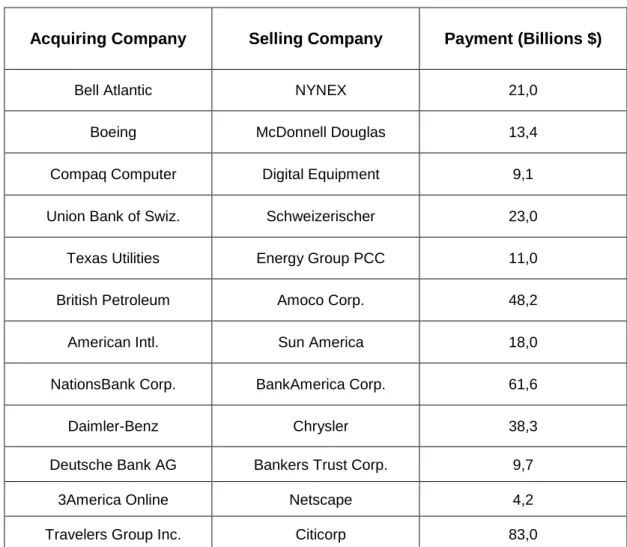
Table 3.6:Some Significant Mergers between 1997 and 1998
The number of mergers and acquisitions reached a peak in 2000 before dropping rapidly because of global crisis and recession in 2001. The value of activities that decreased by 29% of that in the previous year in 2002 remained at 1, 2 trillion U.S. dollars. The number of such activities in the world reached a plateau at 25,000, which is the lowest number that has been experienced since 1995. The downward trend in the world that started in 2002 continued in 2003. However, the figure of the number of mergers and acquisitions that showed a decrease between 2001 and 2003 turned into an upward trend in 2004. There was an increaseby 30% of the numbers in 2005. The worldwide revenue gained from 6,134 mergers in 2005 was 716 billion U.S. dollars.
Acquiring Company Selling Company Payment (Billions $)
Bell Atlantic NYNEX 21,0
Boeing McDonnell Douglas 13,4
Compaq Computer Digital Equipment 9,1 Union Bank of Swiz. Schweizerischer 23,0
Texas Utilities Energy Group PCC 11,0
British Petroleum Amoco Corp. 48,2
American Intl. Sun America 18,0
NationsBank Corp. BankAmerica Corp. 61,6
Daimler-Benz Chrysler 38,3
Deutsche Bank AG Bankers Trust Corp. 9,7
3America Online Netscape 4,2
21 3.3.6. The Sixth Merger Wave (2003 and later)
The 2003 and the years after 2003 is considered as the beginning of the sixth merger wave based on the statistics showing international mergers and acquisitions.
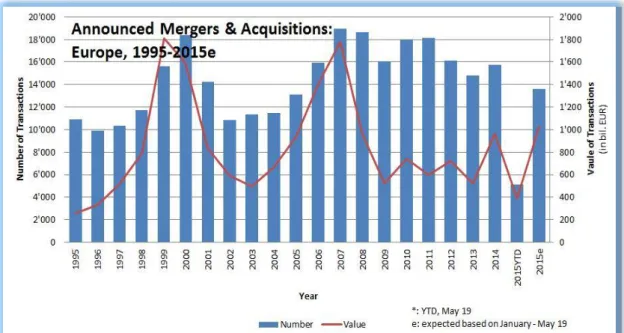
Figure 3.2: Announced Mergers and Acquisitions: Europe, 1995-2015
After a steep decrease in the number of mergers and acquisitions in 2001, mergers and acquisitions gained importance again in 2003, and subsequently 2004. An increase by 30% of the numbers in 2004 occurred in 2005. Revenue of 716 billion dollar was generated from 6,134 mergers in 2005. The number of mergers rose to 1, 6 trillion U.S. dollars in 2007. In 2008, the mergers and acquisitions were affected in a negative way by the international financial crisis. In 2008, the number of merger and acquisition activities decreased by 35% compared to those in the previous year, and created the lowest global trading volume since 2005 (Alexandridis, 2010:1678). 9,995 agreements of mergers and acquisitions were recorded in 2009. The total value of these agreements was 899, 5 billion U.S. dollars.
22 3.4. Benchmarking of Big World BankMergers
Brand evaluation organizations operating in 20 countries, including Turkey Brand Finance and The Banker magazine published six years in collaboration with the "World's Most Valuable Bank Brands" .
Leaving behind all US banks Wells Fargo, with a brand value of $ 26 billion, while the world's most valuable brand, managed to enter the top 500 in 10 Turkish Bank According to information gathered from the research question, a total of 10 Turkish banks Akbank and especially Business Bank, the world's most valuable banking brand among the first 500 entries.
According to the survey, the US Wells Fargo, one of the world's most valuable bank of 26 billion 44 million 500 most valuable banking brand with a brand value has obtained the title.
Wells Fargo was followed in the list again CHASE USA. Chase's brand value is determined as 23.4 billion US dollars, British HSBC took third place on the list with 22.9 billion dollars in value. According to the survey, Bank of America fourth with a brand value of $ 22.4 billion, while the value of $ 21.7 billion Citi was the fifth most valuable bank in the world.According to the results, four of the world's most valuable first 5 banks was increased from US.
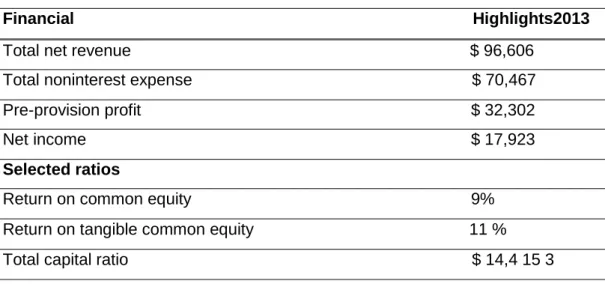
3.4.1. Chase Bank
CHASE most successful examples of the bank mergers. This bank board from September 1, 1799 to 1955, it was called The Bank of The Manhattan Company (New York); after a 1955 merger with the Chase National Bank (which existed separately from 1877 to 1954) it was called The Chase Manhattan Bank (Milliyet,2013). Successful devolepment of CHASE bank can be seen from table 8
23
Table 3.7: Financial highlights of Chase bank 2013
Financial Highlights2013 Total net revenue $ 96,606
Total noninterest expense $ 70,467 Pre-provision profit $ 32,302 Net income $ 17,923 Selected ratios
Return on common equity 9% Return on tangible common equity 11 % Total capital ratio $ 14,4 15 3 3.4.2. Santander Bank
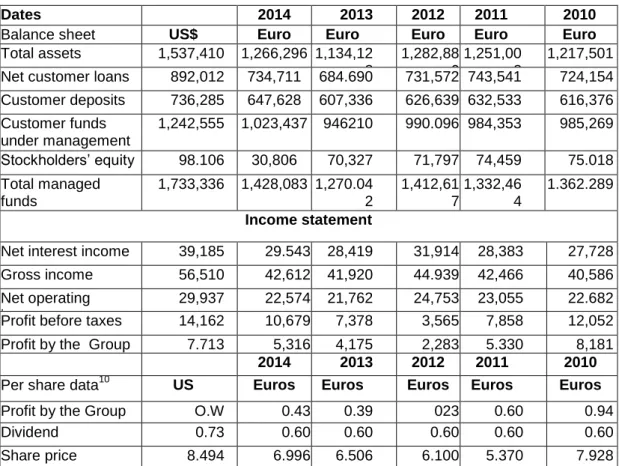
The Santander Group is a Spanish banking group centered on Banco Santander, S.A. and is the largest bank in the Eurozone by market value. It is one of the largest banks in the world in terms of market capitalization. As its name suggests, the company originated in Santander, Cantabria, Spain.
The group has expanded in recent years through a number of acquisitions, with operations across Europe, Latin America, North America and Asia. Many subsidiaries, such as Abbey National, have been rebranded under the Santander name.
Banco Santander was founded in 1857. In 1999 it merged with Banco Central Hispano, which had in turn been formed through the 1991 merger of Banco Central and Banco Hispanoamericano. The combined bank, known as Banco Santander Central Hispano, or BSCH, was designed to be a "merger of equals", in which the top executives of the two pre-existing firms would share control of the merged entity.
24
Table 3.8: Income of Santander Bank between 2010-2014/ Million
Dates 2014 2013 2012 2011 2010
Balance sheet US$ Euro Euro Euro Euro Euro Total assets 1,537,410 1,266,296 1,134,12 8 1,282,88 0 1,251,00 8 1,217,501 Net customer loans 892,012 734,711 684.690 731,572 743,541 724,154 Customer deposits 736,285 647,628 607,336 626,639 632,533 616,376 Customer funds under management 1,242,555 1,023,437 946210 990.096 984,353 985,269 Stockholders’ equity 98.106 30,806 70,327 71,797 74,459 75.018 Total managed funds 1,733,336 1,428,083 1,270.04 2 1,412,61 7 1,332,46 4 1.362.289 Income statement
Net interest income 39,185 29.543 28,419 31,914 28,383 27,728 Gross income 56,510 42,612 41,920 44.939 42,466 40,586 Net operating
income
29,937 22,574 21,762 24,753 23,055 22.682 Profit before taxes 14,162 10,679 7,378 3,565 7,858 12,052 Profit by the Group 7.713 5,316 4,175 2,283 5.330 8,181
2014 2013 2012 2011 2010
Per share data10 US Euros Euros Euros Euros Euros Profit by the Group O.W 0.43 0.39 023 0.60 0.94
Dividend 0.73 0.60 0.60 0.60 0.60 0.60
Share price 8.494 6.996 6.506 6.100 5.370 7.928 According to examples and numbers, that World company mergers have deep and strong structure and success because of long experience. World company mergers generally use merging for growing and expanding round the World. Turkey company mergers are new in compare with World but they have big success in short time.For the first time Turkey mergers were with domestic companies for economy power but nowadays this process changed to foreign mergers.Certainly this is very beneficial for companies and Turkey economy.
First, this merger improved cost efficiency, reduced costs per unit of output for a given set of output quantities and input prices. Second, mergers may increase profits superior combinations of inputs and outputs through improvements in profit efficiency. Third, mergers may improve profits through the exercise of additional market power in setting prices. An increase in market concentration or market share may allow the consolidated firm to charge higher rates for the goods or services it produces, raising profits by extracting more surplus from consumers, without any improvement in efficiency.
25 3.5. Company Mergers in Turkey
The first major merger activity in Turkey was the merger of the Austria Ottoman Bank with French-capitalized Bank-ı Osman-ı Sahane in 1874. The first merger of republican period was the merger of the Turkish Commercial Bank with Uskudar Bank in 1933 (Schiffbauer, 2009:47). However, mergers in Turkey have been developing since 1950s. It is seen that most of the mergers in this period was performed in order to let firms having financial problems, especially banks of the hook. For example, the Bank Tumsu merged with the Old Turkish Warriors Bank. It was named as the United Savings and Credit Bank of Turkey in 1959 for this purpose. Other examples are the merger of the Tourism Bank of Turkey with the Tourism Bank of Turkish Republic in 1960 and the merger of the Bank Istanbul with the Real Estate Credit Bank in 1962. While there was an increase in the number of conglomerations between 1965 and 1975, the years between 1975 and 1980 became an off-peak period for companies as the inflation rates increased and economic stability came to the forefront (Geppert and Kamershen, 2008:335). "Liberal economic policies" implemented after 1980 affected companies significantly. The high interest policy led companies to work more efficiently. Companies that did not work efficiently either winded up or looked for ways to merge with other companies. The stability program led to improving industrialization. However, lack of demand resulted in excess capacity. The mergers became inevitable so that these capacities could be effective (Surroca, Tribo and Waddock, 2010:468).
It can be seen that the number of mergers and acquisitions increased after 1980 with some aims such as to save banks with problems, to create an economy by combine companies with the same function in the same group under a single roof, to transfer or wind up some companies with the aim of narrowing the scope, to recover loss-making companies from loss by transferring, to benefit from tax savings by taking over a loss-making company (Demir and Bahadır, 2009:33). Olmuk Cardboard Industry and Trade Inc. owned by Transtürk Holding were purchased by Sabancı Holding in the middle of 1982, and it has continued to operate as Olmuk Cardboard Industry and Trade Inc... This can be mentioned as an example of merging of companies with difficulties. An example of the merger of loss-making company with a profitable company can be the merger of Pemko Profilo Electric Motor and Compressor Industries Inc. with Peg Profilo Electric Appliances Industry Inc. that was operating under the same holding. There are also mergers made for different purposes other in addition to those listed here. For instance, Aegean
26
Industry Inc. engaging in manufacturing in the auto ancillary industry merged with Karteks engaging in manufacturing in the packaging industry in order to diversify for hedging. Sabancı Holding acquired Company Henfty so as to enter Swiss market (Aharon et al, 2010:462).
Mergers could not become widespread in Turkish economy, even could not be used as a reorganization method to deal with economic shocks until the beginning of 1990s. Rare acquisitions in this period can be defined as takeover of insolvent companies by creditor banks.
From the beginning of 1990s, Turkish companies began to merge with foreign companies for some purposes like to take advantage of technological developments and to take place in the EU single market. As a leading example of these mergers can be Lassa, Bridgestone. In 1988, Lassa began to look for a partner since it wanted to get rid of excessive costs of research and development activities. One of the companies considered as partner, Continental was not preferred because of the low market share and inadequate production technology. Michael rejected the 49% share offer that was Sabancı Group's general policy. Bridgestone firstly entered the American market, and considered Turkey to enter. In addition, Turkey is close to Africa and the Arabian Peninsula. Thus, all assets operating under the name of Lassa were transferred to Brise. Thus, Lassa remained only as tire brand. Lassa's production capacity increased from 50 thousand tons to 140 thousand tons as a result of this merger. Sales volume doubled during two years after the merger in 1988. Moreover, the company achieved a steady growth. Furthermore, the merger of the Italian Lamborghini with Anatolian Group can be given as another example. Lamborghini decided not to produce small engines, and withdraw from some manufacturing activities. The Anatolian Group started to produce these engines in Turkey. Besides, Cignasa established as a consolidation by Atlantic Insurance and American Company Cigna, BNP Ak DresdnerBank established as a joint venture by Akbank, French Banque National De Paris and German Dresdner Bank and Aegean Fren established by Aegean Industry and American Company Rockwell can be shown as examples (Surroca, Tribo and Waddock, 2010:472; Kılıç, 2009, s.103). Media was another industry that witnessed considerable number of mergers in Turkey during 1990s. It can be seen that both of these two sectors were used as a power both against competitors and legislative and executive branches when the social, economic and political position of the country is considered. The major media mergers in this period are as follows: Newspaper Milliyet (Karacan-Doğan
Holding-27
K. Yiğit-Doğan Holding), Newspaper Hürriyet (S. Simavi-E. Aksoy-Doğan Holding), Newspaper Akşam (M.A. Ilıcak-Cukurova Holding), NTV (Nergiz Holding- Doğuş Holding), Show TV (E. Aksoy-Cukurova Holding), Channel E (Doğuş Holding), Kanal D (Doğan Holding), TGRT and Newspaper Türkiye (Ihlas Holding). (Içke, 2007:20-22).
In addition to banks and media, another industry that was faced with several mergers is retailing. The mergers in this period are as follows: Doğuş Holding (Tansaş and Makro), Finba (Gima, Marks and Spencer), and Sabancı (Carrefoure), Doğan Holding with Turkish Business Bank (Poaş).
3.5.1. Mergers in Turkey in 2002
According to Mergers and Acquisitions report published in 2002 by Ernst & Young Corporate Finance Consulting Inc., the total number of mergers and acquisitions in Turkey was 54 in 2002, and the transaction value was declared for only 34 of them. The total declared value of mergers and acquisitions was 613,7 million U.S. dollars. When forecasts related to value of transactions that were not declared, it can be concluded that trading volume can be around 1 billion U.S. dollars (Serçe, 2009:138).
In the report, it was stated that 60% of the total transaction value came from the transactions in which Turkish firms were acquiring companies. As can be seen in Table 10, England with a transaction value of 101,1 million dollars took the second place after Turkey, and the USA followed England with a transaction value of 85 million dollars. The reason why the number of transactions among Turkish companies in the report was high is attributed to the need for more consolidations in many sectors (Serçe, 2009:139).