Ankara University
Institute of Nuclear Sciences
Owner on behalf of Institute of Nuclear Sciences,
Ankara University,
Director
Niyazi MERİÇ, Ph.D.
http://jns.ankara.edu.tr
Editor-in-Chief
Haluk YÜCEL, Ph.D.
Assistant Editor-in-Chief
George S. POLYMERIS, Ph.D.
Editorial Board
Birol ENGİN, Ph.D.
Erkan İBİŞ, M.D.
Gaye Ö. ÇAKAL, Ph.D.
Güneş TANIR, Ph.D.
Hamit HANCI, M.D.
Ioannis LIRITZIS, Ph.D.
İsmail BOZTOSUN, Ph.D.
M.Salem BADAWI, Ph.D.
Mustafa KARADAĞ, Ph.D.
Niyazi MERİÇ, Ph.D.
Osman YILMAZ, Ph.D.
Özlem BİRGÜL, Ph.D.
Özlem KÜÇÜK, M.D.
Slobodan JOVANOVIC, Ph.D.
Turan OLĞAR, Ph.D.
Volume 2, No. 2
May 2015
ISSN: 2148-3981
Journal of Nuclear Sciences
*Corresponding author.
E-mail address: [email protected] (N. Kalaycıoğlu Özpozan)
Hosted by Ankara University
Journal of Nuclear Sciences
ISSN: 2147-7736
Jo u r nal h o m e p age: h t t p : / / j n s . a n k a r a . e d u . t r / DOI: 10.1501/nuclear_0000000011
Synthesis and characterization of new phosphor based MTiO
3N. Kayacı
1, S. Dayan
1, A. K. Küçük
1, N. Kalaycıoğlu Özpozan
*1,
E. Öztürk
2, E. Karacaoğlu
21Department of Chemistry, Faculty of Science, Erciyes University, 38039 Kayseri, Turkey
2Materials Science and Engineering, Faculty of Engineering, Karamaoğlu Mehmetbey University, 70200, Karaman, Turkey
Received 13.11.2014; accepted 02.04.2015
ABSTRACT
In this study, new titanate phosphors were synthesized. The Dy3+, Eu3+, Ho3+ rare-earth ions were used as dopants
to CaTiO3, SrTiO3, and BaTiO3 host crystals. The optimization of reaction conditions were carried out by
thermogravimetry (TG) and differential thermal analysis (DTA) methods. The mixtures to achieve a solid state reaction were heated in porcelain crucibles for preheating process at 600 oC and 800 oC and final heating process
at 1000 oC for 16 hours in the open atmosphere. The reaction products were characterized by X-ray powder
diffractions (XRD). Surface investigations and elemental analysis were determined by using SEM-EDX instrument.
Photoluminescence spectrophotometer (PL) was used for the observation of the excitation and emission spectra.
Keywords: Perovskite, Luminescence, Phosphors, Solid state synthesis techniques, XRD 1. Introduction
Over the last several decades, a formula of perovskites, ABO3 has attracted broad interest due to
their piezoelectricity, ferroelectricity, colossal magneto resistivity, and photoluminescence [1–4]. Perovskite and ilmenite oxides which are the structure of ABO3, represent a prominent of
advanced compounds involved in many areas of science and technology [5–7]. Several titanates are also known to be promising host matrices. The PL investigations of barium titanate have been extensively discussed by Moreira et al [8]. In addition, the PL of several other titanate systems such as gadolinium titanate, zirconium titanate, strontium titanate, lead titanate and calcium titanate, and magnesium titanate are available in the literature [9–12]. The interest in the PL of these titanate based systems is due to the fact that the TiO2 group in these
matrices has a relatively wide band gap and high refractive index, which results in intense luminescence; for this reason, these titanate-based compounds can find potential applications in optoelectronic devices [13]. Moreover, the TiO2
structure itself possesses good mechanical strength and thus can withstand corrosive environments. The chromaticity of these titanate systems can be controlled to a large extent by suitable doping with a 3d or 4f system and by controlling the various synthesis parameters [14].
In this study, CaTiO3, CaTiO3: Eu3+ (1% mol), Dy3+
(1% mol), SrTiO3, SrTiO3: Eu3+ (1% mol), Dy3+
(1% mol), SrTiO3: Ho3+ (1% mol), Dy3+ (1% mol),
BaTiO3, BaTiO3: Dy3+ (1% mol), Ho3+ (1% mol),
BaTiO3: Dy3+ (1% mol), Eu3+ (1% mol) were
synthesized by solid-state reaction. Their thermal behaviors, crystal structures, photoluminescence properties and structural features were investigated.
2. Experimental
Rare-earth ions containing calcium titanate, strontium titanate and barium titanate were prepared by heating a mixture with a ratio of 1 mol of calcium nitrate (Ca(NO3)2) (A.R.) or strontium nitrate
(Sr(NO3)2) (A.R.) or barium nitrate Ba(NO3)2, 1 mol
of tetra-n-butyl titanate (Ti(OC4H9)4) (A.R.) and
0.01 mol of rare-earth nitrate of 99.99 % purity in an air atmosphere. During the grinding process with agate mortar (about 2 hours), the pasty mixtures became powder form due to alcohol moving away from Ti(OC4H9)4.
Firstly, TG/DTA system (Perkin Elmer Diamond, USA) was used to determine the reaction conditions in the temperature range 50–1200 ◦C under an inert N2 atmosphere with a heating rate 10 ◦C/min.
After TG/DTA analysis, according to thermal analysis data, the mixtures were pre-heated in controlled oven at 600 oC for 2 h and 800 oC for 2 h
for 16 h. After heating procedure, CaTiO3: RE (RE=
Eu3+/Dy3+), SrTiO
3:RE (RE=Eu3+/Dy3+ and
Ho3+/Dy3+) and BaTiO
3:RE (RE=Dy3+/Ho3+ and
Dy3+/Eu3+) were synthesized by solid state reaction.
Structural characterization was analyzed by X-ray diffraction (XRD; Bruker AXS D8) spectra with CuKα line of 1.5406 Å. Scanning electron microscopy (SEM) images and EDX analysis were taken with a LEO 440 model scanning electron microscope using an accelerating voltage of 20 kV. Excitation and emission spectra of the phosphors were investigated by Varian Cary Eclipse luminescence spectrophotometer with xenon lamp and a Perkin Elmer LS 45 model luminescence spectrophotometer with xenon lamp.
3. Results and Discussion
3.1 Characterization of samples
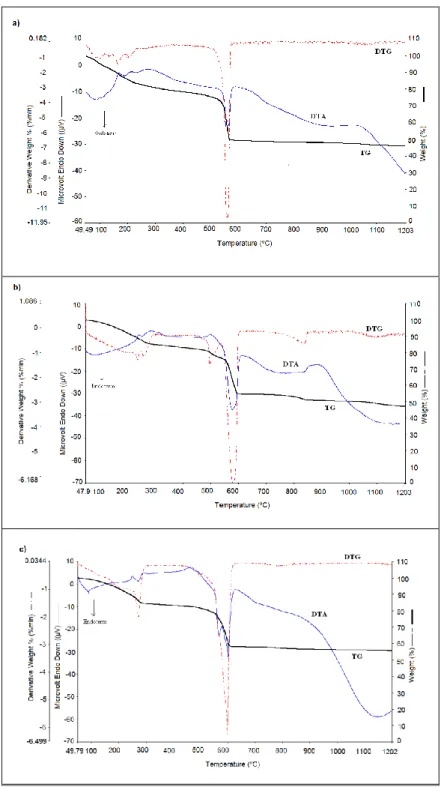
Thermal behaviors of mixtures were analyzed using TG/DTG/DTA system. The TG/DTG/DTA results for the samples are shown in Fig. 1.
The Ca(NO3)2-Ti(OC4H9)x mixture gives
3 endothermic peaks between 50 oC and 480 oC. The
peak which indicated a mass loss in the ratio of 22% in TG corresponds to butyl alcohol separated from the medium. The main weight loss of 23% observed at 560 oC indicates decomposition of Ca(NO
3)2
which is transformed into CaO. The weight loss of the mixture continues until 560 oC to 1200 oC.
The Sr(NO3)2-Ti(OC4H9)x mixture gives two
endothermic peaks between 50 oC and 490 oC. The
peak which indicated a mass loss in the ratio of 24% in TG corresponds to butyl alcohol separated from the medium. The main weight loss of 23% observed at 598 oC indicates decomposition of Ca(NO
3)2
which is transformed into SrO.
The Ba(NO3)2-Ti(OC4H9)x mixture gives one
endothermic peak between 50 oC and 500 oC. The
peak which indicated a mass loss in the ratio of 22% in TG corresponds to butyl alcohol separated from the medium. The main weight loss of 20% observed at 597 oC indicates decomposition of Ca(NO
3)2
which is transformed into SrO. 2% weight loss was observed after 600 degrees of the resulting peak, corresponding to the sublimation material.
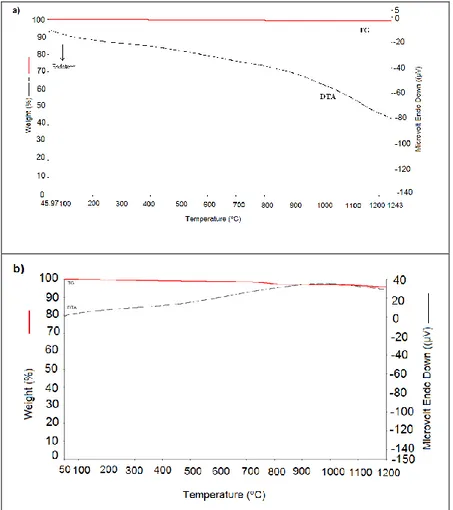
The TG/DTA curves of CaTiO3 and CaTiO3: Eu3+
(1% mol), Dy3+ (1% mol) synthesized at 1000 oC
are shown in Fig.2. Ca(NO3)2 has lost 4% mass at 47-
1240 oC. According to DTA, any phase change was
not identified at the temperature range 47 -1240 oC.
The TG/DTA curves of SrTiO3, SrTiO3: Eu3+(1%
mol), Dy3+ (1% mol) and SrTiO
3: Ho3+ (1% mol),
Dy3+ (1% mol) synthesized at 1000 oC are shown
in Fig. 3. Any losing mass or phase change was not determined at the temperature range 48 oC - 1243 oC.
The TG/DTA curves of BaTiO3, BaTiO3: Dy3+ (1%
mol), Ho3+ (1% mol) and BaTiO
3: Dy3+ (1% mol),
Eu3+ (1% mol) synthesized at 1000 oC are shown in
Fig. 4. The samples did not lose mass and the phase change was not identified at the temperature range 40 oC - 1450 oC.
3.2 Phase formation analysis
The CaTiO3 and CaTiO3: Eu3+ (1% mol), Dy3+
(1% mol) were applied pre-heat treatment at 600 oC
for 2 h and at 800 oC and then solid state reaction was
performed at 1000 oC for 16 h. At the end of heat
treatment, samples’ color changed to white color. XRD patterns of CaTiO3 and CaTiO3: Eu3+(1% mol),
Dy3+(1%mol) calcined at 1000 ◦C are shown in Fig.5.
The crystal systems of samples were indexed in an orthorhombic crystal system. Unit cell parameters of samples are listed in Table 1 and powder XRD pattern data of CaTiO3 and CaTiO3: Eu3+ (1% mol),
Dy3+ (1% mol) are listed in Table 2, and Table 3 .
These values show very good agreement with reference value of CaTiO3. CaTiO3 has an
orthorhombic crystal system with a = 763.9 pm, b = 544.0 pm, c = 538.0 pm; V= 224x106 pm3 [15].
For the SrTiO3, SrTiO3: Eu3+ (1% mol), Dy3+ (1%
mol), SrTiO3: Ho3+(1% mol), Dy3+(1% mol) and
BaTiO3: Dy3+ (1% mol), Ho3+(1% mol), BaTiO3:
Dy3+ (1% mol) , Eu3+ (1% mol) , pre-heat treatment
at 600 oC and 800 oC for 2 h was applied. Then solid
state reaction was performed at 1000 oC for 16 h. At
the end of heat treatment, samples’ color changed to white color. XRD patterns of SrTiO3, SrTiO3: Eu3+
(1% mol), Dy3+ (1% mol), SrTiO
3: Ho3+ (1% mol),
Dy3+ (1% mol) are shown in Fig. 6. Cubic unit cell
parameters of samples are listed in Table 5 and powder XRD pattern data of SrTiO3 , SrTiO3: Eu3+
(1% mol), Dy3+ (1% mol) and SrTiO
3: Ho3+ (1%
mol), Dy3+ (1% mol) are listed in Table 5-7
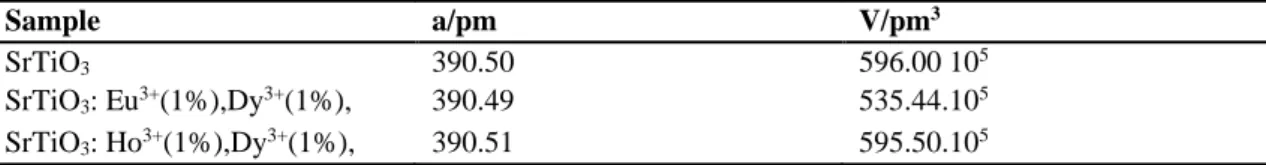
respectively. These values show good agreement with reference value of SrTiO3. SrTiO3 has a cubic
crystal system with a = 390.50 pm; V= 596x105 pm3
[16]. XRD patterns of BaTiO3: Dy3+ (1% mol),
Ho3+(1% mol), BaTiO
3:Dy3+(1% mol), Eu3+(1%
mol) are shown in Fig. 7. Tetragonal unit cell parameters of samples are listed in Table 8 and powder XRD pattern data of BaTiO3, BaTiO3: Dy3+
(1% mol), Ho3+ (1% mol) and BaTiO
3 Dy3+ (1%
mol), Eu3+ (1% mol) are listed in Tables 9-11
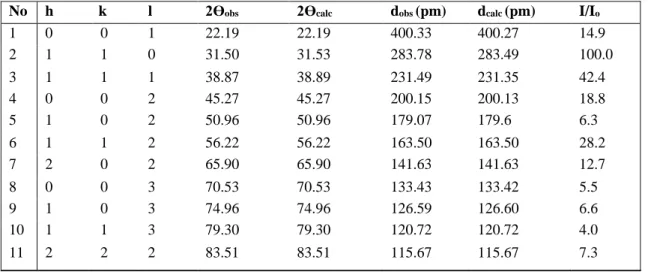
respectively. These values show good agreement with reference value of BaTiO3. BaTiO3 has a
tetragonal crystal system with a = 399.4 pm, c = 403.3 pm; V= 643x105 pm3 [8].
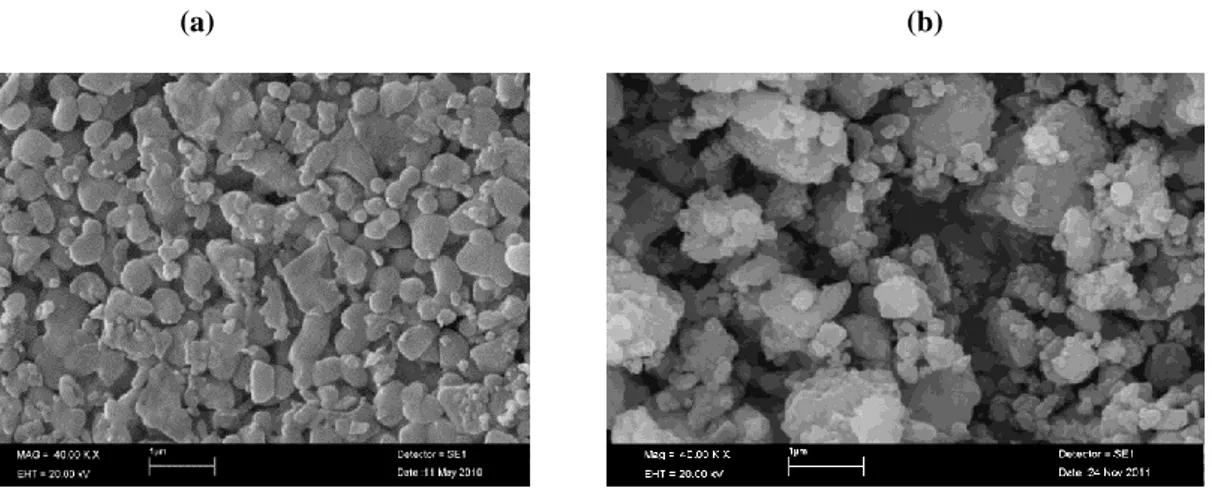
Heat treatment at 1000 oC was applied to CaTiO 3 and
CaTiO3: Eu3+(1% mol), Dy3+(1% mol) were applied
before SEM analyses were performed. SEM images of CaTiO3 and CaTiO3:Eu3+(1% mol), Dy3+(1% mol)
are shown in Fig. 8.
SEM images of SrTiO3, SrTiO3: Eu3+(1% mol), Dy3+
(1% mol) and SrTiO3: Ho3+ (1% mol), Dy3+ (1%mol)
Kayacı et. al/ Journal of Nuclear Sciences Vol 2 (2) (2015) 31-47
Fig.1. TG/DTG/DTA curves of a) Ca(NO3)2-Ti(OC4H9)x mixture, b) Sr(NO3)2-Ti(OC4H9)x mixture and
c) Ba(NO3)2-Ti(OC4H9)x mixture
SEM images of BaTiO3, BaTiO3: Dy3+ (1% mol),
Ho3+ (1% mol) and SrTiO
3: Dy3+ (1% mol), Eu3+
(1% mol) are shown in Fig. 10.
Fig. 11, 12 and 13 show the images and EDX analysis obtained from the SEM measurements of the phosphors calcined at 1000 oC for 2 h by using
solid state reactions. The microstructures of the phosphor consisted of regular fine grains with an average size of about150-300 nm. The EDX analysis of the chemical composition of the samples confirms the results of the experimental evidence. EDX analysis results of phosphors are listed in Table 12.
3.3 Luminescence properties
After heated at 1000 oC, excitation and emission
luminescence spectra of CaTiO3 doped withEu3+(1%
mol), Dy3+(1% mol) is shown in Fig. 14. The sample
is excited at 219 nm and 395 nm. Fewer than 218 and 395 nm excitation wavelength, CaTiO3 doped with
Eu3+ (1% mol), Dy3+ (1% mol) have an emission
band at 590 nm. The emission band belongs to
5D
0 → 7F1 transition of Eu3+ ions. Additionally, the
sample has yellow color under UV lamp excitation with 366 nm.
Fig. 2. TG/DTA thermograms of a) CaTiO3 b) CaTiO3: Eu3+(1% mol), Dy3+(1% mol) samples
Kayacı et. al/ Journal of Nuclear Sciences Vol 2 (2) (2015) 31-47
Fig. 4. TG/DTA thermograms of a) BaTiO3 b) BaTiO3: Dy3+(1% mol), Ho3+(1% mol) samples
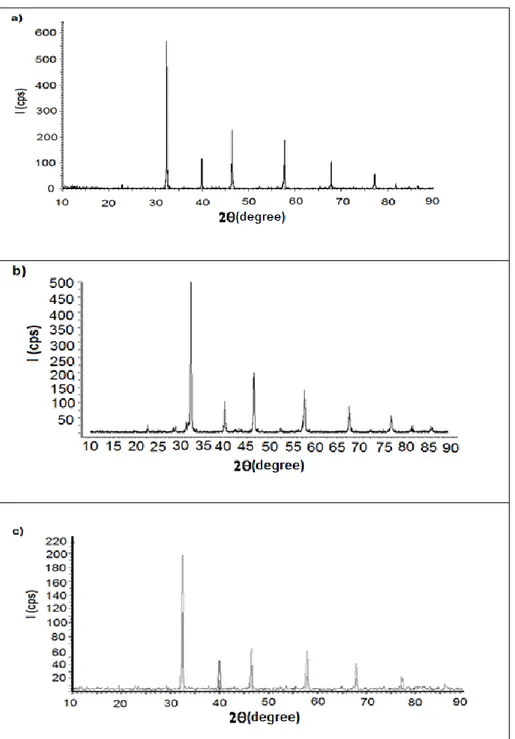
Fig. 6. The indexed XRD pattern of a) SrTiO3, (b) SrTiO3: Eu3+ (1% mol), Dy3+ (1% mol) and c) SrTiO3: Ho3+
(1% mol), Dy3+ (1% mol) at 1000 oC
Excitation and emission spectra of SrTiO3 doped
withEu3+ (1% mol), Dy3+ (1% mol) are shown in Fig.
15. The sample is excited at 205 nm and 310 nm. Fewer than 205 and 310 nm excitation wavelength, SrTiO3 doped withEu3+(1% mol), Dy3+(1% mol)
have an emission band at 612 nm. The emission band belongs to 5D
0 → 7F2 transition of Dy3+ ions.
Additionally, the sample has yellow color under UV lamp excitation with 366 nm.
Excitation and emission spectra of BaTiO3 doped
withDy3+ (1% mol), Ho3+(1% mol) are shown in
Fig. 16. The sample is excited at 200 nm and 800 nm. Fewer than 200 nm and 800 nm excitation wavelengths, SrTiO3 doped with Eu3+ (1% mol),
Dy3+(1% mol) have an emission bands at 546 nm and
584 nm. The emission band belongs to 4I
15/2 → 6H15/2
transition of Dy3+ ions and 4F
9/2 → 6H13/2 transition
of Ho3+. Additionally, the sample has yellow color
under UV lamp excitation with 366 nm.
Excitation and emission spectra of BaTiO3 doped
withDy3+(1% mol), Eu3+(1% mol) are shown in
Fig.17. The sample is excited at 200 nm and 800 nm. Fewer than 200 and 800 nm excitation wavelengths, BaTiO3 doped withDy3+ (1% mol), Eu3+ (1% mol)
have an emission bands at 590 nm, 610 nm and 687 nm. The emission bands belong to. 5D
0 → 7F1, 5D
0 → 7F2 and 5D0 → 7F4 transition of Eu3+ ions.
There is no band of Dy3+ ion. Additionally, the
sample has yellow color under UV lamp excitation with 366 nm.
Kayacı et. al/ Journal of Nuclear Sciences Vol 2 (2) (2015) 31-47
Fig. 7. The indexed XRD pattern of (a) BaTiO3, (b) BaTiO3: Dy3+(1% mol), Ho3+(1% mol) and (c) BaTiO3: Dy3+
(1% mol), Eu3+(1% mol)at 1000 oC
Table 1. Unit cell parameters of CaTiO3 and CaTiO3: Eu3+(1% mol), Dy3+(1% mol)
Sample a/pm b/pm c/pm V/pm3
CaTiO3 763.90 544.00 538.00 224.106
(a) (b)
Fig. 8. SEM images of (a) CaTiO3 and (b) CaTiO3: Eu3+(1% mol), Dy3+(1% mol)
(a) (b)
(c)
Fig.9. SEM images of (a) SrTiO3, (b) SrTiO3:Eu3+(1% mol), Dy3+ (1% mol) and (c) SrTiO3: Ho3+(1% mol),
Kayacı et. al/ Journal of Nuclear Sciences Vol 2 (2) (2015) 31-47
(a) (b)
(c)
Fig.10. SEM image of (a) BaTiO3, (b) BaTiO3:Dy3+ (1% mol), Ho3+ (1% mol) and (c) BaTiO3: Dy3+(1% mol),
Eu3+(1% mol)
Fig.12. EDX analysis of (a) SrTiO3, (b) SrTiO3: Eu3+(1% mol), Dy3+(1% mol) and (c) SrTiO3: Ho3+ (1% mol),
Kayacı et. al/ Journal of Nuclear Sciences Vol 2 (2) (2015) 31-47
Fig.13. EDX analysis of (a) BaTiO3, (b) BaTiO3: Dy3+(1% mol), Ho3+(1% mol) and (c) BaTiO3:Dy3+(1% mol),
Fig. 14. Excitation and emission spectrum of Eu3+ (1% mol), Dy3+(1% mol) doped CaTiO
3 system
Fig. 15. Excitation and emission spectrum of Eu3+ (1% mol), Dy3+ (1% mol) doped SrTiO
3 system.
Fig.16. Excitation and emission spectrum of Dy3+ (1% mol),Ho3+(1% mol) doped BaTiO
Kayacı et. al/ Journal of Nuclear Sciences Vol 2 (2) (2015) 31-47
Fig.17. Excitation and emission spectrum of Dy3+ (1% mol), Eu3+(1% mol) doped BaTiO 3
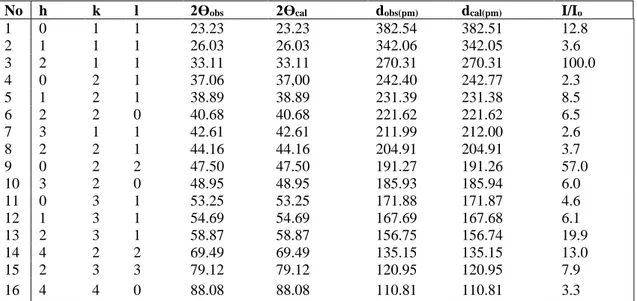
Table 2. XRD powder pattern data of CaTiO3
No h k l 2Өobs 2Өcal dobs(pm) dcal(pm) I/Io
1 0 1 1 23.23 23.23 382.54 382.51 12.8 2 1 1 1 26.03 26.03 342.06 342.05 3.6 3 2 1 1 33.11 33.11 270.31 270.31 100.0 4 0 2 1 37.06 37,00 242.40 242.77 2.3 5 1 2 1 38.89 38.89 231.39 231.38 8.5 6 2 2 0 40.68 40.68 221.62 221.62 6.5 7 3 1 1 42.61 42.61 211.99 212.00 2.6 8 2 2 1 44.16 44.16 204.91 204.91 3.7 9 0 2 2 47.50 47.50 191.27 191.26 57.0 10 3 2 0 48.95 48.95 185.93 185.94 6.0 11 0 3 1 53.25 53.25 171.88 171.87 4.6 12 1 3 1 54.69 54.69 167.69 167.68 6.1 13 2 3 1 58.87 58.87 156.75 156.74 19.9 14 4 2 2 69.49 69.49 135.15 135.15 13.0 15 2 3 3 79.12 79.12 120.95 120.95 7.9 16 4 4 0 88.08 88.08 110.81 110.81 3.3
Table 3. XRD powder pattern data of CaTiO3: Eu3+ (1% mol), Dy3+(1% mol)
No h k l 2Өobs 2Өcalc dobs (pm) dcalc(pm) I/Io
1 0 1 1 23.23 23.23 382.54 382.51 12.8 2 1 1 1 26.03 26.03 342.06 342.05 3.6 3 2 1 1 33.11 33.11 270.31 270.31 100.0 4 0 2 1 37.06 37,00 242.40 242.77 2.3 5 1 2 1 38.89 38.89 231.39 231.38 8.5 6 2 2 0 40.68 40.68 221.62 221.62 6.5 7 3 1 1 42.61 42.61 211.99 212.00 2.6 8 2 2 1 44.16 44.16 204.91 204.791 3.7 9 0 2 2 47.50 47.50 191.27 191.26 57.0 10 3 2 0 48.95 48.95 185.93 185.94 6.0 11 0 3 1 53.25 53.25 171.88 171.87 4.6 12 1 3 1 54.69 54.69 167.69 167.68 6.1
Table 4. Unit cell parameters of SrTiO3, SrTiO3: Eu3+ (1% mol), Dy3+(1% mol) and SrTiO3: Ho3+ (1% mol), Dy3+(1% mol) Sample a/pm V/pm3 SrTiO3 390.50 596.00 105 SrTiO3: Eu3+(1%),Dy3+(1%), 390.49 535.44.105 SrTiO3: Ho3+(1%),Dy3+(1%), 390.51 595.50.105
Table 5. XRD powder pattern data of SrTiO3
No h k l 2Өobs 2Өcalc dobs (pm) dcalc (pm) I/Io
1 1 0 0 22.75 22.75 390.51 390.51 3.3 2 1 1 0 32.40 32.40 276.13 276.13 100 3 1 1 1 39.96 39.96 225.46 225.46 20.8 4 2 0 0 46.47 46.47 195.25 195.25 39.7 5 2 1 1 57.79 57.79 159.42 159.42 32.9 6 2 2 0 67.82 67.82 138.07 138.07 18.8 7 3 1 0 77.18 77.18 123.49 123.49 10.3 8 3 1 1 81.72 81.72 117.74 117.74 3.5 9 2 2 2 86.21 86.21 112.73 112.73 4.5
Table 6. XRD powder pattern data of SrTiO3: Eu3+ (1% mol), Dy3+(1% mol)
No h k l 2Өobs 2Өcalc dobs (pm) dcalc (pm) I/Io
1 1 0 0 22.785 22.754 389.96 390.49 3.7 2 1 1 0 32.414 32.398 275.99 276.12 100 3 1 1 1 39.366 39.957 225.41 225.45 17.2 4 2 0 0 46.498 46.473 195.15 195.25 37.6 5 2 1 1 57.784 57.789 159.43 159.42 26.7 6 2 2 0 67.820 67.828 138.06 138.06 14.6 7 3 1 0 77.187 77.189 123.49 123.49 9.5 8 3 1 1 81.724 81.725 117.74 117.74 2.9 9 2 2 2 86.205 86.211 112.73 112.73 3.4
Table 7. XRD powder pattern data of SrTiO3: Ho3+(1% mol), Dy3+(1% mol)
No h k l 2Өobs 2Өcalc dobs (pm) dcalc(pm) I/Io
1 1 0 0 22,751 22,753 390,55 390,51 4,5 2 1 1 0 32,396 32,397 276,13 276,13 100,0 3 1 1 1 39,955 39,956 225,47 225,46 23,7 4 2 0 0 46,471 46,471 195,25 195,25 32,3 5 2 1 1 57,783 57,786 159,43 159,42 29,7 6 2 2 0 67,821 67,825 138,07 138,06 18,4 7 3 1 0 77,184 77,186 123,49 123,49 9,1 8 3 1 1 81,724 81,722 117,74 117,74 3,8 9 2 2 2 86,210 86,207 112,73 112,73 5,4
Table 8. Unit cell parameters of BaTiO3, BaTiO3:Dy3+ (1% mol), Ho3+(1% mol) and BaTiO3: Dy3+(1% mol),
Eu3+(1% mol)
Sample a-b/pm c/pm V/pm3
BaTiO3 400.90 400.28 643.00.105
BaTiO3: Dy3+(1%), Ho3+(1%) 400.92 400.27 633.38.105
Kayacı et. al/ Journal of Nuclear Sciences Vol 2 (2) (2015) 31-47
Table 9. XRD powder pattern data of BaTiO3
No h k l 2Өobs 2Өcalc dobs (pm) dcalc (pm) I/Io
1 0 0 1 22.190 22.190 400.28 400.28 17.1 2 1 1 0 31.535 31.535 283.48 283.48 100.0 3 1 1 1 38.899 38.899 231.34 231.34 29.2 4 0 0 2 45.273 45.273 200.14 200.14 17.9 5 1 0 2 50.956 50.957 179.07 179.07 7.1 6 1 1 2 56.215 56.216 163.50 163.50 22.9 7 2 0 2 65.897 65.897 141.63 141.63 10.2 8 0 0 3 70.523 70.524 133.43 133.43 2.9 9 1 0 3 74.955 74.956 126.60 126.60 9.3 10 1 1 3 79.299 79.296 120.72 120.72 3.1 11 2 2 2 83.510 83.510 115.67 115.67 7.2
Table 10. XRD powder pattern data of BaTiO3: Dy3+ (1% mol), Ho3+(1% mol)
No h k l 2Өobs 2Өcalc dobs (pm) dcalc (pm) I/Io
1 0 0 1 22.19 22.19 400.33 400.27 14.9 2 1 1 0 31.50 31.53 283.78 283.49 100.0 3 1 1 1 38.87 38.89 231.49 231.35 42.4 4 0 0 2 45.27 45.27 200.15 200.13 18.8 5 1 0 2 50.96 50.96 179.07 179.6 6.3 6 1 1 2 56.22 56.22 163.50 163.50 28.2 7 2 0 2 65.90 65.90 141.63 141.63 12.7 8 0 0 3 70.53 70.53 133.43 133.42 5.5 9 1 0 3 74.96 74.96 126.59 126.60 6.6 10 1 1 3 79.30 79.30 120.72 120.72 4.0 11 2 2 2 83.51 83.51 115.67 115.67 7.3
Table 11. XRD powder pattern data of BaTiO3: Dy3+ (1% mol), Eu3+ (1% mol)
No h k l 2Өobs 2Өcalc dobs (pm) dcalc (pm) I/Io
1 0 0 1 22.19 22.19 400.21 400.28 13.7 2 1 1 0 31.54 31.53 283.47 283.49 100.0 3 1 1 1 38.90 38.90 231.33 231.34 27.9 4 0 0 2 45.27 45.27 200.13 200.14 26.0 5 1 0 2 50.96 50.96 179.06 179.07 9.4 6 1 1 2 56.21 56.22 163.50 163.50 23.1 7 2 0 2 65.89 65.90 141.63 141.63 17.2 8 0 0 3 70.52 70.52 133.43 133.43 4.5 9 1 0 3 74.96 74.96 126.60 126.60 9.2 10 1 1 3 79.30 79.30 120.72 120.72 6.2 11 2 2 2 83.51 83.51 115.67 115.67 6.5
Table 12. The elemental analysis of CaTiO3 and CaTiO3: Eu3+(1% mol), Dy3+(1% mol), SrTiO3, SrTiO3: Eu3+
(1% mol), Dy3+(1% mol), SrTiO
3:Ho3+(1% mol), Dy3+(1% mol), BaTiO3, BaTiO3: Dy3+(1% mol), Ho3+(1% mol),
and BaTiO3: Dy3+(1% mol), Eu3+(1% mol) data
Calculated Experimental Ca Ti O Lanthanum series elements Ca Ti O Lanthanum series elements CaTiO3 29.48 35.22 35.30 -- 29.54 33.19 37.27 -- CaTiO3: Eu3+(1% mol), Dy3+(1% mol) 26.34 31.46 31.52 10.68 28.01 29.10 33.11 9.77 Sr Ti O Lanthanum series elements Sr Ti O Lanthanum series elements SrTiO3 47.75 26.09 26.16 -- 49.85 24.24 25.91 -- SrTiO3: Eu3+(1% mol), Dy3+(1% mol) 47.75 26.09 26.16 1.69 49.12 22.95 25.61 1.24
SrTiO3:Ho3+(1% mol),
Dy3+(1% mol) 47.75 26.09 26.16 1.69 45.85 26.20 25.41 1.68 Ba Ti O Lanthanum series elements Ba Ti O Lanthanum series elements BaTiO3 58.88 20.53 20.60 -- 58.34 20.18 21.48 -- BaTiO3: Dy3+(1% mol), Ho3+(1% mol) 58.22 20.53 20.58 1.33 58.87 20.80 18.96 1.36 BaTiO3: Dy3+(1% mol), Eu3+(1% mol) 58.22 20.53 20.58 1.332 56.83 20.28 20.91 1.62
Table 13. The color of samples under UV lamp excitation with 240 nm and 360 nm
Substances Synthesized Emission (nm) Color under UV light
240 nm (360 nm)
Color in daylight
CaTiO3 517 Light yellow Light yellow
CaTiO3: Dy3+(1%), Eu3+(1%) 590 Yellow Light yellow
SrTiO3 559 Yellow
(Red) White
SrTiO3:Dy3+(1%), Eu3+(1%) 612 Yellow White
SrTiO3: Dy3+(1%), Ho3+(1%) - Dark yellow
(Purple) Light yellow
BaTiO3 567 Yellow
(pink)
Cream BaTiO3: Dy3+(1%), Eu3+(1%) 590-610 Dark Brown
(Purple)
Cream
BaTiO3: Dy3+(1%), Ho3+(1%) 546-584 Brown Light Yellow
4. Conclusion
CaTiO3, SrTiO3 and BaTiO3 host crystals were
synthesized and doped with Dy3+, Eu3+ and Ho3+
ions. Orthorhombic crystal system of CaTiO3, cubic
crystal system of SrTiO3 tetragonal and crystal
system of BaTiO3 were determined in parallel
agreement with the literature.
Doping Dy3+, Eu3+ and Ho3+ ions does not change
unit cell parameters of host crystals. The characteristic emission peaks of Dy3+, Eu3+ and Ho3+
ions were determined.
Under UV lamp excitation with 240 nm and 360 nm, color of samples are listed in Table 13.
Kayacı et. al/ Journal of Nuclear Sciences Vol 2 (2) (2015) 31-47
Acknowledgement
We acknowledge the financial support granted by Erciyes University (ERUBAP), FBY-12-3945 and ID: 3945.
References
[1] W.J. Jaffe, R. Cook, H. Jaffe, “Piezoelectric ceramics”, Academic Press, New York (1971). [2] M.E. Lines, A.M. Glass, “Principles and
applications of ferroelectrics and related materials”, Oxford University Press, Oxford (2001).
[3] J.F. Scott, “Applications of modern ferroelectrics”, Science, 315 954–63 (2007). [4] Y. Yang, X.H. Wang, C.K. Sun, L.T. Li,
“Photoluminescence of high aspect-ratio PbTiO3 nanotube arrays”, J. Am. Ceram. Soc.,
91 3820–2 (2008).
[5] G. Nenartaviciene, K. Tonsuaadu, D. Jasaitis, A. Beganskiene, A.Kareiva, “Preparation and characterization of superconducting YBa2(Cu 1-xCrx)4O8 oxides by thermal analysis”, J. Therm.
Anal. Calorim., 90 173–81 (2007).
[6] M. Roy, P. Dave, S.K. Barbar, S. Jangid, D.M. Phase, AM. Awasth, “X-ray, SEM, and DSC studies of ferroelectric Pb1-xBaxTiO3 ceramics”,
J. Therm. Anal. Calorim., 101 833–40 (2010). [7] A. Caneiro, L. Mogni, N. Grunbaum, F. Prado,
“Physicochemical properties of non-stoichiometric oxides mixed conductors: part I”, J. Therm. Anal. Calorim., 103 597–606 (2011). [8] M.L. Moreira, M.F.C. Gurgel, G.P. Mambrini,
E.R. Leite, P.S. Pizani, J.A. Varela, E. Longo “Photoluminescence of barium titanate and barium zirconate in multilayer disordered thin films at room temperature”, J. Phys. Chem. A, 112 8938-8942 (2008).
[9] K.M. Lina, C.C. Lina, C.Y. Hsiaob, Y.Y. Lia, “Synthesis of Gd2Ti2O7:Eu3+, V4+ phosphors by
sol–gel process and its luminescent properties”, J. Lumin, 127 561-567 (2007).
[10] G.F.G. Freitas, R.S. Nasar, M. Cerqueira, D.M.A. Melo, E. Longo, J.A. Varel, “Luminescence in semi-crystalline zirconium titanate doped with lanthanum”, Mater. Sci. Eng. A., 434 19-22 (2006).
[11] I. Wuled Lenggoro, C. Panatarani, K. Okuyama, “One-step synthesis and photoluminescence of doped strontium titanate particles with controlled morphology”, Mater. Sci.Eng. B. 113 60-66 (2004).
[12] J.K. Park, H. Ryu, H.D. Park, S.Y. Choi, “Synthesis of SrTiO3:Al, Pr phosphors from a
complex precursor polymer and their luminescent properties”, J Eur Ceram Soc., 21 535-543 (2001).
[13] L. Hu, H. Song, G. Pan, B. Yan, R. Qin, Q.Dai, “Enhancement of red spectral emission intensity of Y3Al5O12:Ce3+ phosphor via Pr co-doping and
Tb substitution for the application to white LEDs”, J. Lumin. 127 371-376 (2007).
[14] A. Sinha, S.R. Nair, P.K. Sinha, “Single step synthesis of Li2TiO3 powder”, J. Nucl. Mater.
399 162-167 (2010).
[15] A.T. De Figueiredo, V.M. Longo, S. De Lazaro, V.R. Mastelaro, F.S. De Vicente, A.C. Hernandes, M. Li Siu, J.A. Varela, E. Longo, Blue-green and red photoluminescence in CaTiO3:Sm, Journal of Luminescence. 126, 403–
407, (2007).
[16] Katsumata, T., Kohno, Y., Kubo, H., Komuro S., Morikawa T., ”Low temperature fluorescence thermometer application of long afterglow phosphorescent SrAl12O19: Eu2+,Dy3+ crystals”,