NOVEL WIRELESS RF-BIOMEMS IMPLANT
SENSORS OF METAMATERIALS
A THESIS SUBMITTED TO
THE DEPARTMENT OF ELECTRICAL AND ELECTRONICS ENGINEERING AND THE INSTITUTE OF ENGINEERING AND SCIENCES
OF BILKENT UNIVERSITY
IN PARTIAL FULLFILMENT OF THE REQUIREMENTS FOR THE DEGREE OF
DOCTOR OF PHILOSOPHY
By
Rohat Melik
August 2010
ii
I certify that I have read this thesis and that in my opinion it is fully adequate, in scope and in quality, as a dissertation for the degree of doctor of philosophy.
Assoc. Prof. Dr. Hilmi Volkan Demir (Supervisor)
I certify that I have read this thesis and that in my opinion it is fully adequate, in scope and in quality, as a dissertation for the degree of doctor of philosophy.
Prof. Dr. Ergin Atalar
I certify that I have read this thesis and that in my opinion it is fully adequate, in scope and in quality, as a dissertation for the degree of doctor of philosophy.
iii
I certify that I have read this thesis and that in my opinion it is fully adequate, in scope and in quality, as a dissertation for the degree of doctor of philosophy.
Assoc. Prof. Dr. M. Özgür Oktel
I certify that I have read this thesis and that in my opinion it is fully adequate, in scope and in quality, as a dissertation for the degree of doctor of philosophy.
Prof. Dr. Birsen Saka
Approved for the Institute of Engineering and Science:
Prof. Dr. Levent Onural
iv
ABSTRACT
NOVEL WIRELESS RF-BIOMEMS IMPLANT SENSORS OF
METAMATERIALS
Rohat Melik
PhD in Electrical and Electronics Engineering Supervisor: Assoc. Prof. Dr. Hilmi Volkan Demir
August 2010
Today approximately one out of ten patients with a major bone fracture does not heal properly because of the inability to monitor fracture healing. Standard radiography is not capable of discriminating whether bone healing is occurring normally or aberrantly. To solve this problem, we proposed and developed a new enabling technology of implantable wireless sensors that monitor mechanical strain on implanted hardware telemetrically in real time outside the body. This is intended to provide clinicians with a powerful capability to asses fracture healing following the surgical treatment. Here we present the proof-of-concept in vitro and ex vivo demonstrations of bio-compatible radio-frequency (RF) micro-electro-mechanical system (MEMS) strain sensors for wireless strain sensing to monitor healing process. The operating frequency of these sensors shifts under mechanical loading; this shift is related to the surface strain of the implantable test material. In this thesis, for the first time, we developed and demonstrated a new class of bio-implant metamaterial-based wireless strain sensors that make use of their unique structural advantages in sensing, opening up important directions for the applications of metamaterials. These custom-design metamaterials exhibit better performance in remote sensing than traditional RF structures (e.g., spiral coils). Despite their small size, these meta-sensors feature a low enough operating frequency to avoid otherwise strong background absorption of soft tissue and yet yield higher Q-factors (because of their splits with high electric field density) compared to the spiral structures. We also designed and fabricated flexible metamaterial sensors to exhibit a high level of linearity, which can also conveniently be used on non-flat surfaces. Innovating on the idea of integrating metamaterials, we proposed and implemented a novel architecture of ‘nested metamaterials’ that incorporate multiple split ring
v
resonators integrated into a compact nested structure to measure strain telemetrically over a thick body of soft tissue. We experimentally verified that this nested metamaterial architecture outperforms classical metamaterial structures in telemetric strain sensing. As a scientific breakthrough, by employing our nested metamaterial design, we succeeded in reducing the electrical length of the sensor chip down to λo/400 and achieved telemetric operation across thick
soft tissue with a tissue thickness up to 20 cm, while using only sub-cm implantable chip size (compatible with typical orthopaedic trauma implants and instruments). As a result, with nested metamaterials, we successfully demonstrated wireless strain sensing on sheep’s fractured metatarsal and femur using our sensors integrated on stainless steel fixation plates and on sheep’s spine using directly attached sensors in animal models. This depth of wireless sensing has proved to suffice for a vast portfolio of bone fracture (including spine) and trauma care applications in body, as also supported by ongoing in vivo experiments in live animal models in collaboration with biomechanical and medical doctors. Herein, for all generations of our RF-bioMEMS implant sensors, this dissertation presents a thorough documentation of the device conception, design, modeling, fabrication, device characterization, and system testing and analyses. This thesis work paves the way for “smart” orthopaedic trauma implants, and enables further possible innovations for future healthcare.
Keywords: metamaterials, nested metamaterial, split ring resonators; microwave resonators;
bioMEMS sensors, RF-MEMS; telemetry, remote sensing; mechanical loading, strain; sensitivity, linearity, resonance frequency, quality factor (Q-factor), frequency shift; bio-implant, biocompatibility.
vi
ÖZET
METAMALZEME ÖZGÜN KABLOSUZ RF-BİYOMEMS
İMPLANT SENSÖRLER
Rohat Melik
Elektrik ve Elektronik Mühendisliği Doktora Tez Yöneticisi: Doçent Dr. Hilmi Volkan Demir
Agustos 2010
Günümüzde kemik kırıklarının iyileşmesi takip edilemediğinden dolayı büyük kemik kırığı olan yaklaşık on hastadan biri düzgün bir şekilde iyileşmemektedir. Standart radyografi kemiğin iyileşmesinin normal mi anormal mi geliştiğini ayıramamaktadır. Bu problemi çözmek için, implant donanımın üzerindeki mekanik gerinimi vücut dışından kablosuz olarak gerçek zamanlı ölçmeye imkân veren vücut içerisine yerleştirebilecek yenilikçi sensör teknolojisini önerdik ve geliştirdik. Bu, cerrahi tedaviden sonra doktorların güçlü bir kapasiteyle kırığın iyileşmesini değerlendirmesini sağlayacak güçlü bir yeti sunar. Burada kırıkların iyileşmesini takip etmek için gerinimi kablosuz olarak algılayan biyo-uyumlu radyo frekansı (RF) mikro-elektro-mekanik sistem (MEMS) gerinim sensörlerini laboratuar ve ölü hayvan modeli ortamında gösteriyoruz. Bu sensörlerin çalışma frekansı mekanik yükleme altında kayar; bu kayma implant olabilecek test malzemesinin yüzey gerinimi ile bağlantılıdır. Bu tezde, algılamadaki kendine has yapısal avantajlarından faydalanan kablosuz yeni bir sınıf metamalzeme-tabanlı biyo-implant sensörleri ilk kez geliştirdik ve kullandık; bu metamalzeme kullanımıyla ilgili yeni yönler açtı. Bu özel tasarım metamalzemeler, geleneksel RF yapılarına (spiral bobinler) göre daha iyi kablosuz algılama sergilerler. Küçük boyutlarına rağmen, bu meta-sensörler yeterince düşük çalışma frekansı göstererek yumuşak dokunun aksi taktirde güçlü soğurmasından sakınır ve yine de spiral yapılara göre yarıklarında çok yüksek elektrik alan yoğunluğu olduğu için daha yüksek kalite faktörü gösterir. Ayrıca yüksek düzeyde doğrusallık gösteren ve ayrıca düz olmayan yüzeylere elverişli biçimde kullanılabilen esnek tabanlı metamalzeme sensörlerini tasarlayıp ürettik. Kalın yumuşak doku üzerinden gerinimi kablosuz ölçmek için metamalzemeleri birleştirme fikrine
vii
dayanan bir buluşla çok çatallı halka rezonatörlerini kompakt bir yapıda toplayan özgün içiçe metamalzeme yapısını önerdik ve gerçekleştirdik. Bu içiçe metamalzeme mimarinin kablosuz gerinimi algılamada klasik metamalzemelerden daha iyi çalıştığını deneysel olarak kanıtladık. Büyük bir bilimsel ilerleme olarak, içiçe metamalzeme tasarımlarımızı kullanarak sensörün elektriksel boyunu λo/400’e kadar düşürmeyi başardık ve sadece cm-altı implant olabilecek (tipik
ortopedik travma implantları ve enstrumanları ile uyumlu) çip boyutuyla 20 cm kalınlığa kadar yumuşak doku içinden kablosuz ölçümü başardık. Sonuç olarak, içiçe metamalzemelerle sensörlerimizi koyunun metatarsal ve femurunda paslanmaz çelik sabitleme plakası ile bütünleşmiş biçimde kullanarak ve koyunun omuriliğinde de hayvan modeline doğrudan tutturarak kablosuz gerinim algılamasını başarılı biçimde gösterdik. Bu kablosuz algılamada derinliği, biyomekanik ve tıp doktoru olan ortaklarımızla birlikte devam eden canlı hayvan modelleri deneylerince de desteklendiği üzere, vücuttaki kemik (omuririlik dahil) kırık ve travma uygulamalarında geniş bir portföy için yeterli olmuştur. Burada, bu doktora tezi RF-biyoMEMS implant sensörlerin farklı nesillerini tümüyle aygıt kavramından, tasarım, modelleme, üretim, aygıt karakterizasyonu, sistem testi ve analizine kadar her aşamayı dökümente etmektedir. Bu tez akıllı ortopedik travma implantları için kaldırım taşları döşemekte, gelecekte sağlık için muhtemel yeni buluşlara olanak sağlamaktadır.
Anahtar Sözcükler: metamalzeme, içiçe metamalzeme, çatallı halka rezonatörleri; mikrodalga
rezonatörleri; biyoMEMS sensörleri, RF-MEMS; uzaktan algılama; mekanik yükleme, gerinim; hassaslık, doğrusallık, rezonans frekansı, kalite faktörü (Q-factor), frekans kayması; biyo-implant, biyo uyumluluk.
viii
Acknowledgements
I would first like to thank Prof. Hilmi Volkan Demir for his endless support during my PhD study. A phone call may change a person’s life. After receiving my BS degree at METU Electrical and Electronics Engineering Department, I wanted to work as a research assistant since I wanted to pursue an academician career. When nobody gave me a chance of becoming an academician, he did. He gave me a call and took me as his research assistant. During my PhD, I have never forgotten his favor any time and I will never forget this in the future. I will be thankful to him in my whole life. He gave me the chance of becoming a scientist, supported and nurtured me scientifically, gave me the chance to show my potential and changed my life.
I would like to thank Prof. Ergin Atalar for his support, for discussions during the project and for giving useful comments and suggestions as being a member of my thesis committee. I also want to thank Prof. Ayhan Altıntaş, Prof. Özgür Oktel and Prof. Birsen Saka for their useful comments and suggestions as members of my thesis committee.
During the course of this work at Bilkent University (2005-2010), I was supported by the TÜBİTAK National Scholarship Programme-2211 for PhD Students for which I owe special thanks. This work is supported by TÜBA-GEBİP, ESF-EURYI, and TÜBİTAK EEEAG 105E066, 105E065, 106E020, 107E088, 107E297, 109E002, and 109E004, and EU MOON 021391. This work is also supported by a subcontract from the United States National Institutes of Health (NIH) 5R01EB010035.
I would like to thank my dear friend, my project teammate Emre Unal. I would like to give him my special thanks. Long days and nights, we worked together and these moments are special moments for me. He has made a great contribution to this project. His dynamism and talent were very important for the project. I would like to thank Dr. Nihan Kosku Perkgoz for her help during my thesis, especially in the writing of our articles. I would like to thank Dr. Zeynep Dilli who helped me a lot especially in the first stages of the project technically and during writing the
ix
articles. I also would like thank Prof. Christian Puttlitz for supervising biocompatibility studies and ex-vivo experiments.
I would like to give my deepest thanks to my wife Bahar. She always supported me, she always gave me confidence and she always trusted me. She brings me luck, after our meeting, my work all went well. She gave me her endless love, supported me and showed patience during preparation of my thesis defense.
I would like to thank my family members, my mother Senay and my brother Serhat. From my childhood and on, they always gave me their endless support. They are very special for me. Without their endless support and patience towards me, I would not be able to achieve my goals. I also would like to thank my uncle Sedat, who gave endless support to my family and me since my teenage. I also want to thank Bahar’s parents Mehmet Ali and Vecihe, and her sisters, Ruşa, Dılşa, Dilan, and Nazvan for always being kind to me and sharing their valuable child and sister with me.
Our office was like a family and my office mates are like my family members. Tuncay Özel has always been like a brother and helped me as I am his elder brother. Evren Mutlugün has also been like a brother and always make me happy when I feel sad. İlkem Özge Özel, Tuncay’s wife, has been like a niece and helped me all the time during my thesis work. I want to thank Evren’s wife, Sümeyye, and Tuncay’s wife, Özge, for making my friends very happy. I want to thank Sedat Nizamoğlu, who is always very kind and positive, and I also want to thank Özgür Çakmak, who is always positive and made discussions with me during my research and helped me for training.
I would like to thank Dr. Aşkın Kocabaş for his endless help and support during my PhD work. I also would like to thank Prof. Coşkun Kocabaş for his help during my PhD. I would like to thank my friend Bawer Okutmuştur, who helped me with everything especially in the first year, and I also want to thank my dear friends Mustafa Durukal and Erdinç Ircı, who gave me endless support during all my PhD study. I want to thank my friends Onur Taşçı, Mehrdad Atabak,
x
Özhan Ünverdi, and Haydar Çelik for their positive and helpful attitude towards me. I want to give my special thanks to my young teammates Sayım Gökyar, and Hatice Ertuğrul, who have always run for my help when I needed. I want to thank Mustafa Yorulmaz for his assistance in using Coventorware, and Prof. Aykutlu Dana and Ergün Karaman for their help in the construction of our experimental setup.
I would like to thank all former and recent group members of Devices and Sensors Group, who work under the supervision of Dr. Hilmi Volkan Demir. I would like to thank Özgün Akyüz, Aslı Yılmaz, Neslihan Çiçek, Gülis Zengin, Emre Sarı, Can Uran, Gürkan Polat, Akın Sefünç, Onur Akın, Olga Samarska, Sina Toru, Talha Erdem, Burak Güzeltürk, Veli Tayfun Kılıç, Kıvanç Güngör, Uğur Karatay, Urartu Şeker, Cüneyt Eroğlu, İrfan Bulu, Bora Alıcı, Yaşar Kemal Alp, Salih Kılıç, Evrim Çolak, Makbule Pehlivan, Murat Güre, Ergün Hırlakoğlu, Engin Zeydan, Halis Yerlikaya, Hikmettin Demir, Şerafettin Ay, Mehmet Paydaş, Faruk Aydoğdu, Ünal Deniz, Ömer Faruk Yekdeş, Mehmet Melik, Hasan Yeter, and many other friends helped to keep my spirits high all the time which I appreciate very much.
xi
Table of Contents
1. Introduction………..…..1
2. High Quality-Factor On-Chip Resonators………...…...5
2.1 Implementation of High Quality-Factor On-Chip Tuned Microwave Resonators at 7 GHz………...…...5
2.2 Design and Realization of a Fully On-Chip High-Q Resonator at 15 GHz on Silicon………..…..21
3. Resonance Frequency Shift of Resonators Loaded with Probes ………....41
3.1 Bio-implantable Passive On-Chip RF-MEMS Strain Sensing Resonators for Orthopaedic Applications………..………42
3.2 Circular High-Q Resonating Isotropic Strain Sensors with Large Shift of Resonance Frequency under Stress………..62
3.3 RF-MEMS Load Sensors with Enhanced Q-factor and Sensitivity in a Suspended Architecture………72
3.4 Wireless BioMEMS Sensor to Detect Fracture Healing………..95
4. Wireless Strain Sensing with Spiral Structure………111
4.1 Wireless Bio-implantable RF-MEMS Strain Sensors..………..111
4.2 Hybrid Arrays………124
4.3 Multi-turn Spirals………...133
4.4 Spiral Structure under Tension as Opposed to Compression….………....141
5. Wireless Strain Sensing Metamaterials………...148
5.1 Metamaterial-based Wireless RF-MEMS Strain Sensors………..148
5.2 Flexible Metamaterials for Wireless Strain Sensing………..157
5.3 Metamaterial Based Telemetric Strain Sensing in Different Industrial Materials...166
5.4 Metamaterial Parameters Affecting Wireless Strain Sensing………177
xii
6. Wireless Strain Sensing Nested Metamaterials……….………..194 6.1 Nested Metamaterials for Wireless Strain Sensing………...……….194 6.2 Further Investigation of Nested Metamaterial Design………..……….216 6.3 Experiments with Nested Metamaterials Operating at Low Frequency.…………...230 7. Conclusion………..………298 8. Bibliography………...301
xiii
List of Figures
2.1.1. Our circuit model conversion: We first consider a source driving the conventional circuit of the coil with two ports in (a), then consider one of these ports to be grounded in (b), from which we obtain the common representation of a parallel RLC circuit in (c). Unlike other approaches, here we expand this model further into a simple two-port circuit representation in (d)
to be used for all of our analytical simulations………9
2.1.2. Qind computed for our designs with s = 10 µm and s = 5 µm………..………....13
2.1.3. The process flow for the microfabrication of our on-chip microwave resonators shown in cross-sectional view at the stages of (a) metallization on the substrate, (b) dielectric film coating, (c) film patterning (wet etching), (d) interconnect metallization, and (e) final top coil metallization, along with (f) a top-view micrograph of our fabricated device...15
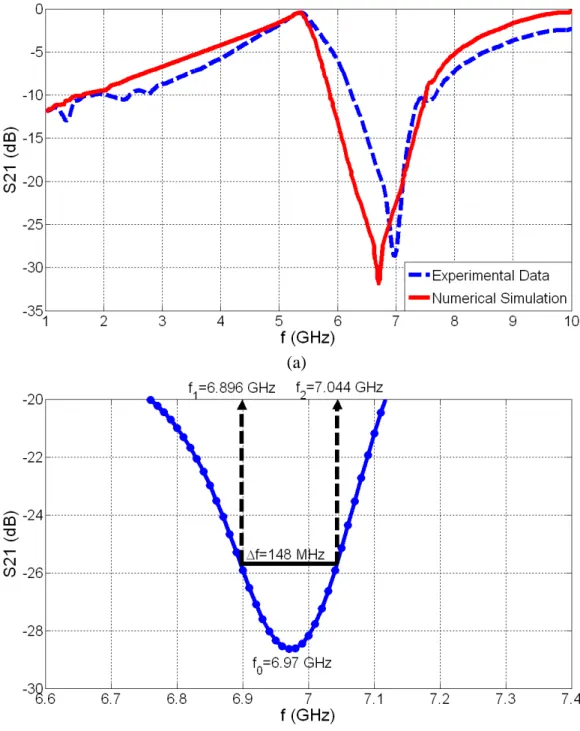
2.1.4. For our first device, (a) experimental measurement and numerical simulation of S21 parameter and (b) zoom-in experimental S21 data to illustrate the resonance frequency f0 and the 3-dB bandwidth Δf……….16
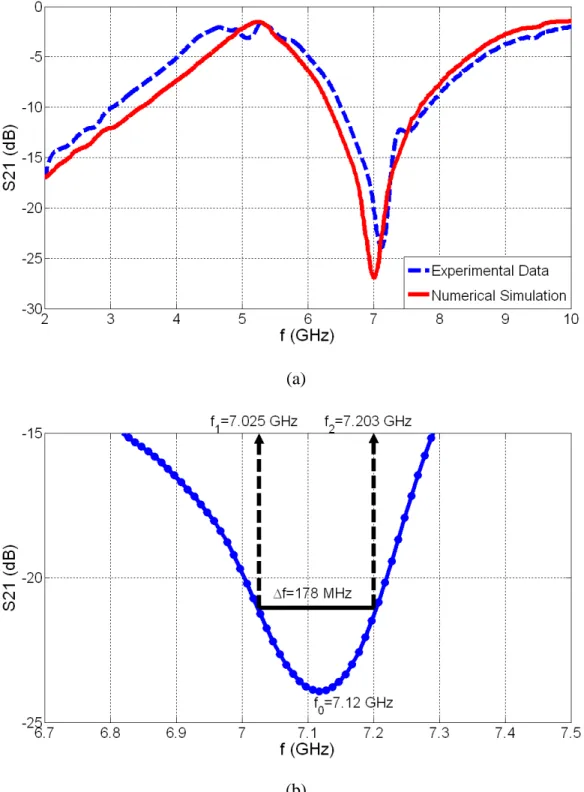
2.1.5. For our second device, (a) experimental measurement and numerical simulation of S21 parameter and (b) zoom-in experimental S21 data to illustrate the resonance frequency f0 and the 3-dB bandwidth Δf……….17
2.1.6. Qind computed for our design with LC = 270 µm………..………...19
2.2.1. Conventional lumped-element circuit model………..……….24
2.2.2. The conventional simplified one-port parallel RLC circuit………..…………...27
2.2.3. Our two-port circuit model to calculate the Q-factor……..……….…28
2.2.4. The relationship between Qind and substrate resistivity..…..………...30
2.2.5. The substrate loss factor as a function of the operating frequency.………..……...33
2.2.6. The self resonance frequency factor as a function of the operating frequency….……...33
xiv
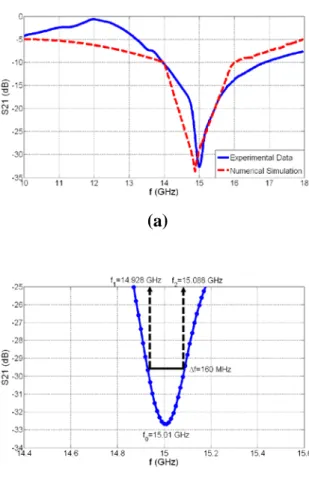
2.2.8. Micrographs of one of our fabricated devices showing (a) the spiral coil zoomed at the center and (b) in its entirety, along with (c) its cross-sectional layer diagram, and (d) that of the “thru” structure used for calibration purposes………...35 2.2.9. (a) Experimental data and numerical simulation results for S21 parameters, and (b) zoom-in
experimental S21 data to illustrate the Q-factor extraction from the experimental data…………37
2.2.10. (a) Qind of Device-1 and Device-2 (b) the experimental S21 parameter of Device-1, and
(c)the experimental S21 parameter of Device-2...……….………39
2.2.11. The Qind values of Our Device, Device-1 (where Our Device and Device-1 are optimally
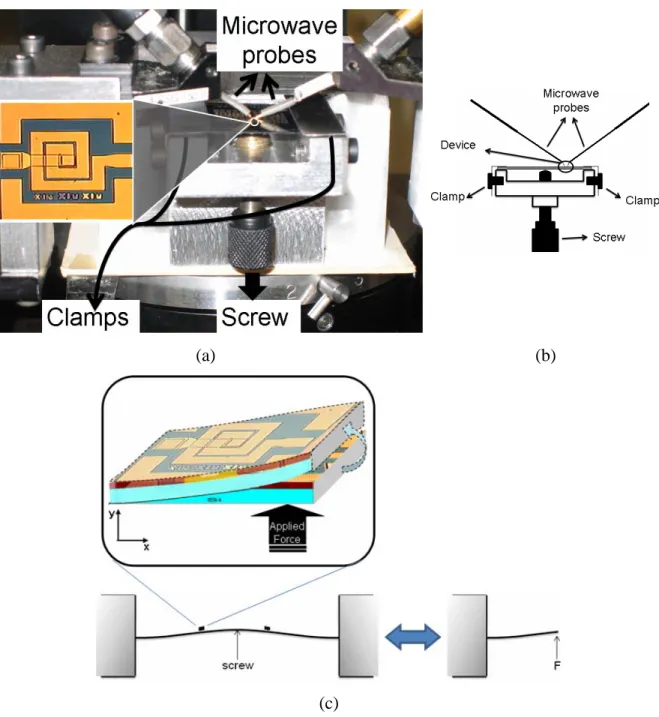
designed with our design methodology for their resonance frequencies), Device-3, Device-4 and Device-5.………...…….40 3.1.1. (a) The top-view micrograph of a fabricated resonator, (b) a side-view schematic of the resonator shown along with the lumped element representations of its physical model, and (c) our equivalent circuit model of the resonator.………...46 3.1.2. Illustration of the deformed device when a load of 1960 N is applied from the bottom. The area and the thickness of the device are fixed to 340 μm x 340 μm and 500 μm, respectively. z-direction is scaled down by a factor of 10 for better visualization. ……….……….50 3.1.3. (a) The experimental setup along with the fabricated sensor in the inset, (b) the cross sectional sketch of our experimental setup and its components, and (c) illustration of the mechanical deformation when the force is applied………52 3.1.4. Experimental measurements of S21 parameters as a function of frequency for (a) Sensor-1
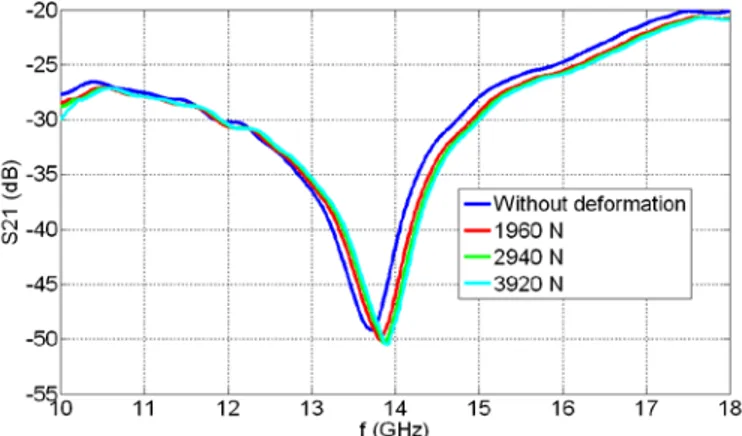
and (b) Sensor-2, along with their zoom-in resonance regions for (c) Sensor-1 and (d) Sensor-2, respectively, for the cases without deformation and when loads of 1960 N, 2940 N and 3920 N are applied………..54 3.1.5. Resonance frequency (f0) as a function of the externally applied load and the induced
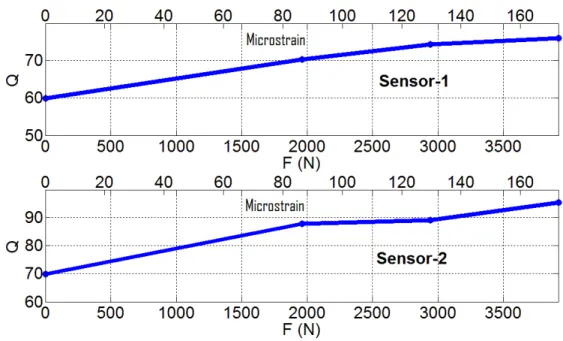
strain (microstrain) for Sensor-1 and for Sensor-2………56 3.1.6. Q-factor as a function of the applied load and the induced strain (microstrain) for Sensor-1 and Sensor-2………...58 3.1.7. A plan-view micrograph of our fabricated 270 μm×270 μm on -chip sensor along with the on-chip antennas for communication……….59 3.1.8. Experimental measurement of S21 parameters for the sensor under different loads taken by
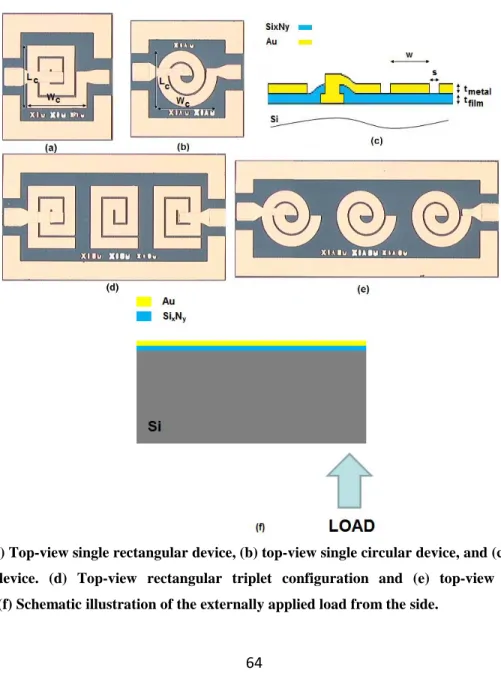
using the transmitter and receiver antennas………...60 3.2.1. (a) Top-view single rectangular device, (b) top-view single circular device, and (c) cross-sectional view of the device. (d) Top-view rectangular triplet configuration and (e) top-view circular triplet configuration. (f) Schematic illustration of the externally applied load from the side.………....64 3.2.2. Coventorware simulations of the strain distribution of the deformed devices when a load of 1,960 N is applied from the bottom (a) in a circular geometry and (b) in a rectangular geometry. The z-direction is scaled down by a factor of 10 for a better visualization of the image.……….66
xv
3.2.3. Experimental measurements of S21 parameters (dB) as a function of operating frequency
(GHz) for (a) the single rectangular device, (b) the single circular device, (c) the rectangular triplet configuration, and (d) the circular triplet configuration under the applied loads of 1,960 N, 2,940 N, and 3,920 N, along with their zoom-in S21 parameters (dB) vs. operating frequency
(GHz) (where the numbers of inset axes are grey colored) given around their resonances in the insets………..69
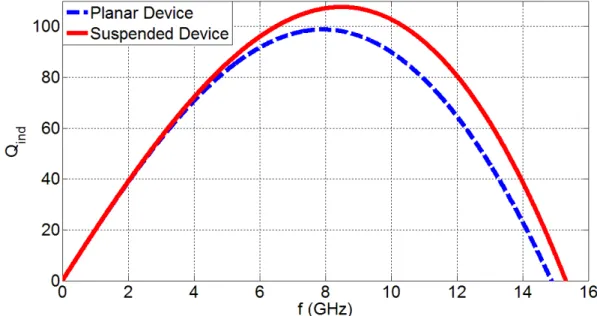
3.3.1. The Qind of the singular devices with respect to frequency………...76
3.3.2. The fabrication procedure………....78 3.3.3. Simulation of the silicon etching. The trapezoids represent areas where there are no Si3N4.
KOH solution etches the silicon through these regions.………...………...…..79 3.3.4. Planar images of the devices: a) the fabricated single suspended device and b) the fabricated suspended triplet device………80 3.3.5. SEM image of the single suspended device………...81 3.3.6. Experimental measurements of S21 parameters as a function of frequency for: (a) the single
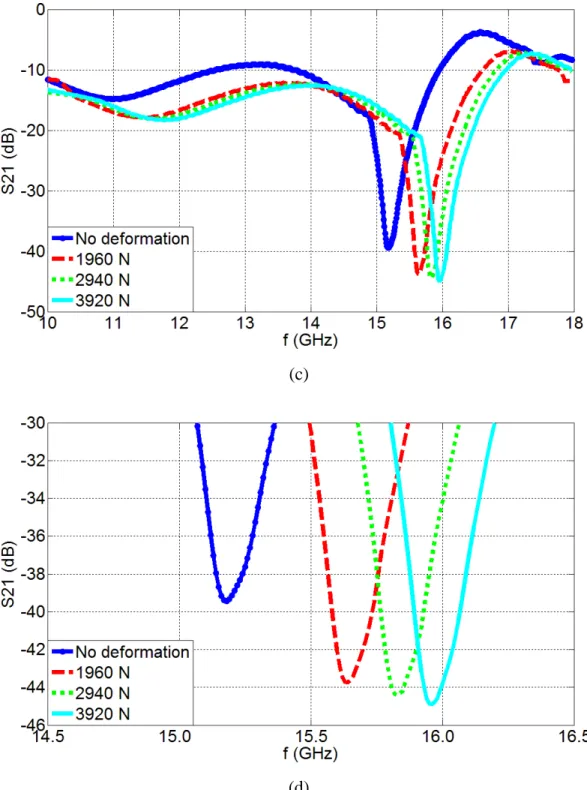
planar device and (b) zoom in for the single planar device, (c) the single suspended device and (d) zoom in for the single suspended device. Data is presented for the cases of no deformation and also when loads of 1960 N, 2940 N and 3920 N are applied.………...84 3.3.7. Experimental measurements of S21 parameters as a function of frequency for: (a) the
planar triplet device and (b) zoom in for planar triplet device, (c) the suspended triplet device and (d) zoom in for suspended triplet device. Data for the case of no deformation and also when loads of 1960 N, 2940 N and 3920 N are applied are presented.………..88 3.3.8. Numerical simulations for S21 parameters when there is no load (a) for the single planar
device, (b) for the single suspended device, (c) for the planar triplet device, and (d) for the suspended triplet device.………93 3.4.1. (a) The de-embedding structure for triplet configuration (b) the triplet structure, where the sensor is in the middle of the transmitting antenna and receiving antenna.………...…………...98 3.4.2. Experimental measurement and numerical simulation of S21 parameters with respect to
frequency (a) for planar single device (b) for planar triplet device (c) for suspended single device (d) for suspended triplet device ……….………..101 3.4.3. Experimental measurement and numerical simulation of S21 parameters with respect to
frequency (a) for rectangular single device (b) for rectangular triplet device (c) for circular single device (d) for circular triplet device ………...……….104 3.4.4. Experimental measurements of S21 parameters as a function of frequency (a) for single
device investigated and (b) zoom-in of S21 parameters for single device investigated, for the
cases of no deformation and when loads of 1960 N, 2940 N and 3920 N are applied.………...106 3.4.5. Experimental measurements of S21 parameters as a function of frequency (a) for triplet
device investigated and (b) zoom-in of S21 parameters for triplet device investigated, for the
cases of no deformation and when loads of 1960 N, 2940 N and 3920 N are applied.………...………..107
xvi
4.1.1. (a) The top-view micrograph of a type fabricated resonator, (b) the whole single-type fabricated sensor, (c) the top-view micrograph of an array-single-type fabricated resonator, and (d) the whole array-type fabricated sensor.……….………..116 4.1.2. The experimental setup: (a) the compression apparatus and (b) the force adjustment component………117 4.1.3. Experimental measurements of single-type sensor (a) transmission as a function of frequency with different applied loads, (b) the zoom-in of the transmission as a function of frequency with different applied loads, (c) F vs. Δf0, (d) microstrain vs. Δf0, (e) the error in terms
of microstrain, and (f) the error in percentages.………...………119 4.1.4. Experimental measurements of array-type sensor (a) transmission as a function of frequency with different applied loads (b) the zoom-in of the transmission as a function of frequency with different applied loads (c) F vs. Δf0, (d) microstrain vs. Δf0, (e) the error in terms
of microstrain, and (f) the error in percentages.…………...………121 4.2.1. (a) The top view of the micrograph single-circular device and (b) the whole single-circular device; (c) the top view of the micrograph array-circular device and (d) the whole array-circular device; (e) the top view of the micrograph multiarray-circular device and (f) the whole multiarray-circular device; and (g) the top view of the micrograph hybrid array device and (h) the whole hybrid array device.………...125 4.2.2. Experimental measurements of the single-circular sensor: (a) Transmission spectra under different applied loads, (b) the zoom-in of the transmission spectra (c) F vs. Δf0, (d) microstrain
vs. Δf0, (e) error in terms of microstrain, and (f) the error in terms of
percentage.………...………....127 4.2.3. Experimental measurements of the array-circular sensor: (a) Transmission spectra under different applied loads, (b) the zoom-in of transmission spectra, (c) F vs. Δf0, (d) microstrain vs.
Δf0, (e) error in terms of microstrain, and (f) error in terms of percentage.………128
4.2.4. Experimental measurements of the multiarray-circular sensor: (a) Transmission spectra under different applied loads, (b) the zoom-in of transmission spectra, (c) F vs. Δf0, (d)
microstrain vs. Δf0, (e) error in terms of microstrain and (f) error in terms of percentage……..130
4.2.5. Experimental measurements of the hybrid array sensor: (a) Transmission pectra under different applied loads, (b) the zoom-in of transmission spectra, (c) F vs. Δf0, (d) microstrain vs.
Δf0, (e) error in terms of microstrain, and (f) error in terms of percentage……….…132
4.3.1. (a) The top view micrograph of Sensor-1, and (b) the whole picture of Sensor-1; (c) the top view micrograph of Sensor-2, and (d) the whole picture of Sensor-2; and (e) the top view micrograph of Sensor-3 and (f) the whole picture of Sensor-3.………...134 4.3.2. Experimental measurements of Sensor-1: (a) Transmission spectra under different applied loads, (b) zoom-in of transmission spectra, (c) F vs. Δf0, (d) microstrain vs. Δf0, (e) error in terms
of microstrain and (f) error in terms of percentage………...…...136 4.3.3. Experimental measurements of Sensor-2: (a) Transmission spectra under different applied loads, (b) zoom-in of transmission spectra, (c) F vs. Δf0, (d) microstrain vs. Δf0, (e) error in terms
xvii
4.3.4. Experimental measurements of Sensor-3: (a) Transmission spectra under different applied loads, (b) zoom-in of transmission spectra, (c) F vs. Δf0, (d) microstrain vs. Δf0, (e) error in terms
of microstrain and (f) error in terms of percentage………..139 4.4.1. Tension setup (a) mechanical apparatus and (b) antennas. ………...142 4.4.2. Experimental characterization results of single-type sensor under tension: (a) Transmission spectra under different applied loads, (b) F vs. Δf0, and (c) error in terms of percentage……...144
4.4.3. Experimental characterization results of array-type sensor under tension: (a) Transmission spectra under different applied loads, (b) F vs. Δf0, and (c) error in terms of percentage……...146
5.1.1. Our microfabricated 5 × 5 split ring resonator (SRR) array based strain sensor under test in the compression apparatus………...152 5.1.2. (a) Transmission spectra of our metamaterial strain sensor parameterized with respect to the external force, (b) its resonance frequency shift versus the applied force, and (c) the microstrain versus resonance frequency………..154 5.2.1. (a) Fabrication procedure of the tape-based flexible sensor and (b) the final fabricated structure of the tape-based flexible sensor………...159 5.2.2. (a) Transmission spectra of the silicon-based sensor parameterized with respect to the external force, (b) its F (and microstrain) vs. Δf0, and (c) its errors in terms of microstrain.….161
5.2.3. (a) Transmission spectra of the tape-based flexible sensor parameterized with respect to the external force, (b) its F (and microstrain) vs. Δf0, and (c) its errors in terms of
microstrain………...163 5.3.1. The fabricated sensors fixated on different materials. The materials are (a) cast polyamide, (b) derlin and (c) polyamide. (d) The sensor shown with its dimensions. (e) Our compression setup……….…169 5.3.2. Wired strain gauge measurements on cast polyamide test specimen. (a) Microstrain vs. ΔR, (b) microstrain error and (c) percentage error of the wired strain gauge measurements……….170 5.3.3. Metamaterial measurements on cast polyamide stick. (a) Transmission spetra with respect to the case of no load, (b) microstrain vs. ΔR, (c) microstrain error and (d) percentage error of the wireless measurements………...171 5.3.4. Wired strain gauge measurements on derlin test specimen. (a) Microstrain vs. ΔR, (b) microstrain error and (c) percentage error of the wired strain gauge measurements…………...172 5.3.5. Metamaterial measurements on derlin stick. (a) Transmission spectra with respect to the case of no load, (b) microstrain vs. ΔR, (c) microstrain error and (d) percentage error of the wireless measurements……….173 5.3.6. Wired strain gauge measurements on polyamide test specimen. (a) Microstrain vs. ΔR, (b) microstrain error and (c) percentage error of the wired strain gauge measurements…………...175 5.3.7. Metamaterial measurements on polyamide stick. (a) Transmission spectra parameterized with respect to the case of no load, (b) microstrain vs. ΔR, (c) microstrain error and (d) the percentage error of the wireless measurements………..176
xviii
5.4.1. The simulation of the meta-sensor. There is an E-field localization in the gap………...178 5.4.2. Experimental measurements of Meta-2: (a) Transmission as a function of frequency with different applied loads, (b) F vs. Δf0 graph, (c) f0 vs. microstrain graph, (d) the error in terms of
microstrain and (f) the error in terms of percentage………181 5.4.3. Comparison of the experimental results of Meta-1 and Meta-2: (a) F vs. Δf0 of Meta-1 (b)
errors of Meta-1 in terms of percentage, (c) F vs. Δf0 of Meta-2, and (d) errors of Meta-2 in terms
of percentage………...182 5.4.4. Comparison of the experimental results of spiral structure (single-device), also previously shown in Section 4.1, and Meta-2: (a) Transmission spectra of the spiral structure under different levels of applied load, (b) F vs. Δf0 of the spiral structure, (c) errors of the spiral structure in
terms of percentage, (d) transmission spectra of the Meta-2 under different levels of applied load, (e) F vs. Δf0 of the Meta-2, and (f) errors of the Meta-2 in terms of percentage……….183
5.5.1. Tension setup……….………186 5.5.2. Experimental results of tensile loading on cast polyamide: (a) Transmission spectra under different levels of applied loads, (b) F vs. Δf0 and (c) error in terms of percentage………188
5.5.3. Experimental results of tensile loading on derlin: (a) Transmission spectra under different levels of applied loads, (b) F vs. Δf0 and (c) error in terms of percentage………...190
5.5.4. Experimental results of tensile loading on polyamide: (a) Transmission spectra under different levels of applied loads, (b) F vs. Δf0 and (c) error in terms of percentage………192
6.1.1. Split ring resonator (SRR) with (a) two turns (classical SRR), (b) one turn, and (c) four turns; (d) our nested SRR architecture, (e) comb-like structure and (f) zoom-in of our nested SRR………..200 6.1.2. Plan view pictures of (a) the classical SRR structure and (b) our nested SRR structure...202 6.1.3. (a) Mechanical apparatus and (b) coaxial probe antennas………...205 6.1.4. Experimental characterization of the classical SRR sensor under tension: (a) relative transmission spectra, (b) zoom-in of the transmission shift, (c) frequency shift (Δfo) vs. applied
load (F), (d) induced strain (microstrain) vs. frequency shift (Δfo), (e) error (in microstrain), and
(f) error percentage……….….208 6.1.5. Experimental characterization of the nested SRR sensor under tension: (a) relative transmission spectra, (b) zoom-in of the transmission shift, (c) frequency shift (Δfo) vs. applied
load (F), (d) induced strain (microstrain) vs. frequency shift (Δfo), (e) error (in microstrain), and
(f) error percentage……….……….210 6.1.6. 2x (A) and 4x (B) images of the H&E stained tissue adjacent to the implanted sensor. After six months in vivo, no evidence of inflammation or adverse tissue response was documented adjacent to any of the implanted sensors demonstrating adequate biocompatibility………...212 6.1.7. In vitro characterization with soft tissue (a) in front view showing antennas (b) in back view showing the sensor………..213
xix
6.1.8. Experimental characterization of the nested SRR sensor using soft tissue under tension: (a) relative transmission spectra, (b) zoom-in of the transmission shift, (c) frequency shift (Δfo) vs.
applied load (F), (d) induced strain (microstrain) vs. frequency shift (Δfo), (e) error (in
microstrain), and (f) error percentage………...215 6.2.1. Experimental relative transmission measurement of Nested-1 structure………..….217 6.2.2. Experimental transmission measurement of Nested-1 structure in the range of 137 -140 MHz. (a) Transmission spectra (around the first resonance) under different applied loads and (b)
F vs. Δf0………...…217
6.2.3. Experimental transmission measurement of 2.5 cm × 2.5 cm silicon substrate (with no sensor structure on it) in the same frequency range of the first mode…………...………..218 6.2.4. Experimental transmission measurement of 2.5 cm × 2.5 cm silicon plus Si3N4 film on it
(with no sensor structure on them) in the same frequency range of the first mode…………...218 6.2.5. Experimental transmission measurement of the sensor with 20 legs in the same frequency range of the first mode. (Its resonance is in the 500 MHz range.)………...219 6.2.6. Experimental transmission measurement of the distorted Nested-1 sensor with a gap in the bottom metal line in the same frequency range of the first mode………....219 6.2.7. Experimental transmission measurement of Nested-1 structure in the proper range of 473-489 MHz. (a) transmission spectra (around the second resonance) under different applied loads
and (b) F vs. Δf0………...220
6.2.8. Experimental transmission measurement of 2.5 cm × 2.5 cm silicon substrate in the same frequency range of the second mode………..….220 6.2.9. Experimental transmission measurement of 2.5 cm × 2.5 cm silicon substrate plus Si3N4
film in the same frequency range of the second mode……….220 6.2.10. Experimental transmission measurement of Nested-2 structure. (a) Transmission spectra under different applied loads and (b) F vs. Δf0………222
6.2.11. Experimental transmission measurement of 0.8 cm × 0.8 cm silicon substrate…...….222 6.2.12. Experimental transmission measurement of 0.8 cm × 0.8 cm silicon substrate plus Si3N4
film………...222 6.2.13. Experimental transmission measurement of flexible Nested-2 structure. (a) Transmission spectra under different applied loads and (b) F vs. Δf0………..………..223
6.2.14. Experimental transmission measurement of only stick………..………….223 6.2.15. Experimental transmission measurement of vacuum tape plus gold film…..……….…223
6.2.16. Experimental transmission measurement of vacuum tape plus gold plus Si3N4
film………...224 6.2.17. The simulated field maps of a meta-structure. (a) Electric energy density and (b) surface current distribution………...224
xx
6.2.19. Experimental measurement of our nested metamaterial chip as an antenna. (a) Its reflection spectrum and (b) E-plane radiation pattern……….226 6.2.20. Experimental transmission measurement of 2.5 cm × 2.5 cm nested metamaterial sensor chip at different distances from the external antenna. No meaningful sensing is possible after 1 cm in air………...228 6.3.1. (a) The experimental setup for 100 MHz measurements. (b) The compression setup…..231 6.3.2. Experimental measurements of 2.5 cm × 2.5 cm nested metamaterial sensor on the cast polyamide test material: (a) Transmission spectra of the stick, (b) transmission spectra for 50 MHz -150 MHz, (c) transmission spectra under 150 kgf applied load, (d) F vs. f0, (e)
transmission spectra over 150 kgf applied load, (f) F vs. f0 over 150 kgf applied load, (g) the
error in terms of microstrain over 150 kgf applied load, and (h) the error in terms of percentage over 150 kgf applied load………...….233 6.3.3. Experimental measurements of 2.5 cm × 2.5 cm nested metamaterial sensor with 0.5 cm thick soft tissue on the cast polyamide test material: (a) Transmission spectra for 50 MHz -150 MHz, (b) transmission spectra under 150 kgf applied load, (c) F vs. f0, (d) transmission spectra
over 150 kgf applied load, (e) F vs. f0 over 150 kgf applied load, (f) the error in terms of
microstrain over 150 kgf applied load, and (g) the error in terms of percentage over 150 kgf applied load………..…234 6.3.4. Experimental measurements of 2.5 cm × 2.5 cm nested metamaterial sensor with 1 cm thick soft tissue on the cast polyamide test material: (a) Transmission spectra for 50 MHz -150 MHz, (b) transmission spectra under 150 kgf applied load, (c) F vs. f0, (d) transmission spectra
over 150 kgf applied load, (e) F vs. f0 over 150 kgf applied load, (f) the error in terms of
microstrain over 150 kgf applied load, and (g) the error in terms of percentage over 150 kgf applied load………..…236 6.3.5. Experimental measurements of 2.5 cm × 2.5 cm nested metamaterial sensor with 2 cm thick soft tissue on the cast polyamide test material: (a) Transmission spectra for 50 MHz -150 MHz, (b) transmission spectra under 150 kgf applied load, (c) F vs. f0, (d) transmission spectra
over 150 kgf applied load, (e) F vs. f0 over 150 kgf applied load, (f) the error in terms of
microstrain over 150 kgf applied load, and (g) the error in terms of percentage over 150 kgf applied load………..…237 6.3.6. Experimental measurements of 2.5 cm × 2.5 cm nested metamaterial sensor with 5 cm thick soft tissue on the cast polyamide test material: (a) Transmission spectra for 50 MHz -150 MHz, (b) transmission spectra under 150 kgf applied load, (c) F vs. f0, (d) transmission spectra
over 150 kgf applied load, (e) F vs. f0 between 80 kgf -220 kgf applied load, (f) the error in terms
of microstrain between 80 kgf -220 kgf applied load, and (g) the error in terms of percentage between 80 kgf -220 kgf applied load……….………….239 6.3.7. Experimental measurements of 2.5 cm × 2.5 cm nested metamaterial sensor with 10 cm thick soft tissue on the cast polyamide test material: (a) Transmission spectra for 50 MHz -150 MHz, (b) transmission spectra under 150 kgf applied load, (c) F vs. f0, (d) transmission spectra
over 150 kgf applied load, (e) F vs. f0 between 80 kgf -220 kgf applied load, (f) the error in terms
of microstrain between 80 kgf -220 kgf applied load (g) the error in terms of percentage between 80 kgf -220 kgf applied load………...…...240
xxi
6.3.8. Experimental measurements of 2.5 cm × 2.5 cm nested metamaterial sensor with 20 cm thick soft tissue on the cast polyamide test material: (a) Transmission spectra for 50 MHz -150 MHz, (b) transmission spectra under 150 kgf applied load, (c) F vs. f0, (d) transmission spectra
over 150 kgf applied load, (e) F vs. f0 between 80 kgf -220 kgf applied load, (f) the error in terms
of microstrain between 80 kgf -220 kgf applied load (g) the error in terms of percentage between 80 kgf -220 kgf applied load………...…….…242 6.3.9. Experimental measurements of our 2.5 cm × 2.5 cm nested metamaterial sensor with 5 cm thick soft tissue on the metal stick test material: (a) Transmission spectra under different applied
loads and (b) F vs. f0………...………….243
6.3.10. Experimental measurements of our 2.5 cm × 2.5 cm nested metamaterial sensor with 10 cm thick soft tissue on the metal stick test material: (a) Transmission spectra under different
applied loads and (b) F vs. f0………..….243
6.3.11. Experimental measurements of our 2.5 cm × 2.5 cm nested metamaterial sensor with 20 cm thick soft tissue on the metal stick test material: (a) Transmission spectra under different
applied loads and (b) F vs. f0………...244
6.3.12. Schematic sketch of the experimental apparatus for the case of non-fracture. Wood is used to simulate the bone……….245 6.3.13. Experimental measurements of 2.5 cm × 2.5 cm nested metamaterial sensor for the case of non-fracture (a) transmission spectra under different applied loads and (b) F vs. f0………..246
6.3.14. Schematic illustration of the experimental apparatus for the case of non-fracture with an angle to the ground. Wood is used to simulate the bone………...………..247 6.3.15. Experimental measurement of 2.5 cm × 2.5 cm nested metamaterial sensor for the case of non-fracture with an angle to the ground: (a) transmission spectra under different applied loads, (b) transmission spectra under different applied loads between 40 and 70 kgf, and (c) F vs.
f0………...248
6.3.16. Schematic illustration of the experimental apparatus for the full fracture case. Plastic is used to simulate the bone………...249 6.3.17. Experimental measurement of our 2.5 cm × 2.5 cm nested metamaterial sensor for the full fracture case: (a) Transmission spectra under different applied loads and (b) F vs. f0……....…249
6.3.18. Schematic illustration of the experimental apparatus for the case of fracture with an insert. Plastic is used to simulate the bone………..….250 6.3.19. Experimental measurement of our 2.5 cm × 2.5 cm nested metamaterial sensor for the case of fracture with the first (softest) insert: (a) Transmission spectra under different applied
loads and (b) F vs. f0………...….251
6.3.20. Experimental measurement of our 2.5 cm × 2.5 cm nested metamaterial sensor for the case of fracture with the second insert: (a) Transmission spectra under different applied loads and
(b) F vs. f0………...…….251
6.3.21. Experimental measurement of our 2.5 cm × 2.5 cm nested metamaterial sensor for the case of fracture with the last (hardest) insert: (a) Transmission spectra under different applied
xxii
6.3.22. Schematic illustration of the experimental apparatus………...253 6.3.23. Photograph of the experimental setup………...….254 6.3.24. Zoomed-in pictures of the experimental setup from different angles (a) – (e)…………255 6.3.25. Experimental results of our 1.25 cm × 1.25 cm sensor with new calibration method………..256 6.3.26. Photograph of our 0.8 cm × 0.8 cm sensor attached to the implantable stick……...…..257 6.3.27. Photograph of the sample implant produced by the company “Synthes” specially for our sensor……….…..258 6.3.28. Photographs of the experimental setup from different angles (a) – (c)………...260 6.3.29. Schematic illustration of the perpendicular load application apparatus………...261 6.3.30. Experimental measurement of our 0.8 cm × 0.8 cm nested metamaterial sensor with no soft tissue: (a) Transmission spectra and (b) F vs. f0………...261
6.3.31. Experimental measurement of our 0.8 cm × 0.8 cm nested metamaterial sensor across 0.5 cm thick soft tissue: (a) Transmission spectra and (b) F vs. f0………....…262
6.3.32. Experimental measurement of our 0.8 cm × 0.8 cm nested metamaterial sensor across 1 cm thick soft tissue: (a) Transmission spectra and (b) F vs. f0………..…..262
6.3.33. Experimental measurement of our 0.8 cm × 0.8 cm nested metamaterial sensor across 2 cm thick soft tissue: (a) Transmission spectra and (b) F vs. f0………....262
6.3.34. Experimental measurement of our 0.8 cm × 0.8 cm nested metamaterial sensor across 5 cm thick soft tissue: (a) Transmission spectra, (b) F vs. f0, (c) narrower working range 1, (d)
narrower working range 2, and (e) narrower working range 3………263 6.3.35. Experimental measurement of our 0.8 cm × 0.8 cm nested metamaterial sensor across 10 cm thick soft tissue: (a) Transmission spectra and (b) F vs. f0………264
6.3.36. Experimental measurement of our 0.8 cm × 0.8 cm nested metamaterial sensor across 20 cm thick soft tissue: (a) Transmission spectra, (b) F vs. f0, (c) narrower working range 1, and (d)
narrower working range 2………....264 6.3.37. Schematic illustration of the angular load application apparatus………..……..…265 6.3.38. Experimental measurement of our 0.8 cm × 0.8 cm nested metamaterial sensor with no soft tissue: (a) Transmission spectra and (b) F vs. f0………...…266
6.3.39. Experimental measurement of our 0.8 cm × 0.8 cm nested metamaterial sensor across 0.5 cm thick soft tissue: (a) Transmission spectra and (b) F vs. f0………..………..266
6.3.40. Experimental measurement of our 0.8 cm × 0.8 cm nested metamaterial sensor across 5 cm thick soft tissue: (a) Transmission spectra, (b) F vs. f0, (c) narrower working range 1, and (d)
narrower working range 2………....267 6.3.41. Photographs of our flexible sensors from different angles (a) – (c)……..………..……271
xxiii
6.3.42. Experimental measurement of our flexible 0.8 cm × 0.8 cm nested metamaterial sensor with no soft tissue: (a) Transmission spectra, (b) F vs. f0, and (c) errors in terms of
percentage………272 6.3.43. Comparison of the sensing performances of the silicon-based sensor and the vacuum tape-based flexible sensor with no soft tissue: (a) The silicon-based sensor and (b) the vacuum tape-based flexible sensor………....272 6.3.44. Experimental measurement of our flexible 0.8 cm × 0.8 cm nested metamaterial sensor using 0.5 cm thick soft tissue: (a) Transmission spectra, (b) F vs. f0, and (c) errors in terms of
percentage………..…..273 6.3.45. Comparison of the sensing performances of the silicon-based sensor and the vacuum tape-based flexible sensor using 0.5 cm thick soft tissue: (a) The silicon-based sensor and (b) the vacuum tape-based flexible sensor………..273 6.3.46. Experimental measurement of our flexible 0.8 cm × 0.8 cm nested metamaterial sensor using 1 cm thick soft tissue: (a) Transmission spectra, (b) F vs. f0, and (c) errors in terms of
percentage………..…..274 6.3.47. Comparison of the sensing performances of the silicon-based sensor and the vacuum tape-based flexible sensor using 1 cm thick soft tissue: (a) The silicon-based sensor and (b) the vacuum tape-based flexible sensor……….….274 6.3.48. Experimental measurement of our flexible 0.8 cm × 0.8 cm nested metamaterial sensor using 2 cm thick soft tissue: (a) Transmission spectra, (b) F vs. f0, and (c) errors in terms of
percentage………275 6.3.49. Comparison of the sensing performances of the silicon-based sensor and the vacuum tape-based flexible sensor using 2 cm thick soft tissue: (a) The silicon-based sensor and (b) the vacuum tape-based flexible sensor………...….275 6.3.50. Experimental measurement of our flexible 0.8 cm × 0.8 cm nested metamaterial sensor using 5 cm thick soft tissue: (a) Transmission spectra, (b) F vs. f0, and (c) errors in terms of
percentage…...…...…276 6.3.51. Comparison of the sensing performances of the silicon-based sensor and the vacuum tape-based flexible sensor using 5 cm thick soft tissue: (a) The silicon-based sensor and (b) the vacuum tape-based flexible sensor……….….276 6.3.52. Experimental measurement of our flexible 0.8 cm × 0.8 cm nested metamaterial sensor using 10 cm thick soft tissue: (a) Transmission spectra, (b) F vs. f0, and (c) errors in terms of
percentage……….…...277 6.3.53. Comparison of the sensing performances of the silicon-based sensor and the vacuum tape-based flexible sensor using 10 cm thick soft tissue: (a) The silicon-based sensor and (b) the vacuum tape-based flexible sensor……….….277 6.3.54. Experimental measurement of our flexible 0.8 cm × 0.8 cm nested metamaterial sensor using 20 cm thick soft tissue: (a) Transmission spectra, (b) F vs. f0, and (c) errors in terms of
xxiv
6.3.55. Comparison of the sensing performances of the silicon-based sensor and the vacuum tape-based flexible sensor using 20 cm thick soft tissue: (a) The silicon-based sensor and (b) the vacuum tape-based flexible sensor……….….278 6.3.56. Experimental measurement of our flexible 0.8 cm × 0.8 cm nested metamaterial sensor with no soft tissue: (a) Transmission spectra, (b) F vs. f0, and (c) errors in terms of
percentage………279 6.3.57. Comparison of the sensing performances of the silicon-based sensor and the vacuum tape-based flexible sensor with no soft tissue: (a) The silicon-based sensor and (b) the vacuum tape-based flexible sensor………..…..279 6.3.58. Experimental measurement of our flexible 0.8 cm × 0.8 cm nested metamaterial sensor using 0.5 cm thick soft tissue: (a) Transmission spectra, (b) F vs. f0, and (c) errors in terms of
percentage………..……..280 6.3.59. Comparison of the sensing performances of the silicon-based sensor and the vacuum tape-based flexible sensor using 0.5 cm thick soft tissue: (a) The silicon-based sensor and (b) the vacuum tape-based flexible sensor………..280 6.3.60. Experimental measurement of our flexible 0.8 cm × 0.8 cm nested metamaterial sensor using 5 cm thick soft tissue: (a) Transmission spectra, (b) F vs. f0, and (c) errors in terms of
percentage……….…………..….281 6.3.61. Comparison of the sensing performances of the silicon-based sensor and the vacuum tape-based flexible sensor using 5 cm thick soft tissue: (a) The silicon-based sensor and (b) the vacuum tape-based flexible sensor……….…….281 6.3.62. Experimental apparatus for ex vivo experiments……….………282 6.3.63. Experimental setup for sheep’s metatarsal………..……283 6.3.64. Experimental measurement of our 0.8 cm × 0.8 cm nested metamaterial sensor on sheep’s metatarsal: (a) Transmission spectra and (b) F vs. f0………...284
6.3.65. Experimental measurement of our 0.8 cm × 0.8 cm nested metamaterial sensor on sheep’s metatarsal without fracture………...285 6.3.66. Experimental setup for sheep’s femur………..……...286 6.3.67. Experimental measurement of our 0.8 cm × 0.8 cm nested metamaterial sensor on sheep’s femur: (a) Transmission spectra and (b) F vs. f0……….……...287
6.3.68. Experimental setup for sheep’s spine………...…...…288 6.3.69. Experimental measurement of our 0.8 cm × 0.8 cm nested metamaterial sensor on sheep’s spine: (a) Transmission spectra and (b) M (moment) vs. f0……….……....289
6.3.70. Hysteresis behavior observed by our sensor: (a) Load cycles and (b) response of the sensor………...290 6.3.71. Ex vivo experimental setup from different angles (a) – (e)………..…….………...292 6.3.72. Experimental setup for sheep’s metatarsal experiments from different angles (a) – (d)...293
xxv
6.3.73. Experimental setup for sheep’s femur experiments from different angles (a) – (h)……….…296 6.3.74. Experimental setup for sheep’s spine experiments from different angles (a) – (d)….…297
xxvi
List of Tables
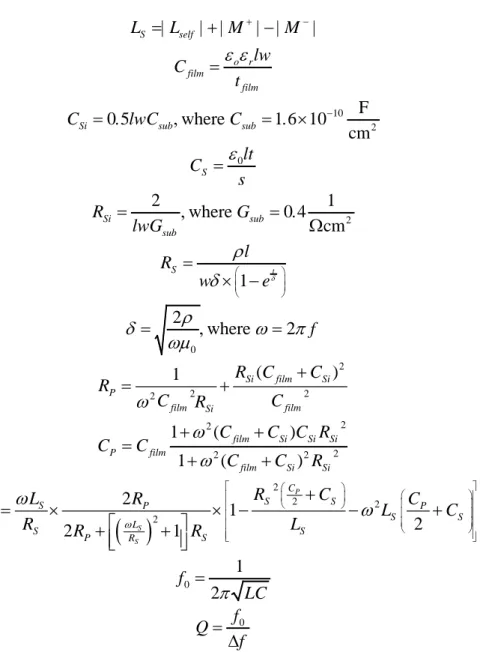
2.1.1. List of empirical equations used to calculate circuit components from design parameters...10 2.1.2. Our device design parameters………..12 2.1.3. Theoretical and experimental resonance frequencies, 3-dB bandwidths, and quality-factors of our devices……….18 2.2.1. The parameters of our device………...34
2.2.2. Theoretical and numerical LS values for our device………34
2.2.3. The theoretical and experimental resonance frequency and Q-factor……….37 2.2.4. The design parameters of some exemplary devices with N=2, tox=0.1 µm and t=0.1 µm.
Device-1 and Device-2 are optimally designed for their resonance frequencies with our design methodology. The f0 of Device-1 and Device-2 are experimental values while those of Device
3-4 and 5 are theoretical values. The Q values are experimental and Qmax values are theoretical...38
3.1.1. Our device parameters……….50
3.1.2. The theoretical and numerical LS values for Sensor-1 and Sensor-2………...51
3.1.3. The resonance frequencies of the sensors with the changing load values………...55 3.1.4. The shift of resonance frequencies of the sensors with the changing load values………...55 3.1.5. Q-factors with the changing load values………..55 3.2.1. Resonance frequencies, resonance frequency shifts, relative shifts, Q-factors, and sensitivities of our devices given as a function of changing load and induced strain levels…….70 3.3.1. The parameters of the resonator device………...…75 3.3.2. Resonance frequencies of the device variants with different loads……….85 3.3.3. The Q-factors of the variant devices with different loads………89 3.3.4. The sensitivities of the variant devices………89
xxvii
3.3.5. The theoretical and experimental resonance frequencies and Q-factors of the variant devices………93 3.4.1. The parameters of our device………...97 3.4.2. The theoretical and experimental resonance frequencies and Q-factors of the planar and suspended devices………101 3.4.3. The theoretical and experimental resonance frequencies and Q-factors of the rectangular and circular devices………..……104 3.4.4. The resonance frequencies of the devices with different loads……….108 3.4.5. The shift of the resonance frequencies of the devices with different loads………...108 3.4.6. The Q-factors of the devices with different loads………..109 3.4.7. The sensitivities of the devices………..109 4.1.1. Our device parameters………...115 4.2.1. Our device parameters………...…126 4.3.1. Our device parameters……….…..135 4.4.1. Our device parameters……….…..141 5.4.1. The device parameters of meta-sensors……….177 5.5.1. Our device parameters……….…..186 6.1.1. The parameters of classical SRR………...204 6.1.2. The parameters of nested SRR………...204 6.2.1. The parameters of nested metamaterials………216 6.3.1. The parameters of nested metamaterials………231 6.3.2. The parameters of our 1.25 cm × 1.25 cm nested metamaterial sensor……….253 6.3.3. The parameters of 0.8 cm nested metamaterials………257
xxviii
1
Chapter 1
Introduction
The ability to telemetrically measure strain is important in many aspects of daily life. However, such a task brings about important scientific and technological challenges. In many sectors such as in civil engineering, measuring the strength of materials (e.g., concrete) remotely in real time will help us understand their transient structural behavior better (e.g., before and after an earthquake). Similarly, real-time measurement of the flexural rigidity of aircraft components during service in avionics is also an important application of telemetric strain sensing. Another unrealized, yet critical, application area is human medicine and healthcare.
One important clinical issue in which we are currently interested is objectively monitoring the healing processes of fractured long bones [1]. Orthopaedic extremity injuries currently present a large medical and financial burden around the globe as can be seen for the United States in [2]. Severely comminuted fracture patterns, those commonly seen in high energy fractures, are difficult to treat due to the inherent absence of mechanical support through the native osseous tissue. In these cases, the implanted hardware (intramedullary rods, bone plates, screws, etc.) must assume the total mechanical load in the early post-operative term, which frequently results
2
in an aberrant course of healing and the onset of delayed union or non-union. The most common treatment for these complications is additional surgery. These types of orthopaedic injuries require prolonged time before patients return to full activity [3].
Approximately six million long bone fractures are reported per annum in the United States. Surprisingly, approximately 10% of these fractures do not heal properly. Though the exact mechanism through which the healing progression becomes impaired is poorly understood, many of these non-unions or pseudoarthroses result when there is a severe or communited condition that does not proceed through a stabilized (intramembranous ossification) healing pathway [4]. Currently, clinicians may monitor healing visually by radiographs, and may examine the mechanical condition of the union through manually bending the bone at the fracture [5]. Unfortunately, the course of aberrant fracture healing is not easily diagnosed in the early time period when standard radiographic information of the fracture site is not capable of discriminating the healing pathway. Reference 6 shows us that manual assessment of fracture healing is also subjective and, therefore, inadequate as a diagnostic tool in the early stages of healing.
It has been shown in animal models that healing is critically important in the early time period. Animal studies have demonstrated that the callus and bone assume an increasing proportion of the load as healing proceeds, reducing the load carried by the implanted hardware [1]. However, to date, many of the technologies that seek to exploit this bone-implant load sharing phenomena have been considered too large in dimension or involve implantation of an associated power supply. Previous investigations have been successful in determining forces in the hip [7]-[9], spine [10]-[12], and femur [13], [14]. However, due to the relatively large size of the sensors and associated hardware (signal conditioning, modulation, etc.), most of the aforementioned telemetry systems have been implanted inside of joint replacement components or bulky internal fixators. The result is that these devices have produced data that has been useful in the understanding of bone-implant loading, but have not been advantageous for large-scale implementation as diagnostic and prognostic tools. Also, due to the complexity of the designs and requisite interconnectivity, manufacture of these systems could only be performed on a
3
custom basis. The resulting expense could not justify their large-scale production.
To overcome the aforementioned shortcomings, we have developed wireless radio frequency (RF) micro-electro-mechanical (MEMS) strain sensors. By using such a remote sensor, it is expected that a continuous healing profile of an individual patient can be recorded during the activities of daily life.
We present a bio-MEMS strain sensor for implantation using a RF-MEMS approach. The operating principle is based on a concomitant operating frequency shift with mechanical deformation. We aim to sense biological data and transfer it effectively to an antenna outside the body. To interpret the biological data, the input is denoted by the physical load (F), and the output is denoted by the operating frequency readout (f0). As the load is applied to the stainless
steel plate, it deforms (strains) under the applied stress [1]. Eventually this strain decreases (due to the temporal shift in the load distribution) and modifies the operating frequency, thus allowing for real-time observation of the healing process in the fracture. Therefore, with the sensor chip we propose and demonstrate, it is possible to measure the change in the strain and hence to assess the healing process by means of this operating frequency shift. This f0 shift results
primarily from the change in the capacitance of the film between the metal and the substrate because of the modified area with the applied force.
In healthcare applications, we are typically constrained with the limited area of the sensors. In order to miniaturize the sensors, we first developed high Q-factor wired on-chip resonator in Chapter 2. We used this resonator concept throughout the thesis, and designed, and fabricated our wireless sensors based-on this concept at subsequent stages. We showed high Q-factor on-chip resonators operating at 7 GHz and at 15 GHz in this chapter.
In Chapter 3, we subsequently applied mechanical load to these on-chip resonators and observed the shift of their resonance frequency in response to mechanical deformation. We developed and demonstrated first accounts of the sensing mechanism in this chapter. We then developed
4
circular geometry and later suspended architecture and increased the performance of the sensors in both approaches. We also examined the triplet idea in detail in this chapter.
In Chapter 4, we showed the proof of concept demonstration of fully telemetric sensing using spiral RF coil architecture. In this chapter, we studied single type, array type, hybrid array type, and multi turn type of spiral sensors. We experimentally showed the importance of sensitivity, factor and linearity for sensing operation, and discussed approaches to increase sensitivity, Q-factor and linearity.
In Chapter 5, we proposed and developed wireless strain sensing using metamaterials for the first time. We discovered a very promising new application area for metamaterials, one in which metamaterials offer unique benefits compared to conventional RF coils. We showed wireless strain sensing with silicon-based and vacuum tape-based flexible sensors. We also showed wireless strain sensing for different industrial testing materials and examined important design parameters of metamaterials in wireless strain sensing.
In Chapter 6, we introduced our novel structure, nested metamaterials, and demonstrated wireless strain sensing with these nested metamaterials. We also discussed metamaterial related RF expertise developed in this thesis in this chapter. We experimentally achieved the wireless strain sensing at 100 MHz using 0.8 cm sensor with different thicknesses of soft tissue and demonstrated ex vivo strain sensing in sheep’s metatarsal, femur and spine telemetrically.
In Chapter 7, we finally conclude the thesis with a summary of our achievements and future prospects.
5
Chapter 2
High Quality-Factor On-Chip Resonators
In this chapter, we will examine the concept of high Q-factor on-chip resonators, and present design, implementation and experimental characterization for operation at 7 GHz and at 15 GHz.
2.1 Implementation of High Quality-Factor On-Chip Tuned
Microwave Resonators at 7 GHz
This section is based on the publication “Implementation of High Quality-Factor On-Chip Tuned Microwave Resonators at 7 GHz” R. Melik and H.V. Demir, Microwave and Optical
Technology Letters 51, 497-501 (2009). Reproduced (or ‘Reproduced in part’) with permission
from Wiley Periodicals, Inc. Copyright 2008 Wiley Periodicals, Inc.
In this section [15], we report on the design, analytical modeling, numerical simulation, fabrication, and experimental characterization of chip-scale microwave resonators that exhibit high factors in the microwave frequency range (at 7 GHz). We demonstrate high
quality-6
factors by tuning these microwave resonators with the film capacitance of their LC tank circuits rather than the conventional approach of using external capacitors for tuning. Our chip-scale resonator design further minimizes energy losses and reduces the effect of skin depth leading to high quality factors even for significantly reduced device areas. Using our new design methodology, we observe that despite the higher resonance frequency and smaller chip size, the quality-factor is improved compared to the previous literature using traditional approaches. For our 540 μm × 540 µm resonator chip, we theoretically compute a quality -factor of 52.40 at the calculated resonance frequency of 6.70 GHz and experimentally demonstrate a quality-factor of 47.10 at the measured resonance frequency of 6.97 GHz. We thus achieve optimal design for on-chip microwave resonators with the highest quality-factor in the smallest space for operation at 6.97 GHz.
2.1.1 Introduction
High quality-factor (Q-factor) resonators are required for good performance in applications such as microwave devices, mobile phones, radars, wireless universal serial buses (USB), and wireless local area networks (WLAN). In such applications, on-chip resonators are preferred because they reduce power consumption, prevent connection losses, and facilitate on-chip integration. These lead to compact, low-cost systems. However, it is difficult to produce chip-scale, small-size resonators that exhibit high Q-factors at high frequencies. In general, smaller resonators yield lower Q-factors. To date, microwave resonators based on on-chip spiral coils have been successfully demonstrated, with unloaded Q-factors of inductors up to a maximum of 40 at 5 GHz [16] and 50 at 2 GHz [17]. In these studies, to realize resonators using inductors, external capacitors are used to tune the inductors, which undesirably increase the effective device area and decrease the resonator Q-factor. The use of such an externally connected capacitor further results in longer propagation times and fewer operating channels for communication. Also, it has been shown that higher Q-factors can be achieved using cavity geometries. But, this also comes at the cost of significantly increased size, resulting in much larger chips (as long as several millimeters on one side) [18] and in more complicated fabrication steps. Therefore, these are not