Diagnostic importance of maximum intensity
projection technique in the identification of
small pulmonary nodules with computed
tomography
doi • 10.5578/tt.68561 Tuberk Toraks 2020;68(1):35-42
Geliş Tarihi/Received: 26.07.2019 • Kabul Ediliş Tarihi/Accepted: 16.02.2020
KLİNİK Ç
ALIŞMA
RESEARCH
AR
TICLE
Pınar GÜLERYÜZ KIZIL1(ID)Koray HEKİMOĞLU2(ID) Mehmet COŞKUN2(ID) Şule AKÇAY3(ID)
1Department of Radiology, Faculty of Medicine, TOBB Economy and
Technology University, Ankara, Turkey
1TOBB Ekonomi ve Teknoloji Üniversitesi Tıp Fakültesi, Radyoloji Anabilim Dalı, Ankara, Türkiye
2Department of Radiology, Faculty of Medicine Ankara Hospital, Baskent
University, Ankara, Turkey
2 Başkent Üniversitesi Tıp Fakültesi Ankara Hastanesi, Radyoloji Anabilim Dalı, Ankara, Türkiye
3Department of Chest Diseases, Faculty of Medicine Ankara Hospital,
Baskent University, Ankara, Turkey
3 Başkent Üniversitesi Tıp Fakültesi Ankara Hastanesi, Göğüs Hastalıkları Anabilim Dalı, Ankara, Türkiye
ABSTRACT
Diagnostic importance of maximum intensity projection technique in the identification of small pulmonary nodules with computed tomography Introduction: In this retrospective study, the aim is to determine the sensitivity of maximum intensity projection (MIP) technique to 3 mm-thick axial sections in patients with small pulmonary nodules identified via examination using compu-ted tomography (CT), and to identify whether this technique provides significant reduction in duration of nodule evaluation.
Materials and Methods: A total of 69 patients (339 nodules) who underwent thoracic tomography due to various complaints and in whom pulmonary nodules were identified as a result of the examination were included in the study. Their axial sections that are 3 mm-thick and MIP sections obtained in the axial plane were evaluated by two different radiologists at different times by keeping time. The dimensions and evaluation times of the nodules were recorded separately for each method.
Results: Evaluation compatibility between the radiologists was found to be 86.8% and it was considered to be perfectly compatible. Sensitivity of the 1st radiologist in the detection of nodules with MIP was 81.4%, whereas the sensitivity of the 2nd radiologist was 83.4%. In the evaluation for the reporting periods, when the duration of evaluation of MIP images were compared with the gold standard, a statistically significant reduction was found in the repor-ting times of both radiologists (p< 0.01).
Dr. Pınar GÜLERYÜZ KIZIL
TOBB Ekonomi ve Teknoloji Üniversitesi Tıp Fakültesi, Radyoloji Anabilim Dalı, ANKARA - TÜRKİYE
e-mail: [email protected]
Yazışma Adresi (Address for Correspondence)
Cite this article as: Güleryüz Kızıl P, Hekimoğlu K,
Coşkun M, Akçay Ş. Diagnostic importance of maximum intensity projection technique in the identification of small pulmonary nodules with computed tomography. Tuberk Toraks 2020;68(1):35-42.
©Copyright 2020 by Tuberculosis and Thorax. Available on-line at www.tuberktoraks.org.com
INTRODUCTION
Pulmonary nodule is one of the most important pul-monary pathologies, with round or oval parenchymal lesions less than 3 cm in diameter which are sur-rounded by lung parenchyma (1).
Computed tomography (CT) is the imaging modality with the highest sensitivity that is most frequently used in the detection and follow up of pulmonary nodules today (2). Small pulmonary nodules in par-ticular can be missed during the evaluation due to atypical localization or vascular neighborhood pri-marily because of the CT techniques and thus can be overlooked by the radiologist. Although it theoretical-ly makes sense to thin out the section thickness to increase the sensitivity of CT to detect the small nodules, evaluation of many sections generated by this method by a single radiologist increases the prob-ability of overlooking the nodules and causes the duration of evaluation to increase (3). In the recent years, maximum intensity projection (MIP) method, a CT imaging software where three or four of the axial sections obtained during the routine CT evaluation are combined and reformatted and thick sections (slabs) in which formations with high density are
highlighted, has started to be used and is becoming increasingly common. Unlike original axial images, this method accentuates the contrast between the nodule and surrounding parenchyma and contributes to the noticeability of the nodule in the detection of pulmonary nodules (4,5).
The aim of this study is to determine the level of sen-sitivity of MIP technique in the detection of small pulmonary nodules and to investigate whether the potential reduction provided by this technique in the duration of nodule evaluation is significant.
MATERIALS and METHODS Patients
Approval of the local ethics committee was obtained for this study. Patients who underwent thorax CT due to various indications and were found to have pulmo-nary nodules between April 2012 and December 2012 were selected based on the retrospective evalu-ation of their thorax CT reports for a re-evaluevalu-ation. In order for an easy interpretation of the nodules, most-ly the patients with nodules with a diameter between 4-10 mm were preferred. Based on this, a total of 69 patients, 37 (54%) of which are female and 32 (46%)
Conclusion: It was found that utilization of MIP images as an alternative method to detect pulmonary modules reduces the duration of evaluation significantly and provides the ability to detect nodules with high sensitivity. According to these data, MIP imaging may be preferred as an adjunct method in the evaluation of lung nodules as it provides fast and reliable information besides classical axial sections.
Key words:Pulmonary nodules; computed tomography; maximum intensity projection ÖZ
Küçük boyutlu akciğer nodüllerinin bilgisayarlı tomografi ile saptanmasında maksimum intensite projeksiyon tekniğinin önemi Giriş: Bu retrospektif çalışmada bilgisayarlı tomografi incelemesi ile küçük boyutlu pulmoner nodül saptanan hastalarda, “Maximum Intensity Projection (MIP)” tekniğinin, 3 mm’lik aksiyel kesitlere göre duyarlılığının saptanması ve bu tekniğin nodül değerlendirme süresinde anlamlı düzeyde süre kısalması sağlayıp sağlamadığını belirleyebilmektir.
Materyal ve Metod: Çeşitli şikayetlerle toraks tomografisi çekilen ve değerlendirme sonucu akciğer nodülü saptanan 69 (339 nodül) hasta çalışmaya dahil edildi. Hastaların 3 mm kalınlıktaki aksiyel kesitleri ile aksiyel planda alınan MIP kesitleri farklı zamanlarda süre tutularak, ayrı ayrı iki radyolog tarafından önceki raporları dikkate alınmadan değerlendirildi. Nodüllerin boyutları ve değerlendirme süreleri her bir yöntem için ayrı olarak kayıt edildi.
Bulgular: Radyologlar arası değerlendirme uyumu %86.8 saptanmış olup mükemmel uyumlu bulunmuştur. Birinci radyoloğun MIP ile nodül tespitindeki duyarlılığı %81.4 iken, ikinci radyoloğun duyarlılık düzeyi %83.4 olarak saptanmıştır. Raporlama süreleri açı-sından yapılan incelemede MIP görüntülerini değerlendirme sürelerinin altın standartla karşılaştırıldığında her iki radyolog için de raporlama sürelerinde istatistiksel olarak anlamlı düzeyde kısalma bulunmuştur (p< 0.01).
Sonuç: Akciğer nodüllerinin saptanmasında alternatif bir yöntem olarak MIP görüntüler kullanılmasının değerlendirme süresini anlam-lı derecede kısalttığı ve yüksek duyaranlam-lıanlam-lıkta nodül saptama özelliği gösterdiği saptanmıştır. Bu verilere göre MIP görüntüleme, akciğer nodüllerinin değerlendirilmesinde klasik aksiyel kesitler yanında, hızlı ve güvenilir bilgi vermesi nedeniyle yardımcı yöntem olarak tercih edilebilecektir.
of which are male, with ages between 22-87 (mean age 56 ± 12.65 years), who have images in PACS archiving system, were included in the study. Computer Tomography Technique
Attention was paid to evaluate all patients with the same CT device (Sensation 16, Siemens). It was found that thorax CT evaluations in all cases was performed on 3 mm section thickness, using approx-imately 100 kV, 120 mAs protocol. In order to re-evaluate the images, 3 mm-thick routine images and MIP images obtained using these images were uploaded to the workstation (Leonardo Multimodality Workstation, Siemens) where the re-evaluation will be performed. To evaluate areas of parenchyma, stan-dard lung parenchyma window settings were used (window level – 700 HU, window width 1.200 HU). However, no limitations were made for the readers to manipulate the window settings when evaluating the images.
Image Analysis
Prior to re-evaluation, it was decided that nodules larger than 10 mm and smaller than 4 mm in diame-ter or nodules with issues such as fibrosis, sequela changes or atelectasia accompanying the nodule will not be evaluated. As nodules smaller than 4 mm in diameter does not require follow-up except in high risk patients as recommended in Fleschner Classification, and MIP imaging provides and exag-gerated image of the nodules and creates difficulties in distinguishing sequela and nodules, these were not included in the evaluation based on the joint deci-sion of both observers. No time limitations were applied during the evaluation of the images. However, time was kept using a chronometer during the evalu-ation of the case images. Chronometer was started when the radiologists started the evaluation and chronometer was stopped when the nodule evalua-tion finished, and the evaluaevalua-tion duraevalua-tions were recorded.
Cases were performed by two radiologists with at least 15 years of experience in thoracic CT reporting. In each period, firstly, radiologists separately and blindly analyzed the 3 mm-thick images of the cases, and evaluated the number, localization and size of the nodules. For nodule size measurement, the larg-est diameter in the transverse plane was evaluated and analyzed by dividing into two groups as 4-5 mm and 5-10 mm. Nodules were recorded as sizes on the
pre-prepared evaluation form. Then, the same proce-dure was performed for the MIP images of all patients. Histopathological confirmation of the nod-ules for diagnostic accuracy was not required. Images that were 3 mm-thick and obtained in routine thorac-ic CT evaluations in our center were first individually evaluated by both of the observers, and then joint evaluation was performed for different interpreta-tions, and the gold standard for the study was estab-lished.
MIP images and 3 mm-thick sections, which were set as the gold standard, were compared and sensitivity and positive predictive value (PPV) were calculated. Since there weren’t any true negative patients, speci-ficity and negative predictive value could not be calculated.
Statistical Analysis
Statistical analyses were performed with Statistical Package for Social Sciences (SPSS), 17.0 (IBM, SPSS Corp.; Armonk, NY, USA).
Among the groups, whether there was concordance between the MIP technique and the gold standard and between the observers was evaluated using “Intraclass correlation coefficient”. For intraobserver concordance, a value below 0.20 was accepted as very poor concordance, between 0.21-0.40 as poor concordance, between 0.41-0.60 as moderate con-cordance, between 0.61-0.80 as high concon-cordance, and between 0.81-1 as perfect concordance. To evaluate whether there was a significant differ-ence between the groups in terms of the duration of evaluation, “Paired Sample T-Test” was used. p< 0.05 was considered statistiscally significant.
RESULTS
In the separate and joint evaluations by both radiolo-gists of the 3 mm-thick sections of 69 patients includ-ed in the evaluation, a total of 339 nodules were detected. Of these nodules, 152 (45%) had a diame-ter smaller than 5 mm, and 187 (55%) between 5-10 mm (Figure 1-4).
In the evaluations of the MIP images of detected nod-ules, the first observer detected 276 of 339 nodules (81.4%) by looking at the MIP images alone. Of these nodules, 116 (76.3%) had a diameter less than 5 mm, 160 (85.5%) between 5-10 mm. When this observa-tion was compared with the gold standard, it was found that 19 of the nodules in the group with a
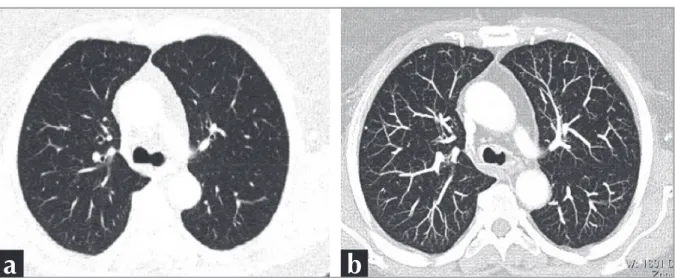
Figure 1. a. 47-year-old male patient. In figure 1a shows a nodule in the apical segment of upper lobe of the right lung in a 3-mm
axial section. In figure 1b, the nodule in the upper lobe of the right lung is more clearly seen in axial MIP sections, apart from the vascular structures.
a
b
Figure 2. A 67-year-old female patient. In figure 2a, in 3 mm axial sections, the nodule is seen in the lower lobe of right lung. In figure
2b, in the axial MIP sections, the nodule in the lower lobe of the right lung is more clearly observed and detected by both observers.
a
b
Figure 3. A 64-year-old female patient. Figure 3a shows a peripheral nodule in the right lung in axial 3 mm sections. In figure 3b,
axial MIP sections show a more accurate nodule in the periphery of the right lung.
diameter less than 5 mm and 9 of the nodules in the group with a diameter between 5-10 mm were not actual nodules. These were recorded as false posi-tives (Table 1).
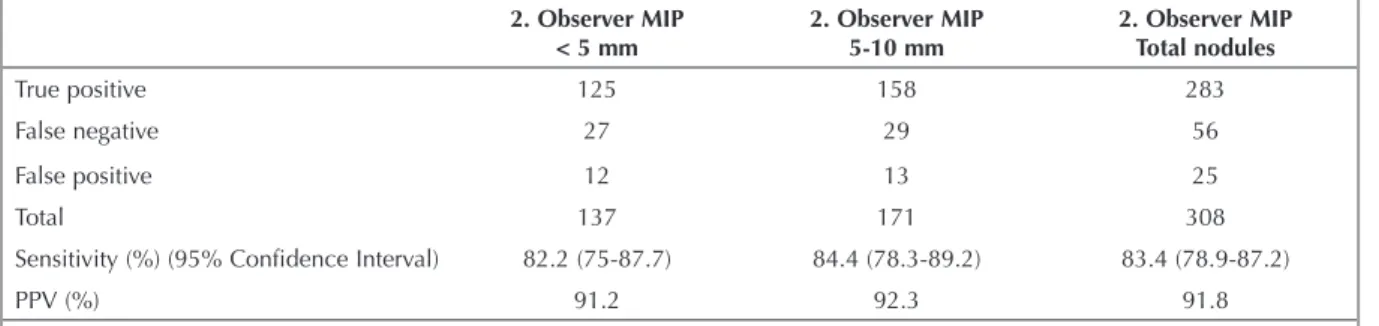
In the evaluation of MIP images of detected nodules, the second observer detected 283 of the 339 nodules (83.4%). Of these nodules, 125 (82.2%) had a
diam-eter smaller than 5 mm, and 158 (84.4%) between 5-10 mm. Similar to the previous evaluation, upon comparison with the gold standard, 12 nodules with a diameter less than 5 mm and 13 nodules with a diameter between 5-10 mm were not actual nodules. These were recorded as false positives of the second observer (Table 2).
Figure 4. A 61-year-old male patient has multiple nodules on the right lung in figure 4a. In figure 4b, the nodules are more densely
and clearly observed.
a
b
Table 1. Sensitivity and PPV of the MIP for the first observer in nodule detection
1. Observer MIP
< 5 mm 1. Observer MIP 5-10 mm 1. Observer MIP Total nodules
True positive 116 160 276
False negative 36 27 63
False positive 19 9 28
Total 135 169 304
Sensitivity (%) (95% Confidence Interval) 76.3 (68.6-82.6) 85.5 (79.5-90.1) 81.4 (76.7-85.3)
PPV (%) 85.9 94.6 90.7
PPV: Positive predictive value, MIP: Maximum intensity projection.
Table 2. Sensitivity and PPV of the MIP for the second observer in nodule detection
2. Observer MIP
< 5 mm 2. Observer MIP 5-10 mm 2. Observer MIP Total nodules
True positive 125 158 283
False negative 27 29 56
False positive 12 13 25
Total 137 171 308
Sensitivity (%) (95% Confidence Interval) 82.2 (75-87.7) 84.4 (78.3-89.2) 83.4 (78.9-87.2)
PPV (%) 91.2 92.3 91.8
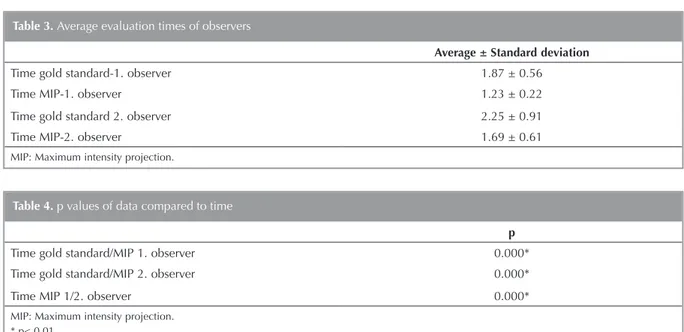
In the second stage of the evaluations, gold standard and the MIP evaluation durations of the observers were compared and whether there was a significant change in the duration of MIP evaluations were investigated. In both groups, evaluation durations of both observers were compared using Paired Sample T-Test. For the first observer, the mean duration of evaluation of the 3 mm-thick sections was 1.87 ± 0.56 minutes, and the mean duration of evaluation of the MIP images was 1.23 ± 0.22 minutes. For the second observer, the mean duration of evaluation of the 3 mm-thick sections was 2.25 ± 0.91 minutes, and the mean duration of evaluation of the MIP images was 1.69 ± 0.61 minutes. The statistical anal-ysis has shown that both observers have evaluated the MIP images in a significantly shorter time (p< 0.05). Moreover, when the duration of evaluation of MIP images of the two observers were compared, the difference was found to be statistically significant (Table 3 and 4). It was concluded that this result is related to the difference in sensitivity in the detec-tion of nodules with a diameter less than 5 mm. DISCUSSION
The most important advantage of MIP imaging is that it increases noticeability as it accentuates the forma-tions with high density and shows them as more hyperdense than the surrounding structure. With this property, vascular structures filled with contrasting agents, pulmonary nodules, calcifications and
for-eign substances can be more clearly and dramatical-ly detected during the anadramatical-lysis of images. In this context, it saves the time spent and labour loss in the course of reporting (5).
In the recent studies on the sensitivity in the detec-tion of pulmonary nodules using MIP imaging, very high sensitivity values were found. In the study by Grudent et al. (4), MIP images were compared with 3 mm-thick axial sections and it was shown that MIP evaluation detects the nodules within a shorter time and is more sensitive in nodule detection compared with axial sections.
In the study by Jankowski et al. (6), MIP images were compared with 1 mm-thick axial images and no sig-nificant difference was detected between the two modalities in terms of nodule detection, but it was concluded that MIP images are evaluated within a shorter time.
Valencia et al. (7) have compared 1 mm and 5 mm-thick CT sections with MIP imaging and found that the sensitivity in MIP evaluation is higher than the CT evaluation using both sections. In the study by Coakley et al. (8) on CT imaging on animals, 5 mm-thick sections were compared with MIP images and it was found that the detection rate of pulmo-nary nodules increases by 2.18% with MIP imaging. In the study by Kilburn et al. (9) on MIP imaging, pulmonary nodules in pediatric patients were evalu-ated using MIP imaging and 2 mm-thick axial sec-Table 3. Average evaluation times of observers
Average ± Standard deviation
Time gold standard-1. observer 1.87 ± 0.56
Time MIP-1. observer 1.23 ± 0.22
Time gold standard 2. observer 2.25 ± 0.91
Time MIP-2. observer 1.69 ± 0.61
MIP: Maximum intensity projection.
Table 4. p values of data compared to time
p
Time gold standard/MIP 1. observer 0.000*
Time gold standard/MIP 2. observer 0.000*
Time MIP 1/2. observer 0.000*
MIP: Maximum intensity projection. * p< 0.01.
tions. In the said study, joint evaluation of 2 mm-thick sections was accepted as the gold stan-dard, MIP and 2 mm-thick sections were evaluated at different times and it was emphasized that the sensitivity of MIP images were much higher. Similar to our study, this study has also found that there can be more false positive values in MIP imaging. Moreover, in the study by Gruden et al. (4), a patient’s 3 mm-thick axial section was evaluated first, immediately followed by the patient’s MIP sec-tion, and additional nodules detected in MIP were recorded. In our study, axial 3 mm-thick sections and MIP sections were evaluated separately at differ-ent times as it was considered it would be more accurate in detecting the sensitivity of the study, which lead to the generation of false negative results. An overall assessment of all these studies reveals that the sensitivity of MIP imaging in detecting pulmo-nary nodules is superior to the CT evaluations per-formed using 5 mm-thick sections. However, in basic sectional evaluation, the inevitable increase in nodule detection sensitivity as the section thickness decreases is observed in almost all of the studies. In this study which is conducted based on the gold standard images, the mean sensitivity of MIP imag-ing was found to be 82.4%. MIP imagimag-ing sensitivity values in other studies performed on this subject are similar to our study, and are between 77.5% and 86%.
In this study, PPV of MIP imaging recorded by both observers were close in nodules between 5-10 mm, whereas it was higher than the nodules smaller than 5 mm (for both observers, 94.6-92.3 vs. 85.9-91.2). This result was attributed to the fact that detection with CT criteria gets easier as the nodule size increases and false positive values are smaller in nodules between 5-10 mm.
When MIP imaging is evaluated in terms of duration, in the study by Gruden et al. (4), 3 minutes were assigned to axial images and 1 minute for MIP imag-es that were in time limitation when axial and MIP images were evaluated, and nodules detected within this period were included in the evaluation, and it was found that the sensitivity of MIP evaluation was higher. In the study by Kilburn et al. (9), there were no time limitations when evaluating axial and MIP images and recorded the evaluation durations as they have done in this study.
In this study, there were no time limitations during the evaluation when analyzing axial and MIP imag-es. The reason behind this is not only to investigate the sensitivity of MIP in nodule evaluation but also to identify its contribution to evaluation durations. Both observers have evaluated MIP images in a sta-tistically significantly shorter time than 3 mm-thick axial images. Moreover, it was found that the first observer evaluated MIP images in a relatively shorter
time than the 2nd observer. Consequently, it was
found that the sensitivity of the 2nd observer, who
performed MIP evaluation in a relatively longer time, in detecting the nodules smaller than 5 mm is higher
than the 1st observer.
The greatest limitation of the study is that the false positive evaluations in MIP imaging in this study are relatively high in number. This outcome, which was observed in almost all studies in this subject, was also detected in this study. The most important cause of false positive results in this study is the exclusion of nodules between 3-4 mm from the study.
MIP imaging shows pulmonary nodules as more dense, MIP evaluation of nodules between 3-4 mm that were excluded from the study causes their diam-eters to be measured larger, and false positive nod-ules can be observed particularly when subpleural sequela changes are visualized with MIP imaging. Consequently, nodules that were actually nodules but were excluded from the study because of their diameter and subpleural sequela changes caused the false positivity to increase particularly in nodules smaller than 5 mm. In the study by Gruden et al. (4), nodules between 3-9 mm were included in the study, and excluded nodules smaller than 3 mm as they can affect the sensitivity of the study and set no limitations regarding the nodule size included in the study.
Another limitation of our study was that the interval for nodule diameter in both groups (4-5 mm and 5-10 mm) was high. The nodule diameter interval in the first group (4-5 mm) was 1 mm whereas it was 5 mm in the second group (5-10 mm). The reason behind this grouping by the observers was the higher number of nodules that were smaller than 5 mm and that a follow up was not recommended by the basic protocols such as Fleschner classification for the nodules smaller than 4 mm other than high-risk patients.
The final limitation of the study is the lack of defini-tive histopathological diagnosis of the nodules. In routine clinical practice, histopathological confirma-tion is not done unless there is an increase in the size of pulmonary nodules, and follow-up with CT at regular intervals is recommended. In the similar stud-ies in literature, axial sections or the highest number of nodules detected by the observers are accepted as the gold standard due to these reasons (4,9). In our study, the gold standard was established by the joint decision of both observers as 3 mm-thick axial sec-tions.
In our study, it was shown that evaluation of nodules between 4-10 mm by MIP imaging enables the nod-ules to be detected with high sensitivity and in a sig-nificantly shorter time. Thus, MIP imaging can be recommended in the evaluation of nodules between 4-10 mm. However, considering the limitations of our study, it should be considered as an auxiliary and complementary modality that must be used alongside axial thin sections in nodule evaluation rather than being used alone.
CONFLICT of INTEREST
There is no conflict of interest related to this study. AUTHORSHIP CONTRIBUTIONS
Concept/Design: KH
Analysis/Interpretation: MC, KH Data Acquisition: PGK
Writting: PGK Critical Revision: ŞA Final Approval: KH
REFERENCES
1. Murthy SC, Rice TW. The solitary pulmonary nodule: A primer on diferential diagnosis. Semin Thorac Cardiovasc Surg 2002;14:239-49.
2. Armato SG , Giger ML, Moran CJ, Blackburn JT, Doi K, MacMahon H. Computerized detection of pulmonary nodules on CT scans. Radiographics 1999;19(5):1303-11. 3. Diederich S, Lentschig MG, Overbeck TR, Wormanns D,
Heindel W. Detection of pulmonary nodules at spiral CT: Comparison of maximum intensity projection sliding slabs and single-image reporting. Eur Radiol 2001;11:1345-50. 4. Gruden JF, Ouanounou S, Tigges S. Incremental benefit of
maximum-intensity-projection images on observer detec-tion of small pulmonary nodules revealed by multidetector CT. AJR Am J Roentgenol 2002;179:149-57.
5. Perandini S, Faccioli N, Zaccarella A, Re TJ, Mucelli RP. The diagnostic contribution of CT volumetric rendering tech-niques in routine practice. Indian J Radiol Imaging 2010;20:92-7.
6. Jankowski A, Martinelli T, Timsit JF. Pulmonary nodule detection on MDTC images: evaluation of diagnostic per-formance using thin axial images, maximum intensity pro-jections and computer-assisted detection. Eur Radiol 2007;17:3148-56.
7. Valencia R, Denecke T, Lehmkuhl L, et al. Value of axial and coronal maximum intensity projection (MIP) images in the detection of pulmonary nodules by multislice spiral CT: comparison with axial 1-mm and 5-mm slices. Eur Radiol 2006;16(2):325-32.
8. Coakley FV, Cohen MD, Johnson MS, Gonin R, Hanna MP. Maximum intensity projection images in the detection of simulated pulmonary nodules by spiral CT. Br J Radiol 1998;71:135-40.
9. Kilburn F, Arthurs O, Tasker AD, Set P. Detection of pulmo-nary nodules at paediatric CT: maximum intensity projec-tions and axial source images are complementary. Pediatr Radiol 2013;43:820-6.